
Long post alert
I am a fan of businesses which have revenue streams which are certain and recurring and CDSL seems to be one such business. I have started looking at its 5 year financials and the first part which I want to shed some light on is the Operating revenue.
Firstly, refer to the below graphic (shows standalone numbers):

-
The above shows that the 3 biggest streams of revenue, making up 85% of standalone 2018 operating revenue are: Annual issuer charges, transaction charges, and IPO/Corporate Action charges.
-
Out of these 3, IPO/CAC revenue stream did not exist in 2013. In 2018, it contributed 20% to revenue!
-
The other 2 categories (Annual issuer and transaction charges) combined have almost doubled between 2013 & 2018 but their weight in the overall pie has reduced because 3 new revenue streams (IPO/CAC, E-voting & ECAS charges) have started contributing meaningfully to topline! This shows mgmt is active in exploring new revenue streams and growing the business.
CDSL mainly earns revenue on the basis of number of demat account holders registered with the Depository and on the basis of the transaction volumes generated by the demat account holders.
As has been pointed out above, maximum charges that CDSL can levy are regulated by SEBI.
So this business is mainly about maintaining cost competitiveness & leveraging economies of scale by expanding the breadth of network.
This is also mentioned in the RHP (Refer below extract):

Further, as a monopoly, NSDL used to charge higher transaction charges from users before CDSL came in and NSDL was forced to cut its prices drastically to compete:
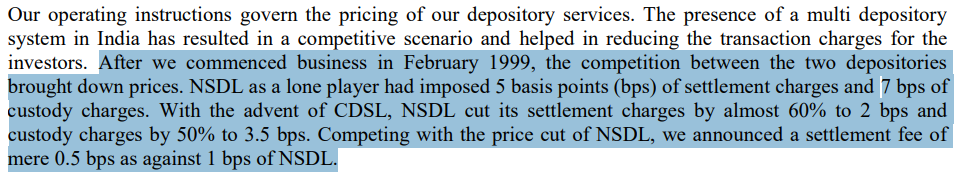
This further proves the the depository business is about maintaining cost leadership with limited scope for value differentiation.
Financialisation theme is real: The demographics of our country (young population, growing awareness of the benefits of investments in financial assets) means that both the DPs have enough room to grow the combined revenue base of approximately 350 crores (standalone) as of FY18.
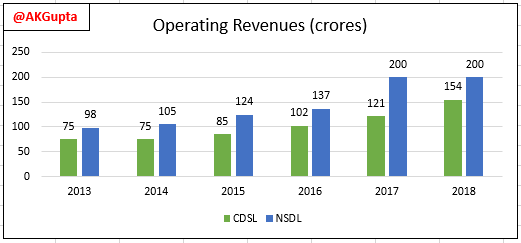
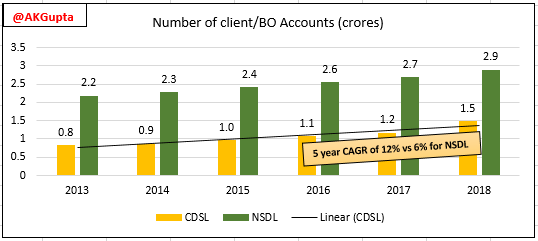
Note in the above, CDSL has been growing revenues consistently while NSDL has flatlined in the last 2 years implying that CDSL has been winning markets share. This is also attested by the growth in incremental client accounts at both the depositories (shown below):
Growing revenues on a fixed cost structure means healthy PAT CAGR on the back of increasing operating leverage! ![]()
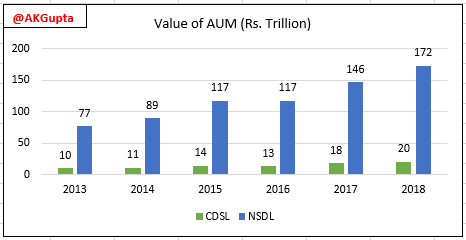
One area of concern I have is the gaping difference in the value of securities held in custody by NSDL in comparison with CDSL (see below chart):
Knowing that:
-
Charges per transaction between the 2 depositories are not very different, and
-
Operating revenue difference between the 2 depositories is not a lot as well (as shown above),
this implies that NSDL has lower number of actively trading members as a ratio of total members as is also attested by the below graphic:
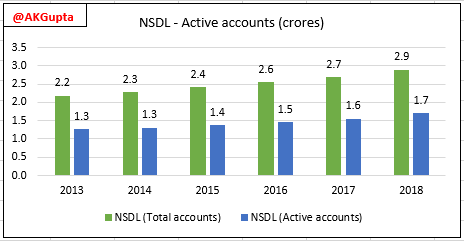
Ratio of active clients to total clients is ~1:2. But the fact still remains that NSDL is managing ~8.5x times money as CDSL which could turn out to be a competitive advantage in the long run for NSDL. (More on this below)
The Network Effect:
The depository business is dependent on the typical network effect, which is measured by the following 4 factors mainly:
-
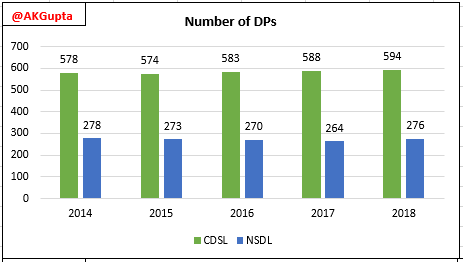
Number of DPs (mostly brokers, banks) enrolled (CDSL leads but that could be because it attracts smaller brokers (with net worth of 1-2 crores) to its fold as well)
-
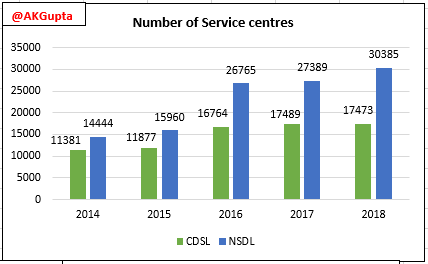
Number of DP service centres/customer touch points (NSDL leads here even with lesser number of DPs…could be because its DPs have a larger branch presence compared with CDSL)
-
Number of client accounts (NSDL leads but CDSL is fast catching up)
-
Value and volume of securities held in custody (CDSL is far behind but both the players are growing well)
-
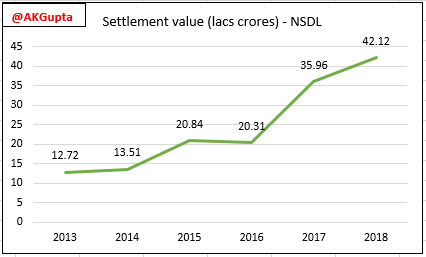
Value of securities traded or settlement volumes (NSDL reports this number in its AR but couldn’t find similar statistic for CDSL…if anyone here comes across this stat for CDSL, kindly share)
-
Number of Issuers registered with the Depository (NSDL is leading and growing faster than CDSL over last 5 years):
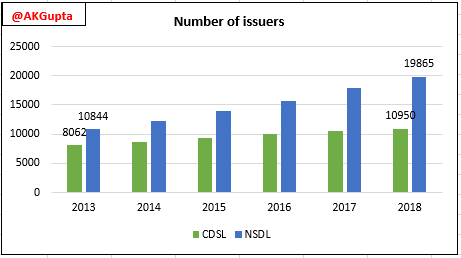
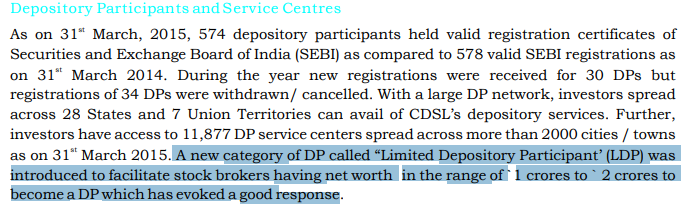
Clearly, CDSL has a larger number of DPs and a larger number of client accounts but it lags behind NSDL in terms of customer touch points and value of AUM. Clearly, NSDL has a better network (bigger brokers are likely to be in business for longer and will have more affluent clientele). Look at the below extract from the 2015 AR where CDSL mentions about the launch of “Limited DP” focused on small brokers.
Summary:
-
CDSL is run by an ambitious mgmt which clearly shows up in revenue CAGR and advent of 3 new revenue streams in last 5 years (diversification of revenue streams is a very good sign!).
-
Depository business is dependent on transaction volumes in capital markets, network breadth & assets under custody. NSDL leads in terms of these metrics but CDSL is playing catch up well in terms of expanding number of DPs, number of issuers and number of client account on its platform. CDSL needs to work on growing its AUM.
-
Depositories don’t have much room to modify prices because of inherent competitiveness and because charges are decided by SEBI so a strict control of costs is necessary. This lends operating leverage when revenues are growing on a fixed cost structure.
-
There is significant room for the overall market to grow and it is already happening and should continue to happen given the dynamics of our country.
Disclosure: Invested recently with a long term outlook. The stats are taken from ARs, RHP for both the depositories