I think this beacuse GNPA is 0.9% as on Mar,17
And on similar levels as on Mar,16
But, they have written off 2.5% of average assets in 2016-2017
I think this beacuse GNPA is 0.9% as on Mar,17
And on similar levels as on Mar,16
But, they have written off 2.5% of average assets in 2016-2017
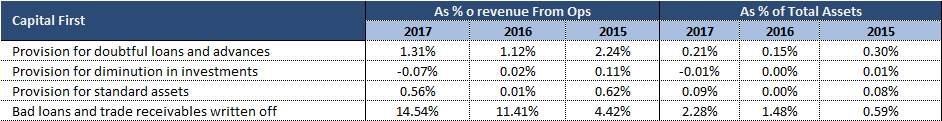
Have compiled some numbers for Capf:
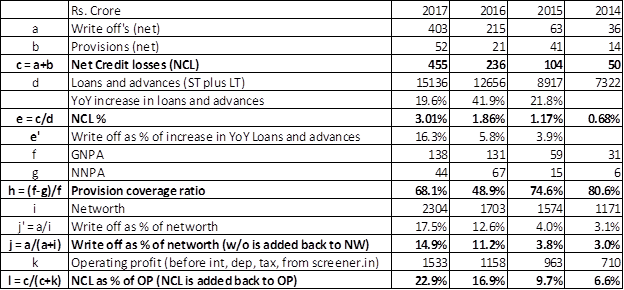
While the mathematics of the formulae are not exact, my focus was on the trend of NCL, PCR and writeoff %, which are all indicating downward trends.
Frankly, the NCL is not shockingly bad in absolute sense (3% NCL as % of loans and 23% as % of OP before NCL, is fine, for the segment the company caters to), particularly when the company is growing at 40% plus. Just in case growth slows down (say, if high base effect kicks in), then the percentages will start looking increasingly worse. However if Bajaj Fin is growing at 40% inspite of being 3-4x the size, my guess is that growth for Capital first may not slow down given the runway.
Coming to the write-off’s in 2017, unless there is some element of one-off in FY17 (maybe due to demonetisation perhaps?), and if the purge has been done in 2017, then the trend may reverse going forward.
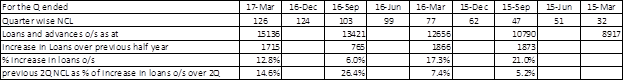
Above table gives NCL relative to the increase in loans and advances for 4 half-year periods. Imagine a tap running from top, and a hole in the bucket. The increase in loans is water being added to the bucket. the NCL is the leakage in the bucket. Higher the leakage, faster the tap has to run so that the bucket continues to remain full.
Loan growth in HY-Sep16 was just 6% which inflates the NCL to 26.4% (not sure why the loan growth was so low). During demonetisation, the NCLs have increased during Q3 and Q4. It is possible that the management has actually been prudent and taken some accelerated write-off’s? And if indeed the management has been conservative, there could be write-backs as well. However at this juncture, this is just my conjecture.
In this period the loan book grew 12.8%. In FY16 and earlier, the figures were not so bad.
In my view, if one trusts the management, one can hold on and see how the numbers pan out over the next 2 Qs, which could indicate if FY17 was one off. Just that one needs to keep in mind that the stock is currently quoting at 3.5x book (excluding 340cr of capital raised recently; including which pb is about 3x) and 30x trailing pe, and whether there is adequate margin of safety to absorb further shocks.
Discl invested from slightly lower levels. Sold a little today to lighten the holding. Will keep reviewing.
Glad that this discussion is getting momentum and everyone is diving really deep to understand blind spots.
@sammy11 - Vinay - Much appreciate your detailed work on adding right perspective to the provision/write-off points.
@Karan - Just awesome for someone who is new to VP. Good work dear.!!!
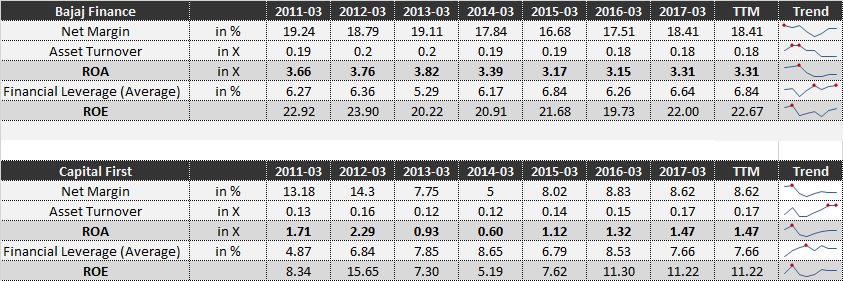
In the initial post I stopped at ROA calc and did not shared the ROE working since for lending entity ROA is considered to be better metric. Here is the upended working summary:
Basis my previous post and again with your data points, by now we agree that the Net Margin % is culprit here for both ROA and ROE numbers. Further agree that ‘other expenses’ differs significantly ~13% between the two and that’s the edge for one over other. However, I would prefer to do little bit of digging before ascribing that this 13% difference is primarily driven by the write-off/provisioning.
.[quote=“Karan, post:135, topic:239”]
This was shocking to me as why other expenses difference is 13%. Digging deep, it came down to two factors.
1- First factor is the provisions and write-offs
[/quote]
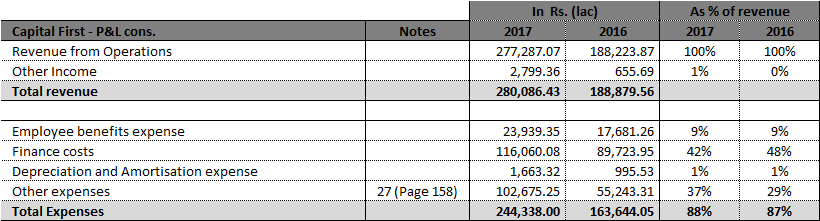
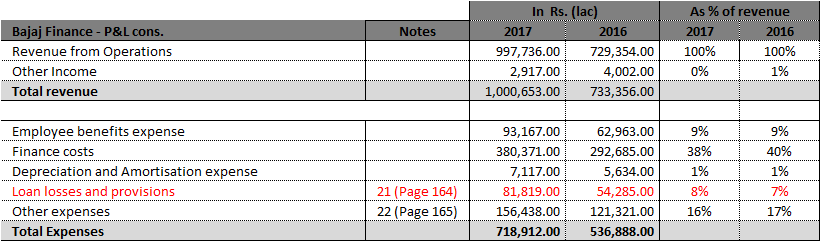
To do justice to this counterpoint, I am trying to use data points extensively from AR2017 for both Capital First and Bajaj Fin. Please bear me if its appears to be number heavy:
As you may have noticed, CapFir has provisions/write-off reported within the '‘other expenses’ while Bajaj Fin has ‘other expenses’ 17% and ‘Loan Loss & provisioning’ of 7%. Therefore, we need to go further level down and scrutinize through the ‘Notes to statement’ to see actual gaps.
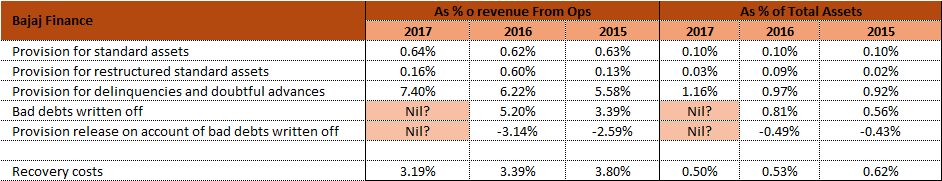
Please note that I am taking the liberty to include ‘Recovery Cost’ from other expenditure and considering those on the lines of write-off/provision etc. Two reasons, a) amount is significantly high ~317 Cr. or ~3% of revenue, b) thinking practical, recovery cost and write-off will have same implication to the business - which is, x rs less recovered against outstanding. (Accounting/regulatory experts please chime-in if I am getting wrong on the practical implication part).
Though not full parity, however now we have somewhat pare-able data. We can study, analyze and drive conclusions.
CapitalFirst’s Provision and Write-off at 16.34%, 12.56% and 7.38% of revenue for 2017, 2016 and 2015 receptively. Consistently higher provision/write-off.
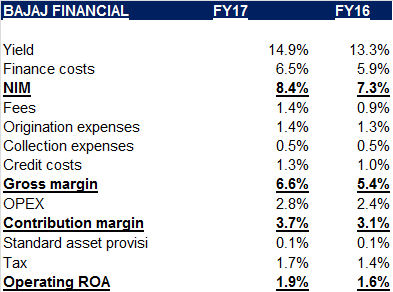
Bajaj Finance Provision and Write-off at 11.39%, 12.90% and 10.94% of revenue for 2017, 2016 and 2015 receptively. Just stable.
Till last year, CapF had comparatively lower numbers under provision etc.
Please take a close look, no numbers reported under ‘Bad debt written-off’ for 2017 for Bajaj Finance though this was significant 5.20% and 3.39% of revenue for 2016 and 2015 respectively. Personally, I hold Bajaj Finance very high on so many aspects (and this keeps increasing as I dive more), however, not easy to envision a landing entity having absolute zero write-off. (not suggesting any red flag, just by that though).
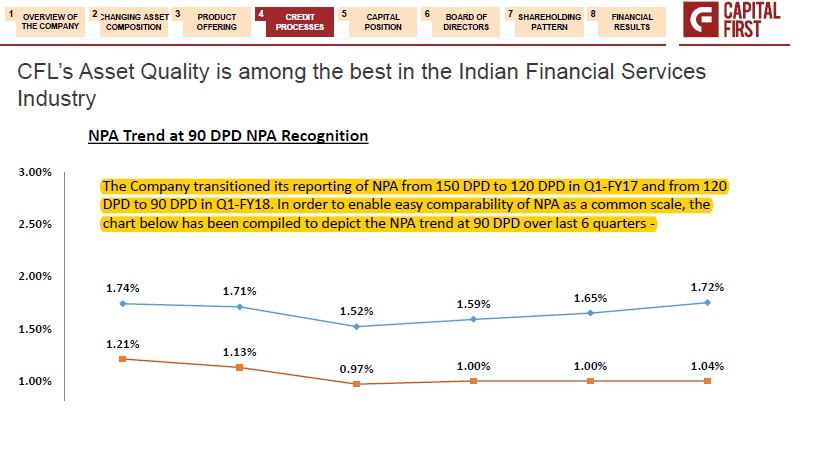
Not with certainty, however, is this higher write-off by CapF to do anything to do with 120 days DPD transition in FY2017. If true, can be a lead indicator on what to expect since NBFCs need to move to 90 days DPD by 2018.
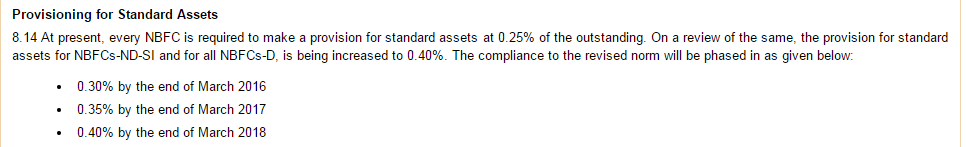
Further, we can expect higher provision for standard Assets as per the RBI Notification 2014-15/299. will Impact both Bajaj Fiance and CapF in FY18 as well though first is NBFC - D (deposit accepting) while later is NBFC - ND - SI.
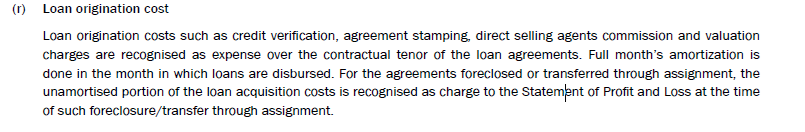
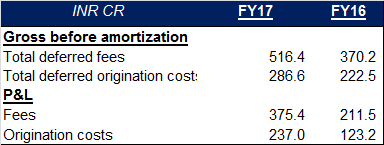
Other key point that Karan delved upon was about Amortization cost for CapF
Very surprising to see approx 8.55% of total revenue going into amortization expenses. As per page 141 of AR, origination cost + expenses are supposed to be amortized equally over loan tenure.
In conclusion, provision/write-off are one of the key watchable in this entire story. Currently also high but not scary high (comparatively speaking). It may has to do with aggressive growth pursued or may have to do with the shift that company is going through on business model. Personally for me, more than the growth, the bet is on transition to retail loan where IRR is better and ticket size is small. That being said, NPA is one of the BIGGEST RISK for any landing entity.
Some documentations for easy reference:
CapF 2017 AR:CFL_AR-2017.pdf (2.2 MB)
Bajaj Fin 2017 AR: Bajaj Financel-annual-report-2017-for-web-indi.pdf (2.2 MB)
Bajaj Finance 2016 AR: bajaj-finance-29th-annual-report - 2015-16.pdf (2.5 MB)
@Karan, @sammy11 and others - Hope we continue the momentum and track it closely on a quarterly basis to see the trajectory.
Regards,
Tarun
Disc: Invested no transaction in last 6 months.
This is some excellent analysis. The breakup above suggests that Capital First write offs are consistently higher than Bajaj Finance and have been increasing. Also Loan origination costs are very very high. There is something that CAPF is not doing right compared to Bajaj Finance and this also explains the huge divergence in valuation - one is trading at 3 - 3.5X book and the other at 8 X. Any thoughts on future trends for CAPF, because if we can see write offs reduce and also loan origination costs settling there might be a good opportunity to invest with a reducing discount to BAJF.
Great discussion. I was intrigued by some of the divergences pointed out so dug into the numbers a little bit.
TL,DR version: Credit quality and cost divergences are not worrying imo given the portfolio differences and after taking into account accounting differences. Capital First compares well on operating costs. It may be ‘discounting’ its yield to grow quicker. The key difference imo for divergences is the higher leverage, higher COF and lower credit rating of Capital First, which may change now that it has gotten a AAA rating, albeit from a small agency.
Disclosure: Invested
More detailed version
Here are my thoughts:
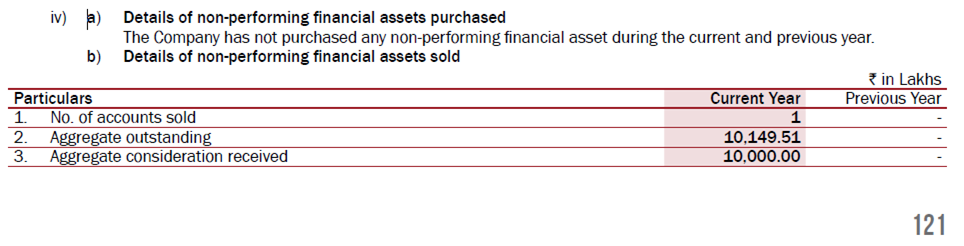
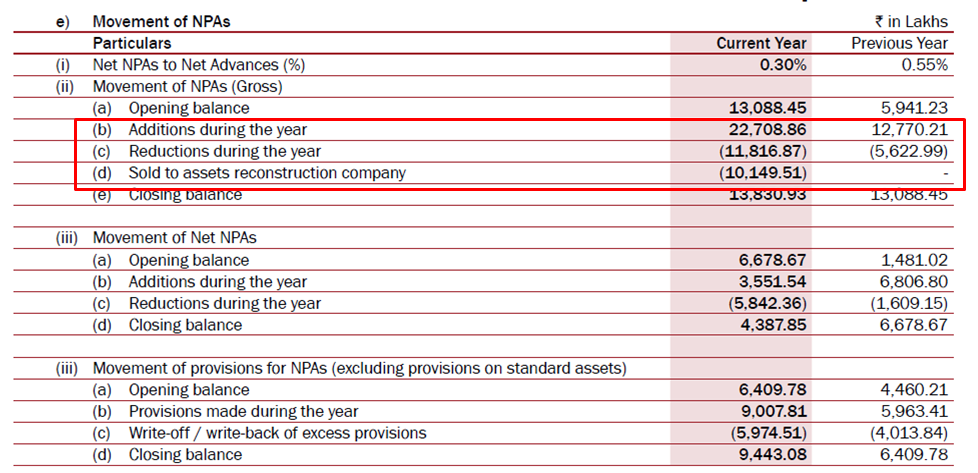
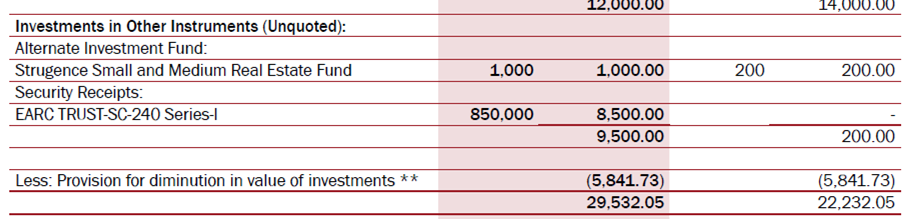
The write offs per se imo are not worrying. For Capital First, a single 100 cr asset seems to have turned NPA and then sold to a ARC, which may have led to some lumpiness in numbers - unsure if this is from the legacy bucket or a newer client. As long as the CRAR is strong, aggressive write offs are prudentially preferable, since for any NBFC this means taking direct knock offs from equity, so the opposite case would be worrying - not being aggressive on provisioning and write offs.
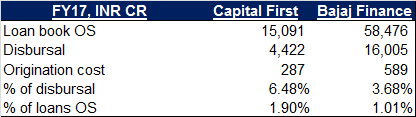
Divergences in origination costs are striking. For Bajaj, I added 3 items - dealer incentives, sourcing costs and back office costs - to roughly match the items considered by Capital First. To arrive at disbursals, I divided the standard asset provisioning by the applicable provisioning rate (0.4% for Bajaj, 0.35% for Capital First) -if someone has the actual data, would be v helpful. I have compared origination costs to the total loan book, and also to disbursals. Here’s a picture:
Given multiple moving parts in the ROA variances, I decided to derive a unit economics table for both NBFCs to identify which component of costs was leading to divergences, after adjusting for differences in accounting. I have omitted all non-operating revenues in these calculations. All figures below are as a % of FY17, FY16 outstanding loan book.
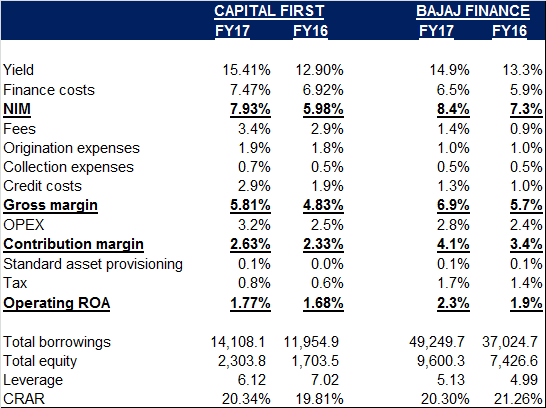
There are some interesting points to note:
Capital First is quite fee heavy vis a vis Bajaj. It earns ~3x the fees with slightly higher yield. This is positive for IRR, and may be part of a competitive strategy to optically match interest rates, while targeting IRR through fees (their higher base of self employed and MSME customers would require higher IRR).
Origination expenses have been discussed above. Item not included here but worth exploring is marketing - 0.9% for Capital First and 0.12% for Bajaj - the latter also enjoys greater brand visibility and synergies in this regard.
Credit costs are ~2x that of Bajaj’s. This in itself is not worrying given the customer profile. I’d expect this to rise with the transition to 90DPD, and would not worry about this as long as CRAR holds up. The write off policy is a positive here, though they do appear to be less conservative on provisioning - again, this may be a function of higher share of LAP loans, and may not be as aggressive as it appears.
Collection and OPEX costs compare favourably, despite Bajaj’s much larger size and assumed operational leverage. With both firms are investing into technology for origination and underwriting, one may not see much divergence in these metrics going ahead.
Standard asset provisioning will rise for Capital First, but as it is a regulatory requirement rather than a credit quality issue, this is fine given the current level of CRAR. Bajaj’s operating ROA will be higher as tax incidence is higher due to ~400 cr of other income.
However, imo, the biggest reason for ROA divergence, after accounting for portfolio / customer variances, is the marginal cost of funding for Capital First. It has only recently received a AAA rating for long term facilities, that too from Brickworks, which is a much smaller credit rating agency, while Bajaj has enjoyed a AAA Crisil rating for some time now. Bajaj is also overall less leveraged, which adds several basis points to its ROA. I would closely watch ratings developments on Capital First that allow it to access cheaper capital to deploy. It has more than enough room to leverage at 20%+ CRAR. Marginal COF on bank loans has also been falling from 10%-10.3% in FY15 to 8.45%-9.2% levels currently. It also has a large share of NCDs, which are priced between 9%-11%. Bajaj by contrast has bank lines at between 8%-9%. I’d expect the management to go for some serious fund raising and refinance in the near future, which should reflect in large BPS improvements. Getting a larger credit rating agency to assign a AAA rating would be a great step.
Hello @vaedermacher,
Good effort, will need some time to chew on the extensive work. You had the question for me about how I was able to get the portfolio composition for CapF. The 93% retail and 7% corporate loan split is from the FY’17 corporate presentation. (unable to attache due to size limit, you can get it from BSE notification section). For the further split of 93%, if I recall correctly I have used Edelwiess or HDFC research report for CapF.
Thanks,
Tarun
I did not know that the AAA that CapFirst has been tom-tomming about is from Brickworks. This AAA does not mean anything. I did not expect this from Vaidyanathan. 
In the past few posts we have dived really deep into the story and all this iterative effort has helped crystallize few things for me.
Hi @vaedermacher - Got some time to soak in the information shared by you. Appreciate your effort. Two quick question, if you want to help understand.
Thanks,
Tarun
Hi @T11,
In case of sell to ARC, financial institution, need to compulsorily provide for loss incurred on sell. In case there is profit on transfer to loan to ARC, same can be booked in P&L only when final cash are realised from ARC from asset resolution. Such unaccounted profit on trasnfer could also be adjsuted against future NAV loss on Security receipt held by the selling institution in future. Just thoght to bring that point to everyone’s attention.,
MOSL initiated coverage with TP of 925 https://www.researchpool.com/provider/motilal-oswal/capital-first-ltd-532938-mosl-capital-first-initiating-coverage-capitalizing-on-multiple-opp
http://www.bseindia.com/xml-data/corpfiling/AttachLive/7841ca77-66bf-4ca8-9ad2-aeeeff00ab71.pdf Capital First Results
http://www.capitalfirst.com/pdfs/investor-relations/Capital_First_Q1_FY18_Corporate_Presentation.pdf Investor Presentation
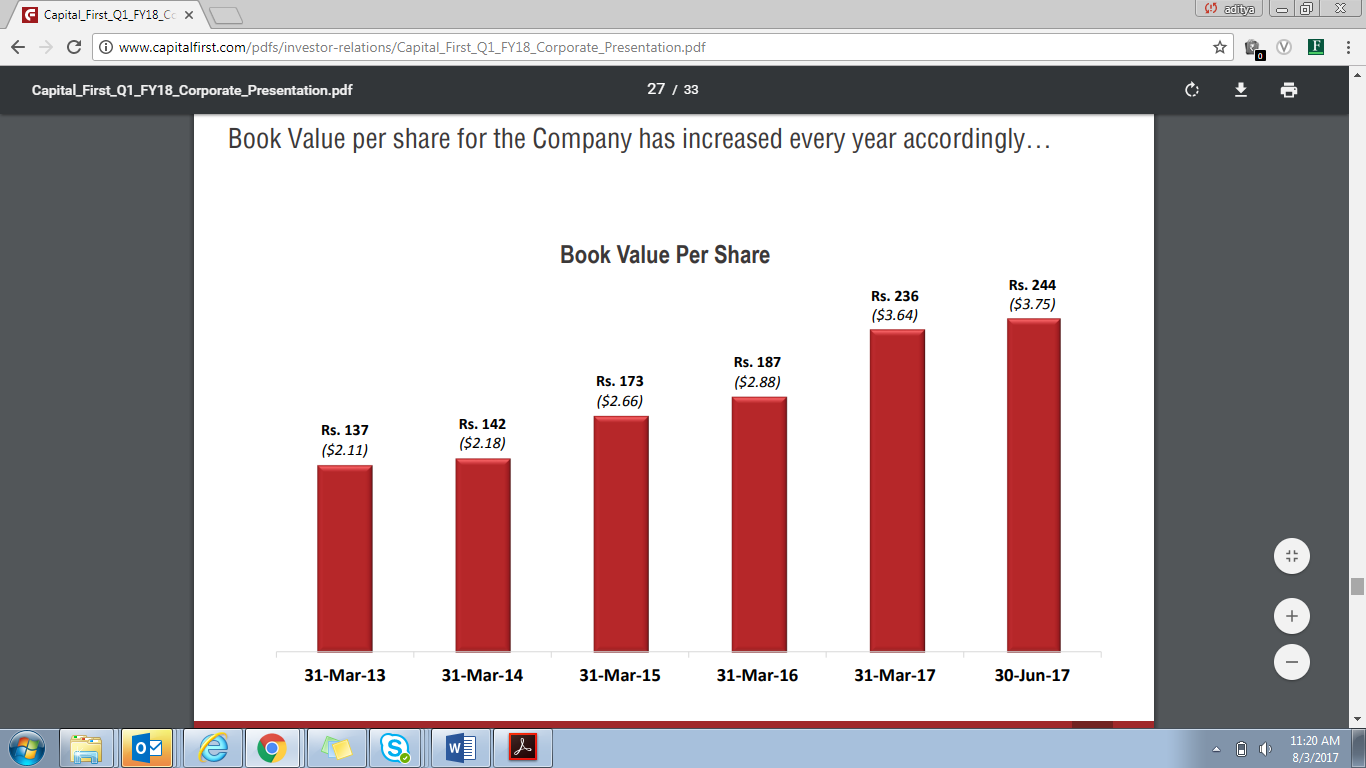
One quick question on the book value growth shown in this presentation.
Refer this slide. isnt this a shady tactic of showing/hiding slow growth in book value if I compare march 2016 and june 2017 numbers?
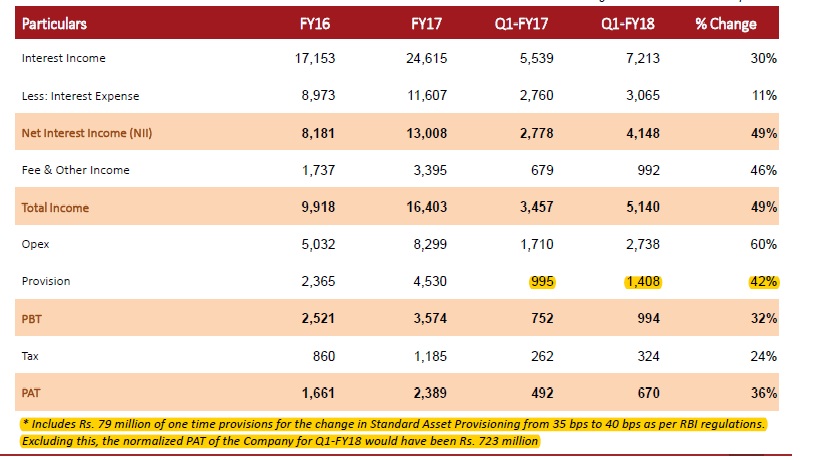
I think above images explain why net profit growth is only 36% yoy despite good growth in NII. Even though they will face strong competition going forward I expect this growth rate to remain above 25%.
I think Capital First is a good company with excellent growth available at decent valuations. There are not many companies which are growing at 30% available at these valuations.
Dscl: Invested so views will be biased.
Excellent discussion in this thread. Capital First has posted 30%+ Loan book growth with all improving parameters in almost all aspects. Book value improved from 187 from Mar’16 to 244 (June’17).
But stock price has gone nowhere. It was 700 in Aug’16 and same again in Aug’17.
What is Mr Market knows in future which is not coming out in current numbers.
Bajaj finance on other hand has gone roaring and doubled in same period and still looking good.
Views invited.
See lower interest rate trajectory for India going forward: Capital First
http://www.moneycontrol.com/news/business/economy/see-lower-interest-rate-trajectory-for-india-going-forward-capital-first-2378281.html