
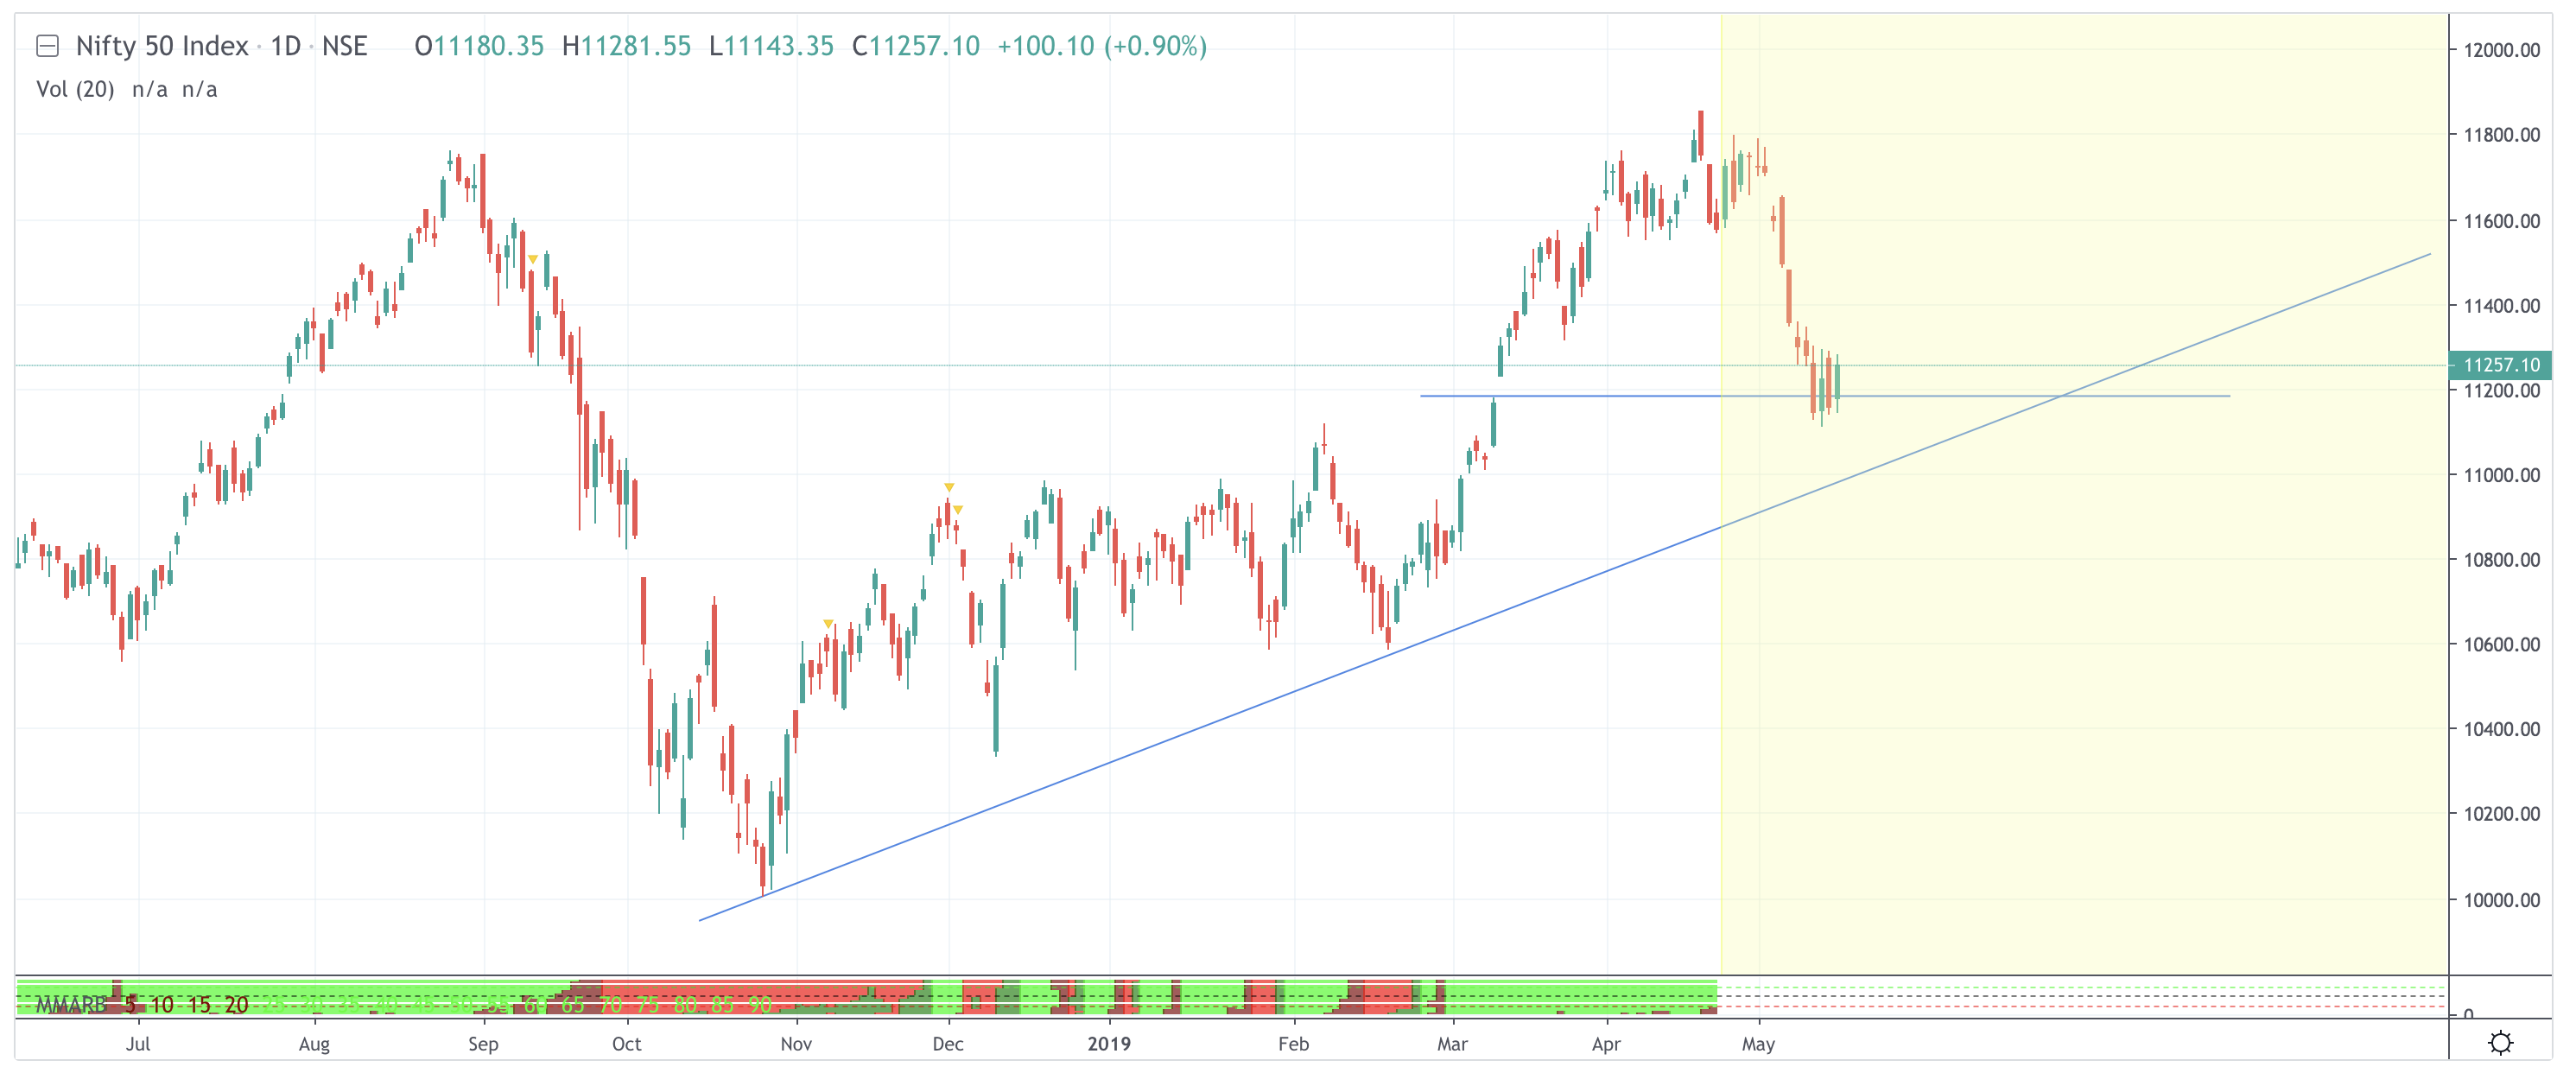
The picture does look like a top H&S. Besides, the pattern is showing up where it should- at the top of an advance. Now it has proceeded to break down and the target comes to roughly around 11250 or so. We are almost there, shy of about 50 points or so. With that move, the implication of the pattern gets over.
The RSI has shown weakness during the push to new highs and is now on a retreat… Trend break and moving beneath the last well defined support near 11550 are signals that confirm the bearish divergence on the Rsi on weekly charts. This warns us not to expect immediate gains in the market.
Question is whether this can be a harbinger of a larger change to the downside?
Nifty has been held up by the efforts of a few stocks. The major section of the market is struggling anyway and is far from the health being displayed by the Nifty. Hence bearishness in Nifty is going to emerge only from actions of large cap stocks. The mid and small cap stand smashed already and have not recovered.
Large caps are mostly held by institutions. These players need changes in valuations to make them sell. Or, a shift in market expectations across a longer time. Election results could certainly provide the latter trigger. Earnings have been mixed for Q4 and one of the main reasons for not selling out is the fear of missing out on upsides in case the Bjp returns to power. But all that can change by the end of the month. To what extent will be decided by the results. Historically, we have seen markets move up from election results more often than they have declined. Cycle studies indicate that a fractured mandate may create some ranging action for the second half of the year.
Hence this time the election results do hold the key. If outcomes are unpalatable, Nifty has room to decline to around 10600.
These are non-technical factors, one may say, but it should be realised that in the short term it is all about Pricing and this is totally based on Momentum and Sentiment. Both of these factors change from day to day and even intra day. Also, they feed on one another in a kind of a limit cycle.
Since we are speaking about an event that is about 2 weeks away, we have to focus on Pricing and hence factors that impact the Sentiment which will drive the momentum which will drive sentiment and so on. As we go closer to the event, no one will be speaking about whether stocks are trading at valuations or not.
Therefore across the next 10 days, any factor that can influence the sentiment will become important. People are nervous but the sharp cut of the last two sessions would have seen a good chunk of leveraged longs being sold out. To that extent the market is lighter. Chances are that shorts are in the system now, something that has not been so for a while.
Light longs and shorts present can be a potent mix for a rise if good news appears. Money flow to the market remains consistent. FII selling is light and FOMO continues to keep buyers locked in. So, while we prepare for a lower zone, we should be equally ready for markets to move up in the event of some surprisingly strong showing by NDA.
I realise that this is not the kind of pat Yes/No answer that many people look for but if the market is not ready to provide it, how can my analysis say different?
Maybe this will also play a spoilsport in short term
Thanks @ckn sir for your extremely rare post but very usable thought process. I would i have ordinarily asked you to post more often but perhaps someone else more adept at persuasion will make that happy outcome happen.
Before you retreat into market tidings i thought if you could share your views in a few areas that i am trying to broaden my horizons and also help the VP community update their beliefs - it would be nice
-
Do you time the broad market? If yes, how has been your experience with market timing? Can it be learnt?
-
What do you think of technical analysts and their predictions? (i realize you are talking about your peers but i would expect nothing else but your usual frankness)
-
What piece of advise would you give to value investors that will make them better at investing?
-
What are the specific things that we should be looking in charts that help us be a bit better at reading them?
-
What are realistic return expectations from the stock market over time, given your vast 30 year experience?
-
Finally, over time what aspect of fundamental analysis has been really instrumental in your stock picks. Earnings, Cash Flows, ROE, ROC etc. Where do your eyes go first when you look at cos financial statements?
Warm Regards
Bheeshma
Bheeshma
Great set of questions and I will be most happy to answer them to the best that I can. You have raised some points that are quite often missed out by most people who play the markets actively- either because they dont value this line of thinking or dont even realise that these are aspects to be considered.
Will answer them one by one and post it as quickly as I can.
Ckn.
Novice. Just asking about your chart for PI Industries where you say it forms a flag. My understanding is that in the flag pattern the upper resistance line and the lower support line run parallel to each other. In this chart they appear to be converging like a triangle. Am I talking through my hat?

I a learning technicals was going through the Chart of Pidilite.
Just wanted to ask was the above classic example of Inverse Head and Shoulders.
Also Wanted input regarding calculating the entry point and the target.
entry point would be on breakout above neckline which you have drawn. Target is from lowest low of head to neckline; projected above neckline to upside.
Thanks a Lot @P-Shekhar Just wanted to confirm has I identified correctly is it a head and shoulder pattern?
Thanks and Regards,
Kapil
Yes bank can be looked at around 120+ levels, which can find some support there. Breaking below that can open another 20% downside, which is at 100 levels.

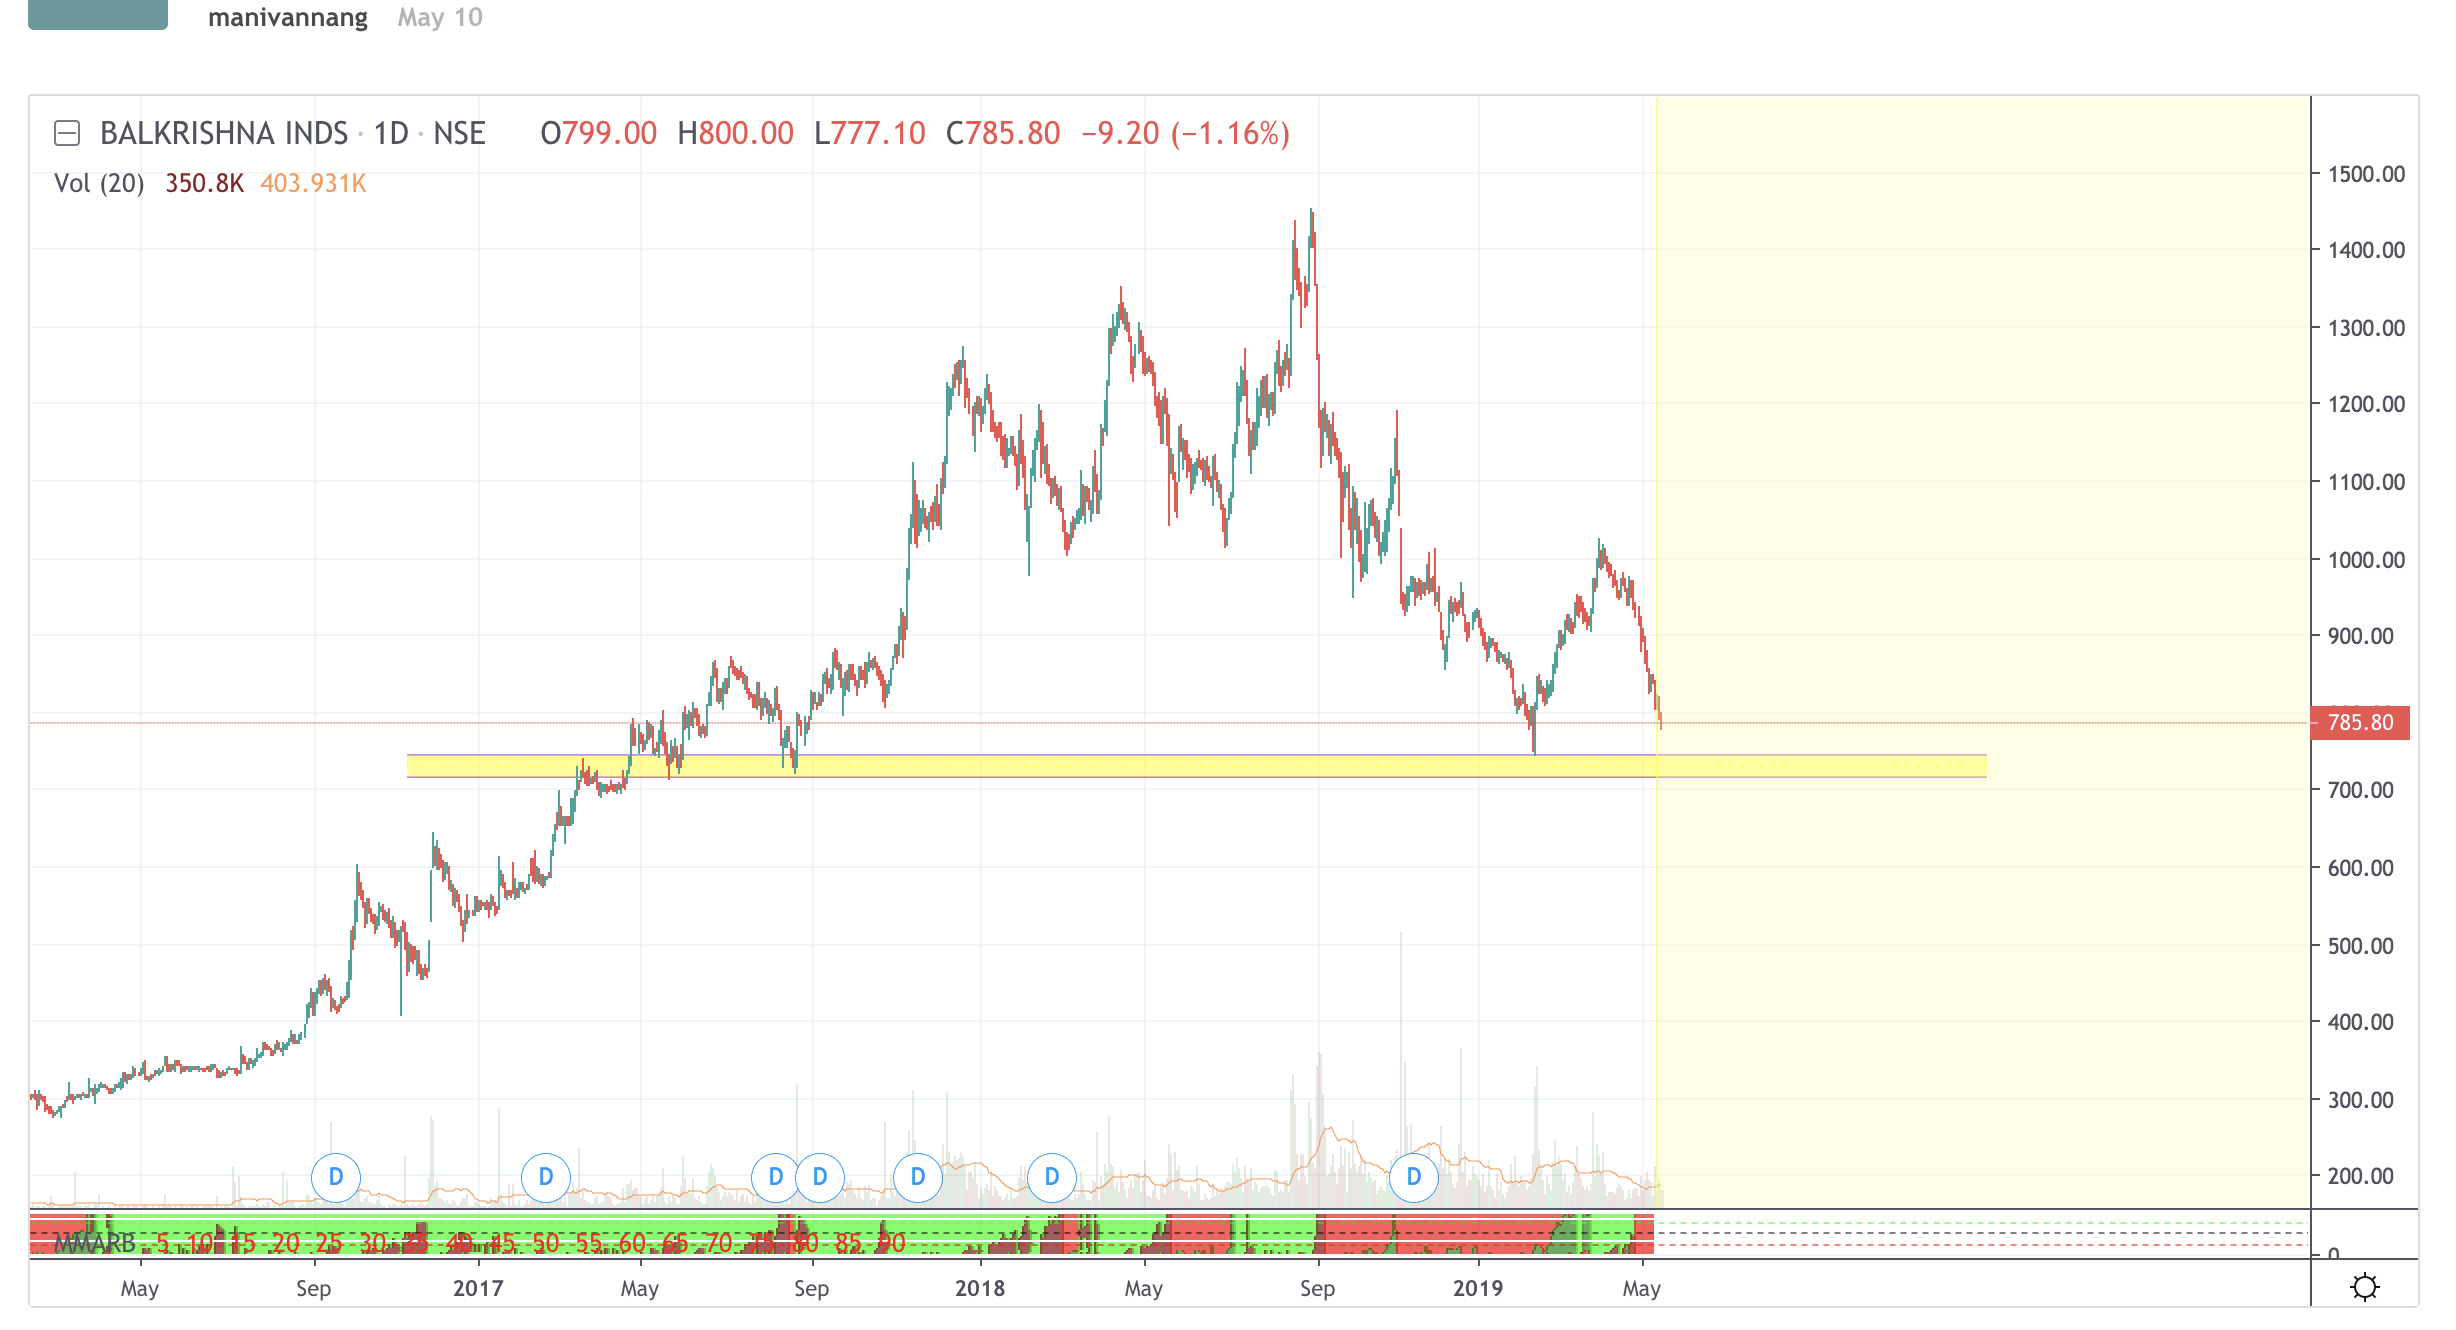
Balkrishna is going towards 750 levels, where it can find multi-year support.
Nifty filled the gap, but not looking convincing enough for the trend reversal, need to watchout.
Update on dhampur, the pattern is broken, although there’s not much of volume:

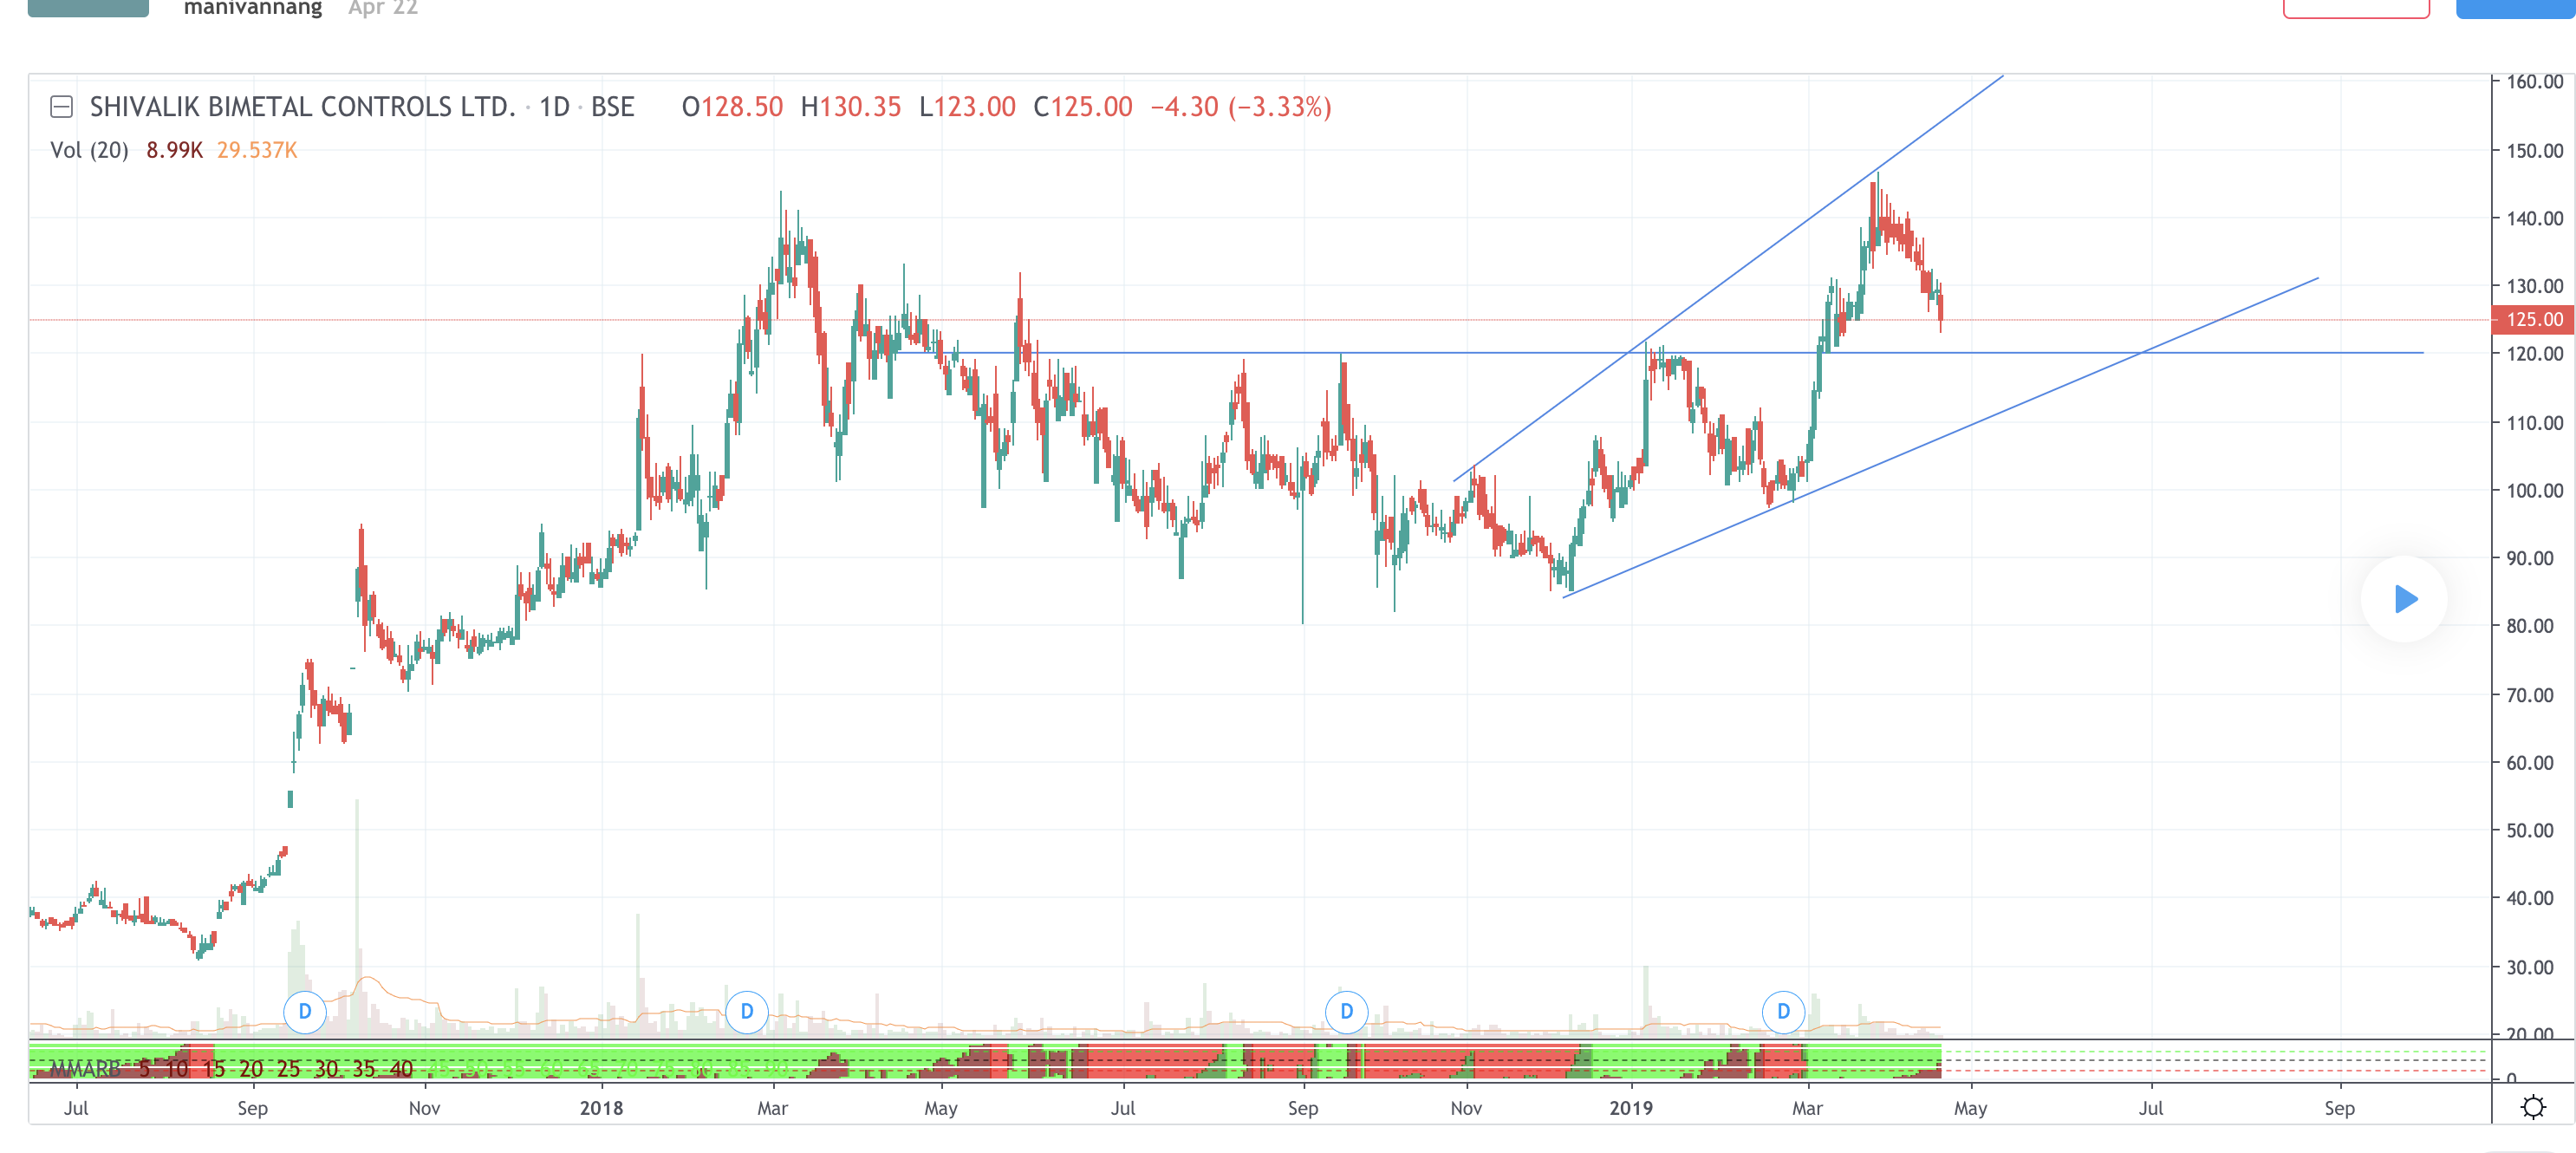
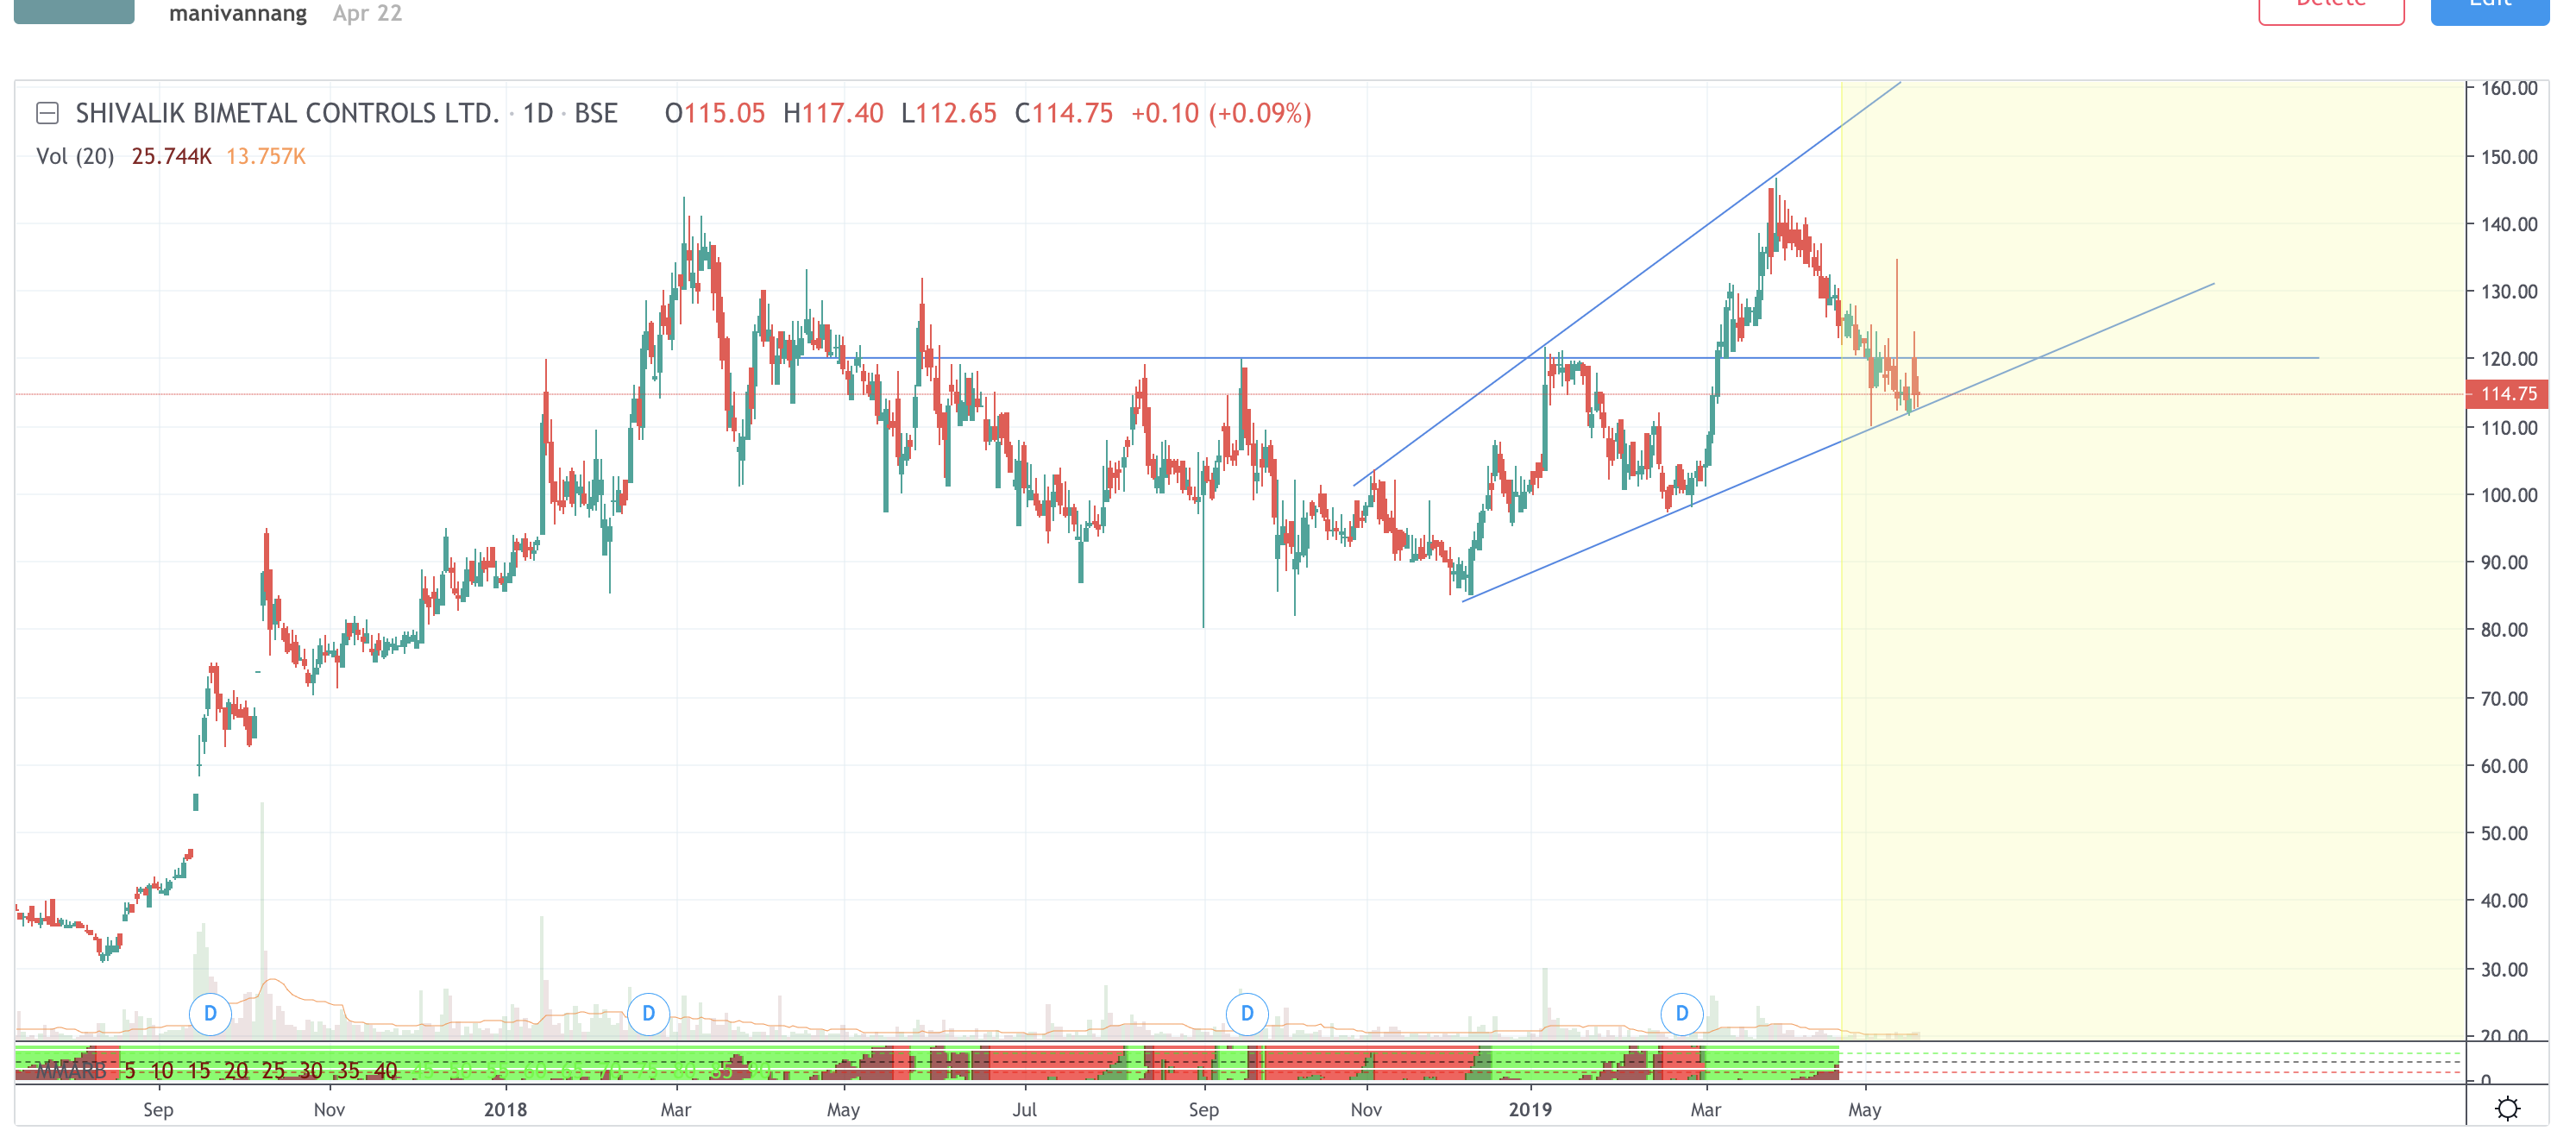
As expected Shivalik Bimetal, re-testing the trendline, worth tracking.

Disc: Next week, probably all these charts can go wrong ![]()
Great tracking of the charts. Especially, I was also betting on Dhampur in which direction would it go. Hopefully, there will be some reversal soon.
Thanks for your efforts, please continue the great work!


Some scrips which broke the short term support levels in the recent past and bounced nicely:
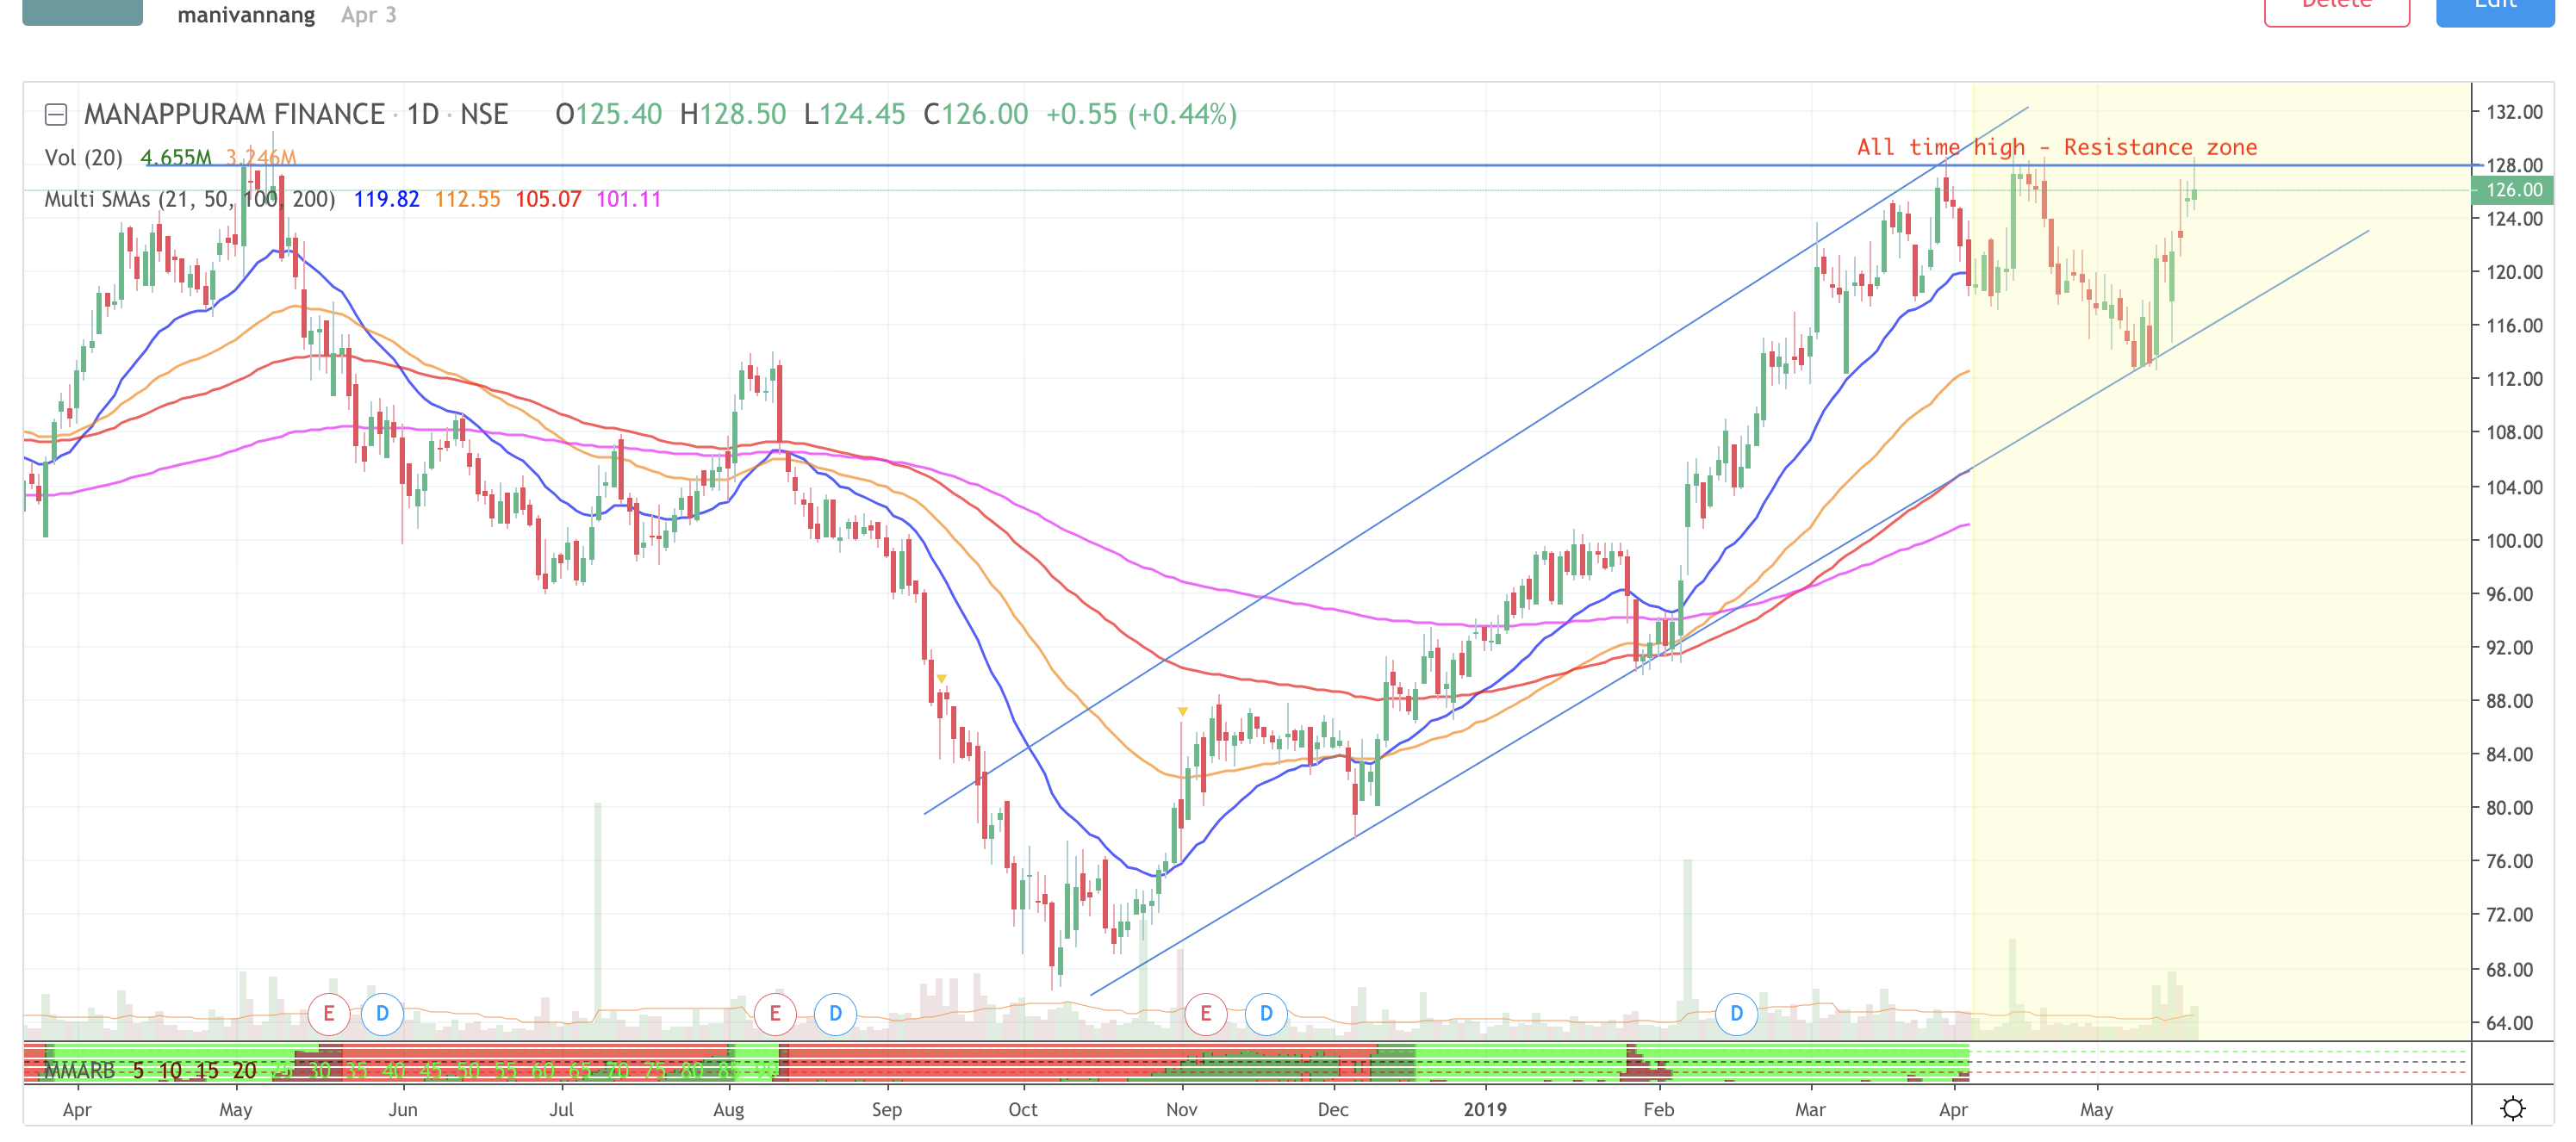
Manappuram:
Although bounced like a tennis ball, the roof is very short here. Since its facing resistance at 125-130 levels, needs to break out decisively to scale further up.

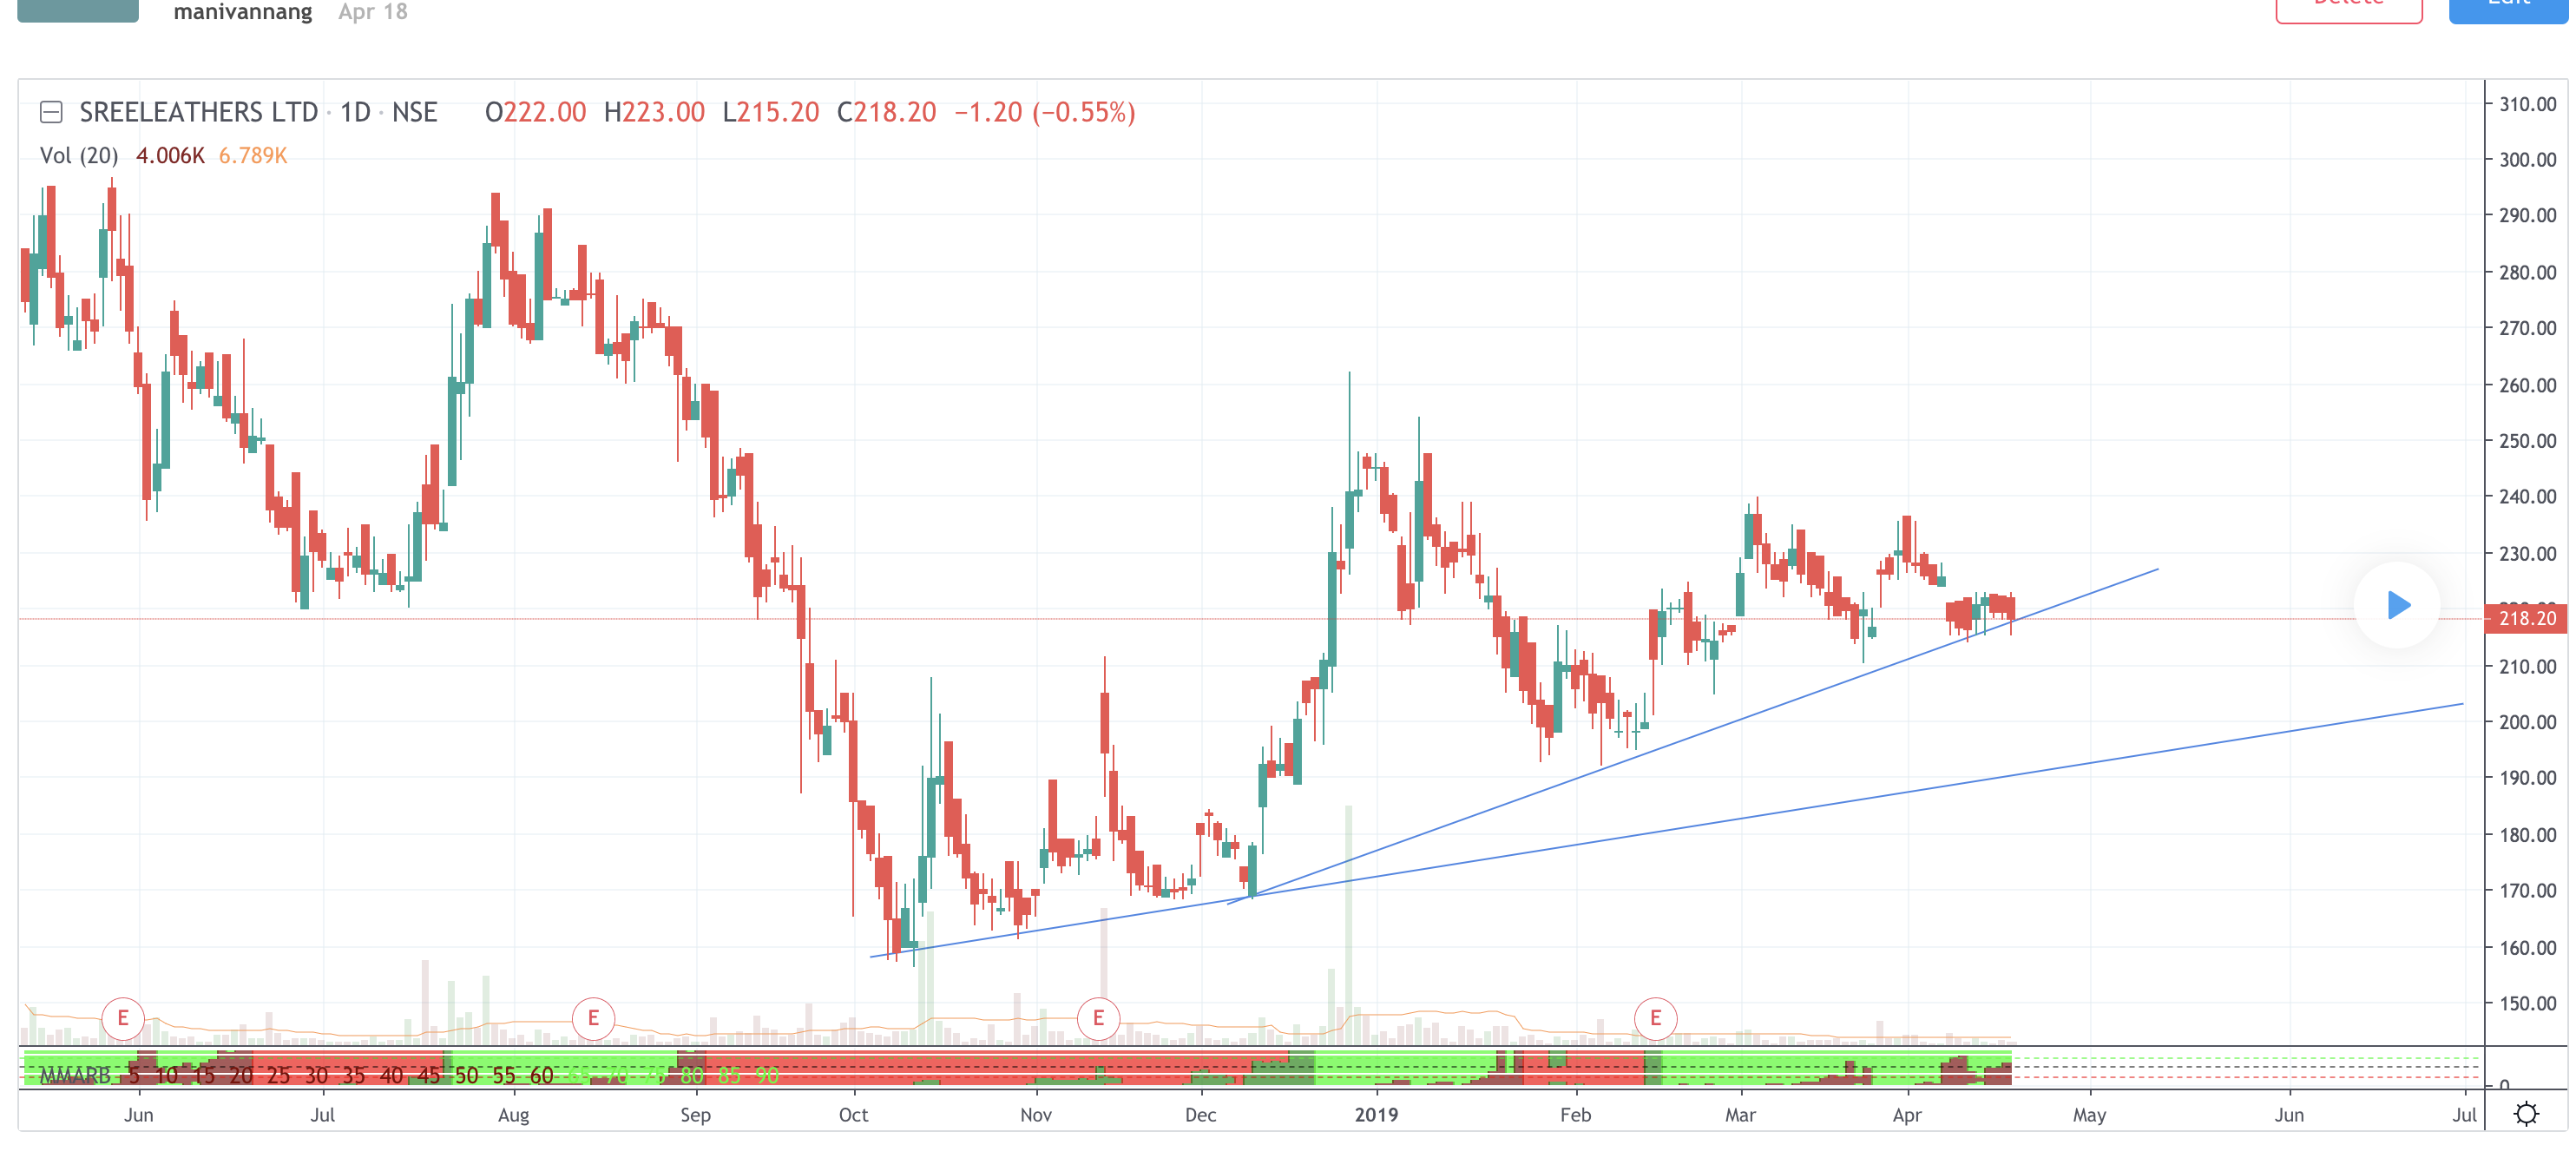
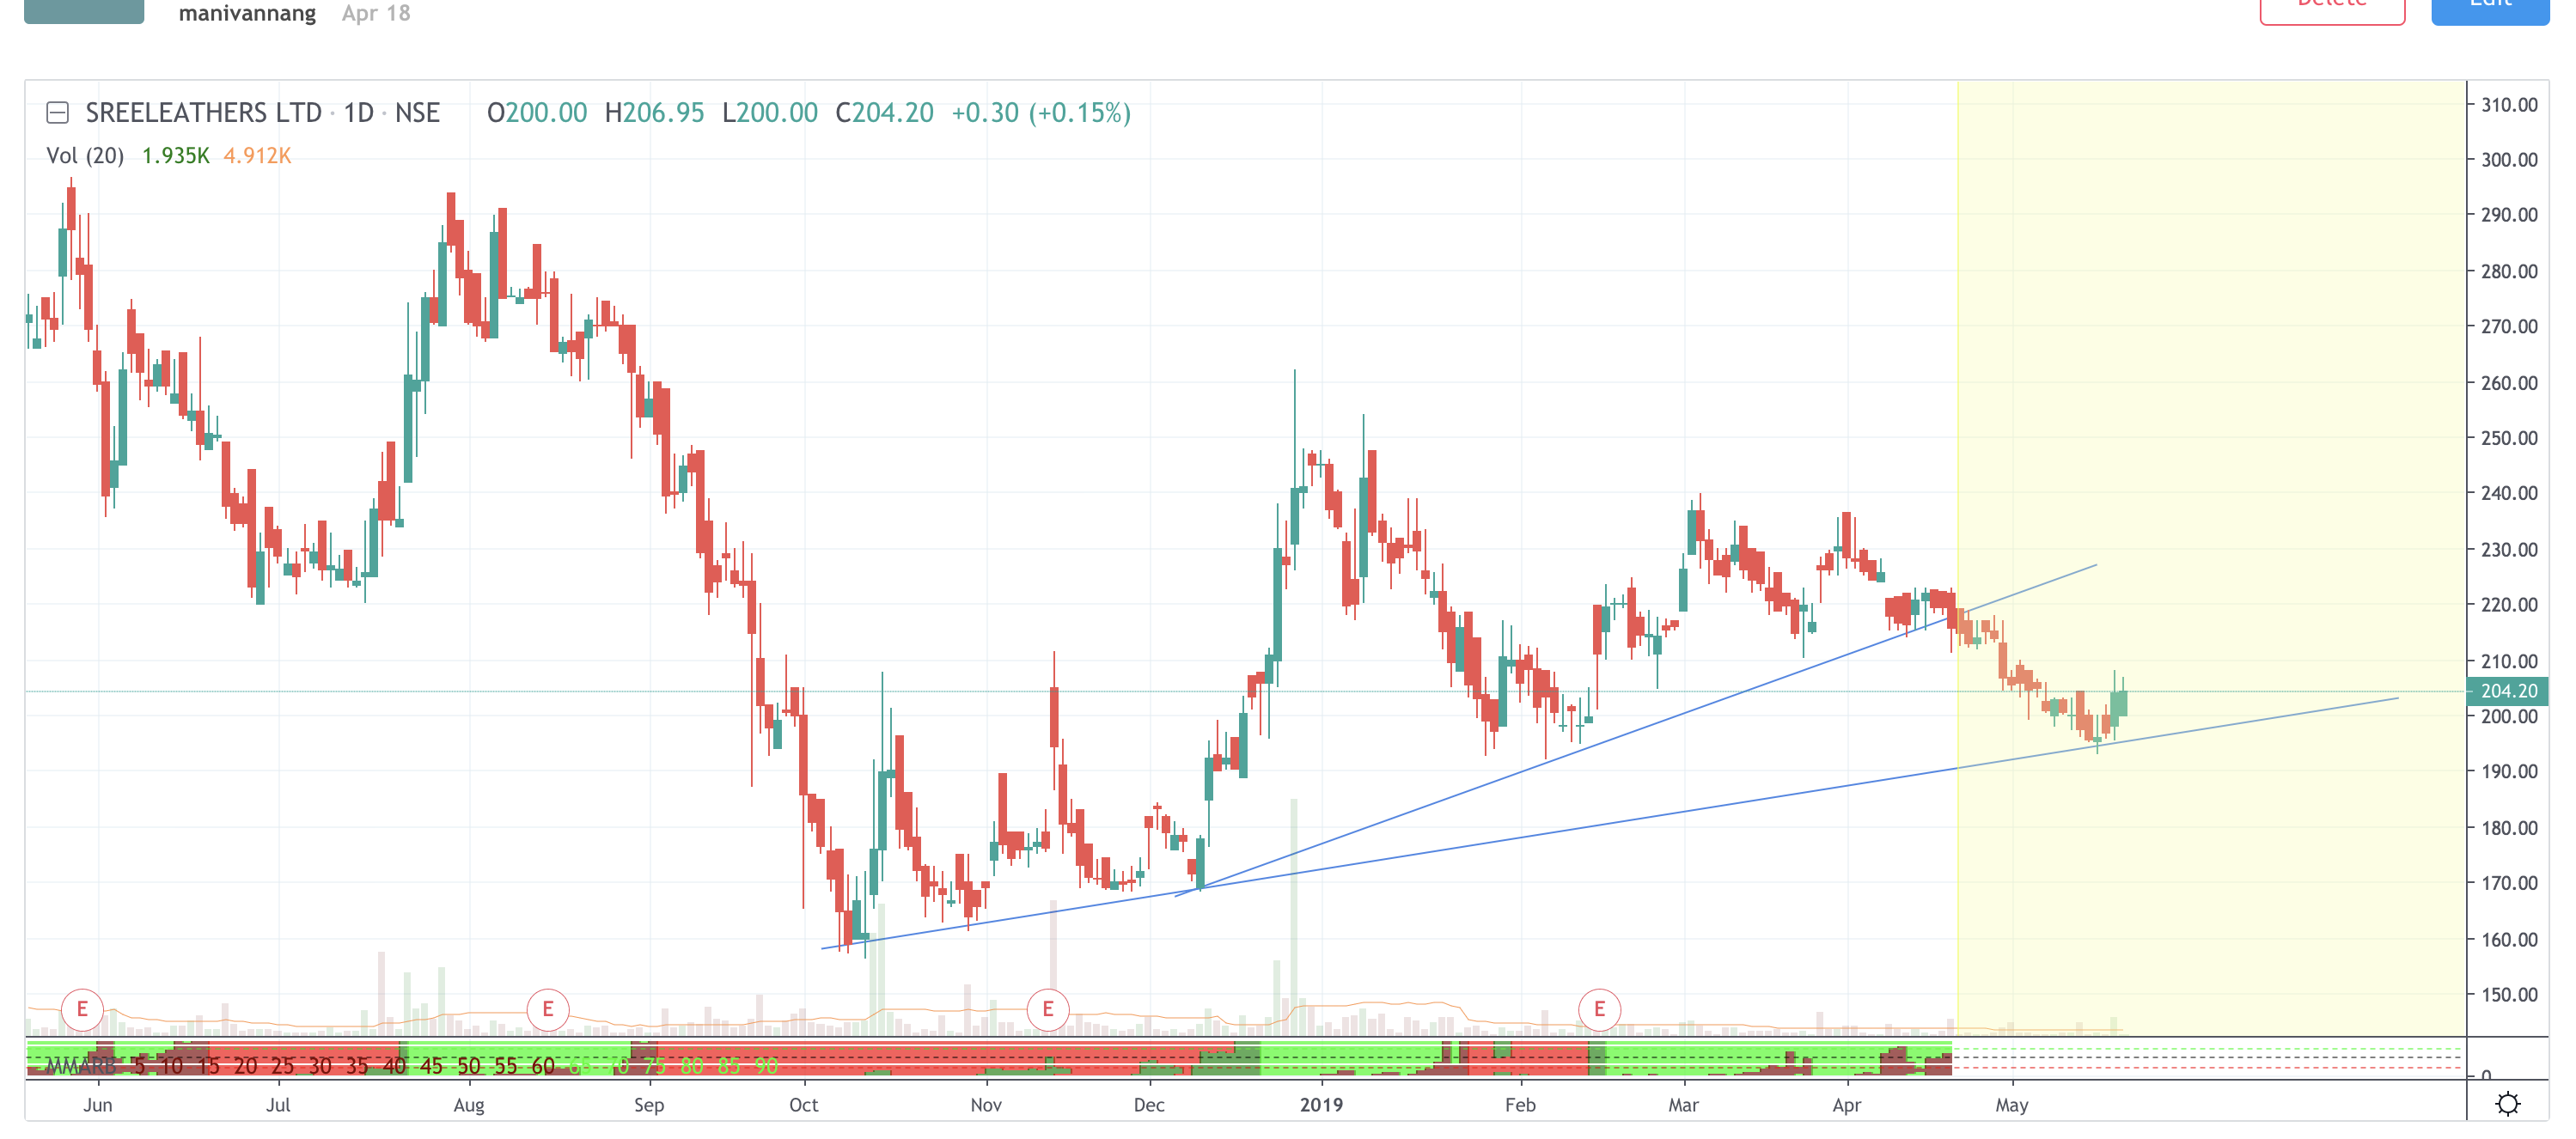
Sree Leathers:
Shivalik bimetal:
This one hasn’t bounced decisively, still juggling along the trendline so have to be careful.
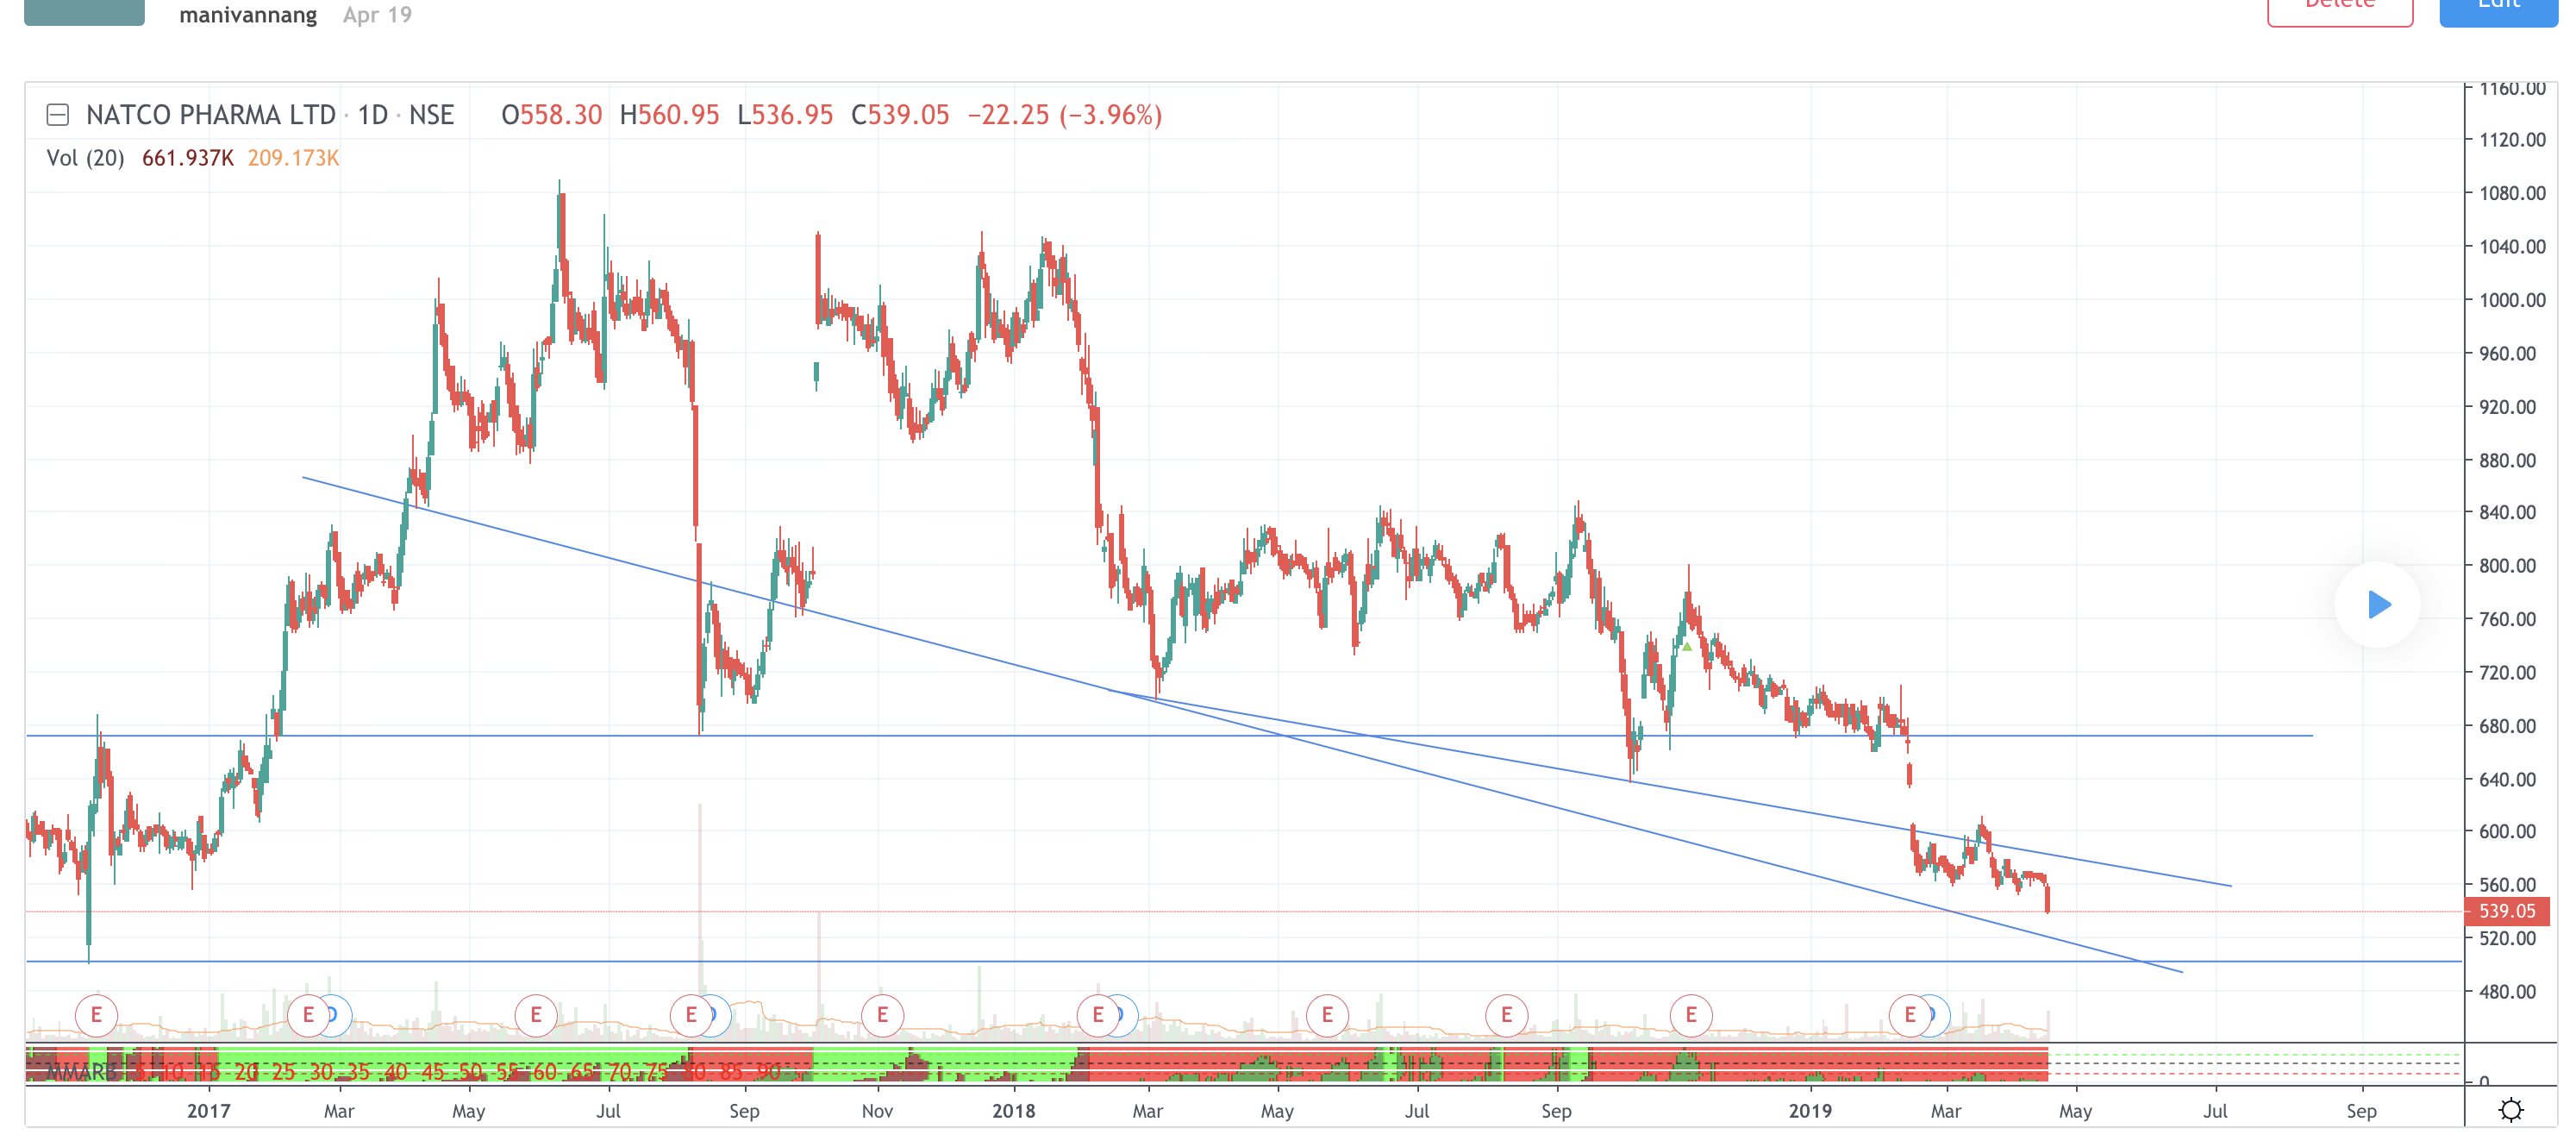
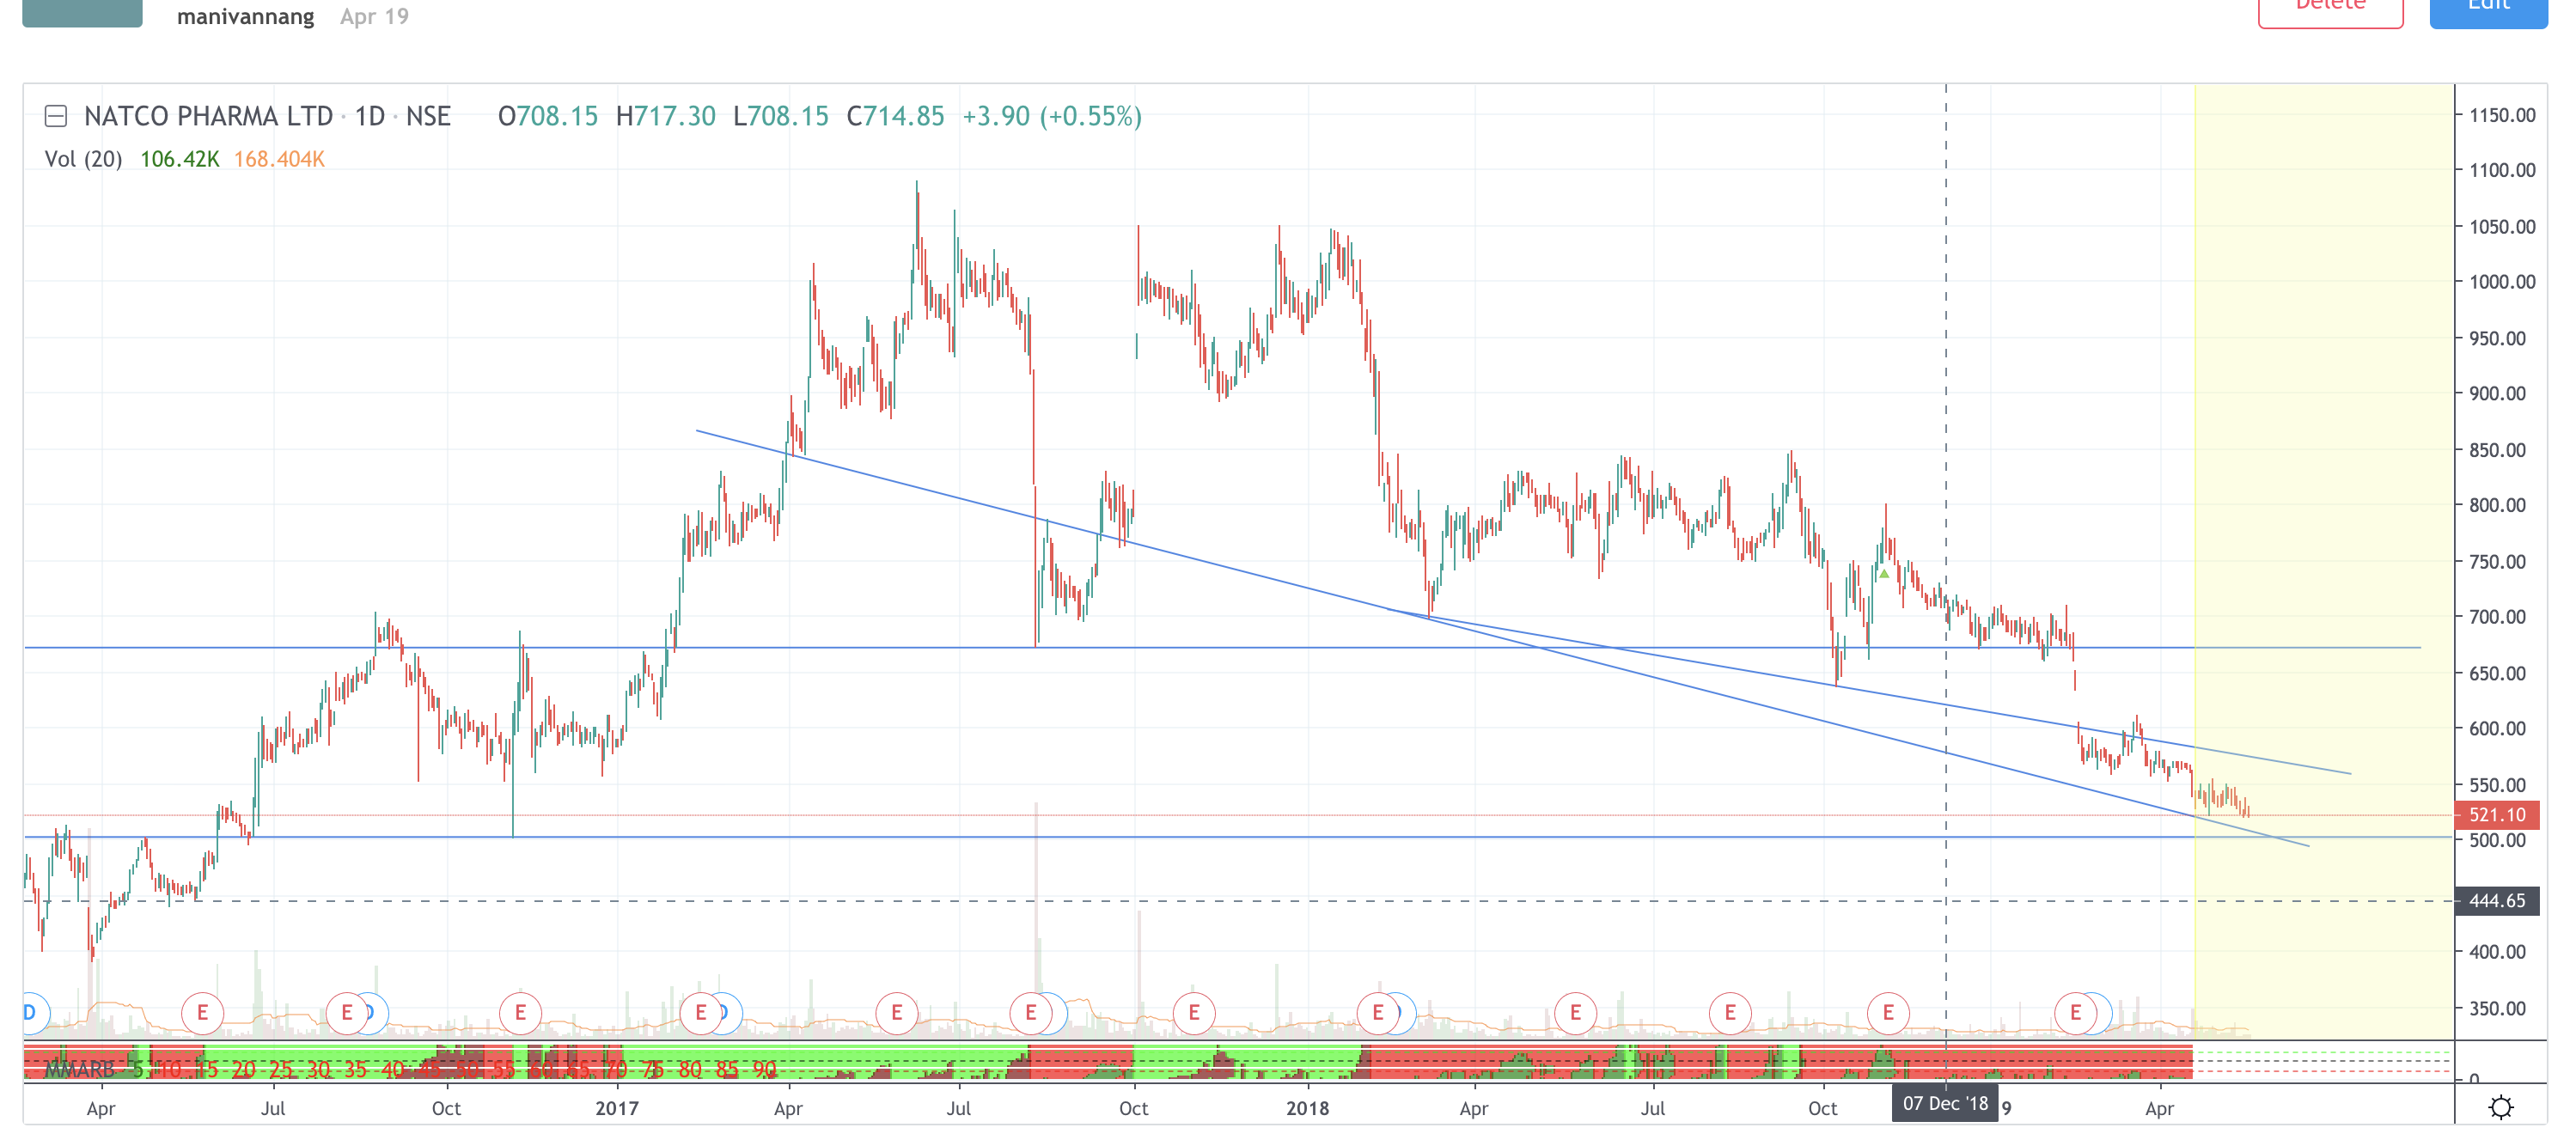
Natco Pharma:
Seems like gonna find some support around 500.
Folks, whats ur opinion on a breakout in SBI after years of consolidation. Though technically it looks good however I am not convinced on the fundamental part. Not sure whats going to take it forward with all those issues with PSUs.
Maybe NPA cycle is coming to an end in Modi’s second stint ?

Hello …
I also browsed through the charts of SBI and price is mostly ahead of the news. The stock is breaking about of multi year resistance and top. Let’s not question the price and chart pattern
Let’s rather try and go with the trend. A decent strategy can be to buy the stock on dips near support or when it breaks out of consolidation pattern. It is worth noting the rsi also confirms the bullishness since it has hardly fallen in past few years.
If I might extrapolate this also means that another biggie will now push the bank nifty along with hdfcs and kotaks. So bank nifty might outperform the nifty too and by a big margin.
Regards
Divyansh
It seems that RSI is showing negativity divergence…
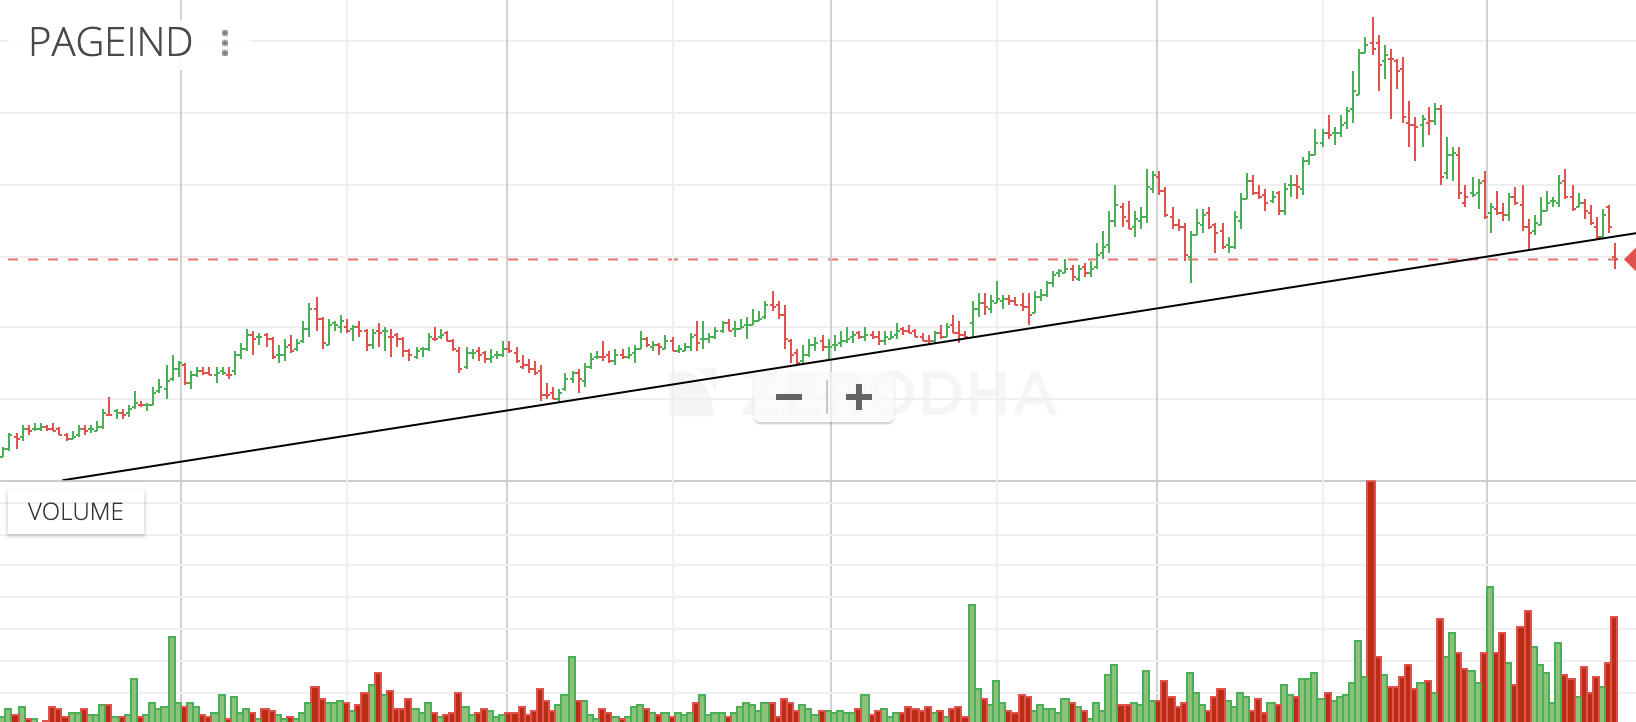
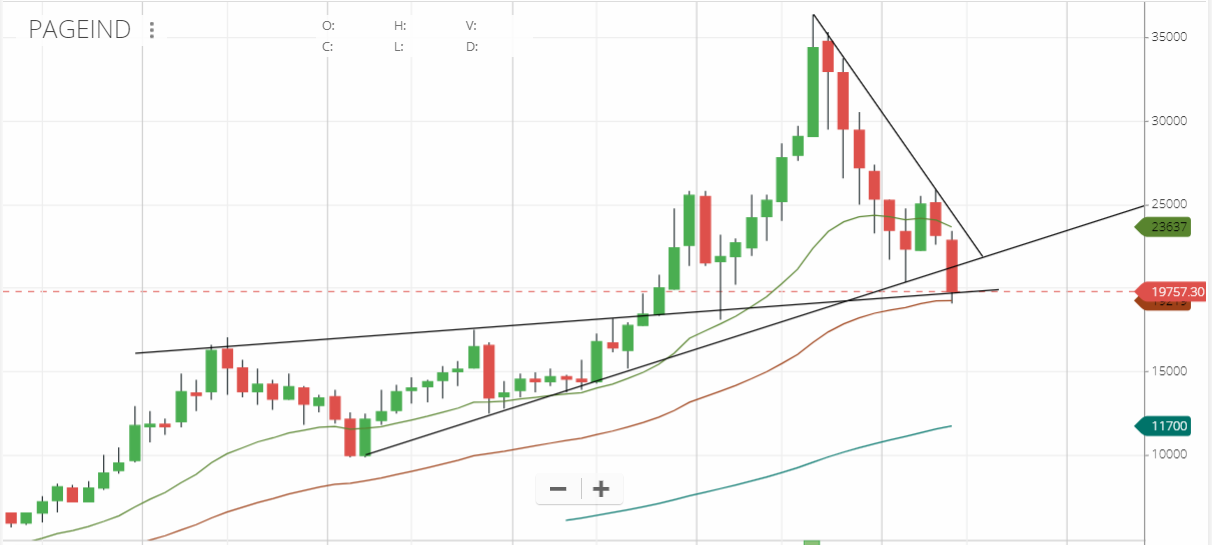
Page industries 5 year trendline break on high volumes. We can expect significantly lower levels if the break holds till the end of the week

Mirza 2 year trendline break out on low volumes.
Tracking below two charts:
Maithan Alloys:

To me this looks like a reversal pattern that also includes an inverse head and shoulders.
LTTS:

Has been going steady for quite a while and appears to be exhibiting a VCP pattern.
I am new to understanding charts and would appreciate if someone could share their views on the above two.
I was looking at Lupin’s monthly and daily charts. Looks interesting and seems like a base may have got formed.
- Positive divergence on monthly charts

- On daily charts its at support line
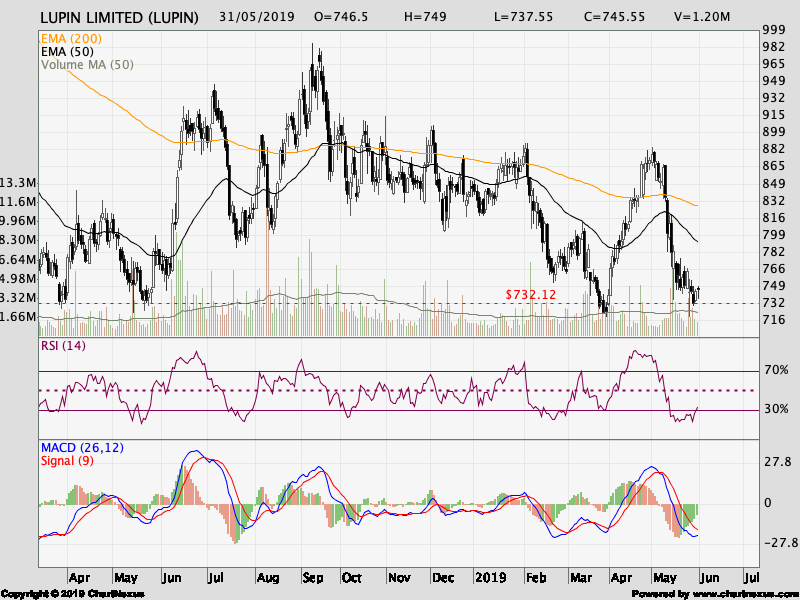
Quarterly numbers too showed some positive bias, not expecting a fast recovery however RR seems favorable.
Key risks in short to medium term could be Trump’s removal of india from preferential status ( not sure how much it would impact Pharma) , some law suit filed against few Pharma companies in US and recent plant inspecting by FDA and time taken to respond to those irregularities.
Technical Risk : To some it may seem like a head and shoulder pattern as well on long term charts. So be careful about the breakdown , if it happens.
Disc : I am invested and this is not a buy sell recommendation. Shared for learning purpose only.
Page Industries - Looks to be taking support at the 50-month MA and also the long-term support from the previous breakout trendline. Should consolidate for awhile around these levels as the P/E continues to de-rate. If the slowdown is temporary, could be a good buy between 16-20k levels
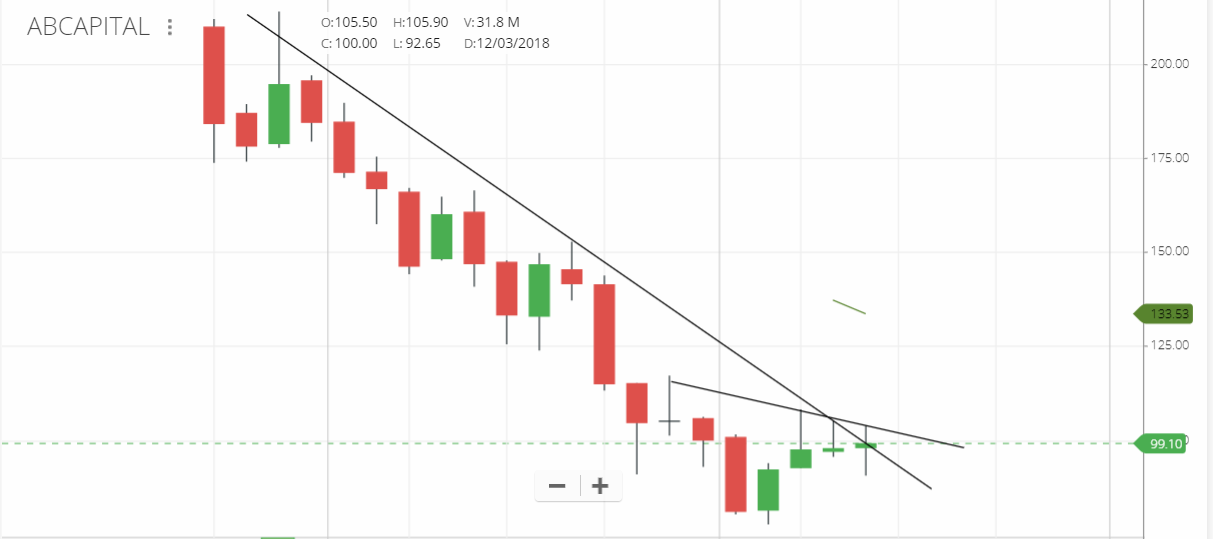
AB Capital - Fall from 250 post de-merger and consolidation between 80-100 for 6 months. Recent quarter and FY19 numbers look promising with NBFC, insurance and AMC segments all performing well amidst slowdown. Technically, at resistance so uptick in volume above 100 could signal a breakout. Valuation appears attractive too.
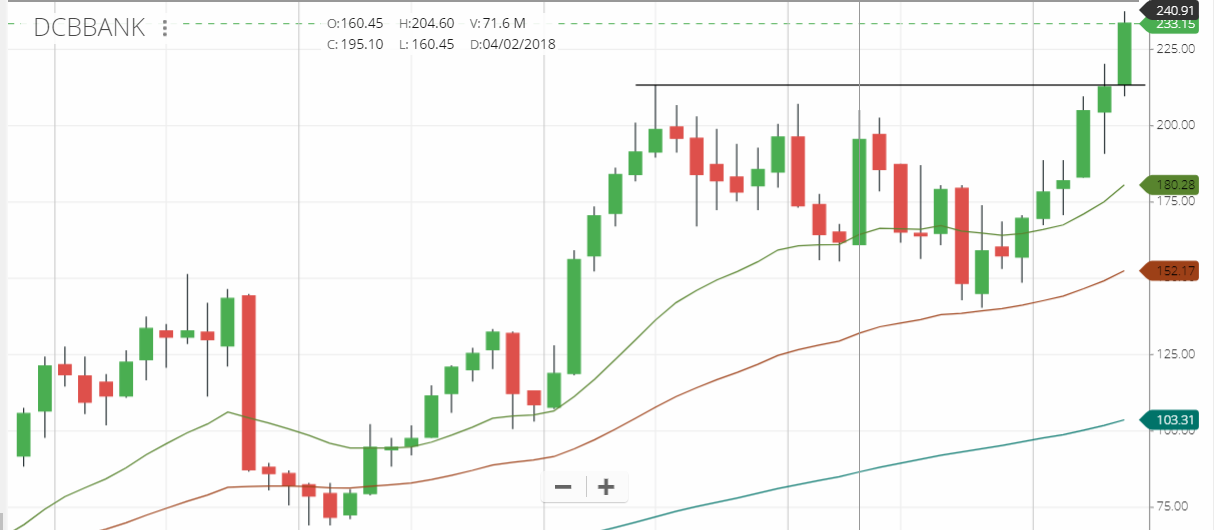
DCB Bank - Clear breakout on the monthly. One of the decent performing small banks (perhaps along with CUB)
Ujjivan - At long-term resistance but clearing 340 levels with volumes is a great sign. Breaking out of 380 levels with volumes will be a positive sign for further upmoves. Following more financials as we might be in for a goldilocks economy soon. (low inflation, rate cuts and a consequent pick-up in growth)

Syngene - It did breakout from the triangle last month since the last post. Continuation is a possibility this month

Disc: No positions in any, except Syngene.
Agree with most of your charts and viewpoints. But the caveat is that there has to be some sort of capitulation and cleansing before a decent and sustained upmove to start… Something like what happened in nov 16 or Oct 18…
Also nifty and banknifty rsi are hinting sluggishness and little strength on higher levels… The world markets are also in a corrective mode and maybe after the rbi policy in June we will follow the global trend… on the downside nifty levels looks scary to me and I am looking for levels of 10000… Though I might be completely wrong…
Disc : I am in 70 percent cash and waiting for a big correction to jump in the markets …hence views might be biased