
I have seen lot of time that VP"s are posting Bare Graphs without fundamentals which is not fare which is not justifying the sprit of the forum separating wheat from Chaff .with due respect and regards to the everyone if some value is added which help any investor to have guard against the LOSS of CAPITAL rather than simply Putting up random charts and imposing your vies can be Fatal for someone’s financial decisions . By judging individuals long history of participation . If I offend some one please pardon me for that . But a humble request to put at least few fundamentals along with the charts will defiantly going help the investors and novices like me
Regards
4 Likes
Guys, can anyone good at DOJI’s explain what three in a row mean for Nifty in past three days. Does this indicate state of confusion or sort of trend getting tired.
RSI is already showing divergence.
Thanks in advance.
1 Like
Here are my thoughts:
This can be thought of as a tussle between bulls and bears, which usually happens near the “all time high” of the index/stock, and maintenance of the upward trend over the last three days. Let’s break up the three Doji’s. (Please see my next post where I have drawn out the wave counts that I am referring to below)
The first Doji signifies bullishness. When the market opened, it was a gap up from the previous day maintaining the bullishness over the last few days. Profit booking resulted in NIFTY going down, but bulls took over and got back the NIFTY to more or less where it began. The day ended with bullishness. (My opinion is that this was a Wave 4 correction in the beginning and wave 4 corrections are usually benign (wave 3 began from 11413 according to my wave count) and the upward Wave 5-subwave 1 towards the end)
The second DOJI had a gap up opening (bullishness continued). The upward momentum resulted in NIFTY going up through the day (SubWave 1 completing). Profit booking resulted in NIFTY coming down by the end of the day (SubWave 2-subwave A downwards), yet the close was higher than the previous day’s close. This can also be thought of as the gap filling up partially. Wave 2 corrections retrace Wave 1 to much an extent.
The third DOJI had a much higher open (subwave 2-subwave B) as compared to the previous day’s close maintaining the bullishness. Profit booking and gap filling brought NIFTY down (subwave 2-subwave C) but the bulls persisted and took NIFTY up. (subwave 3-subwave 1 upwards)
This tussle between bulls and bears is seen because NIFTY is close to its all-time high of ~11760
Putting all of this together, I think the following will occur: The upward bias might continue till the all-time high is taken out. There might be a subsequent correction taking NIFTY somewhere between 11300-11550 (depending on which wave corrects; the correction might be less severe depending on the degree of bullishness). (The wave patterns on a smaller timescale over the next few days can help get to a better prediction, maybe the correction will not be severe after all)
3 Likes
@Shrihari Thanks for your detailed response. Could you please help to post your chart showing these EW patterns for our better understanding.
1 Like
Here are my charts. This is the NIFTY daily chart.
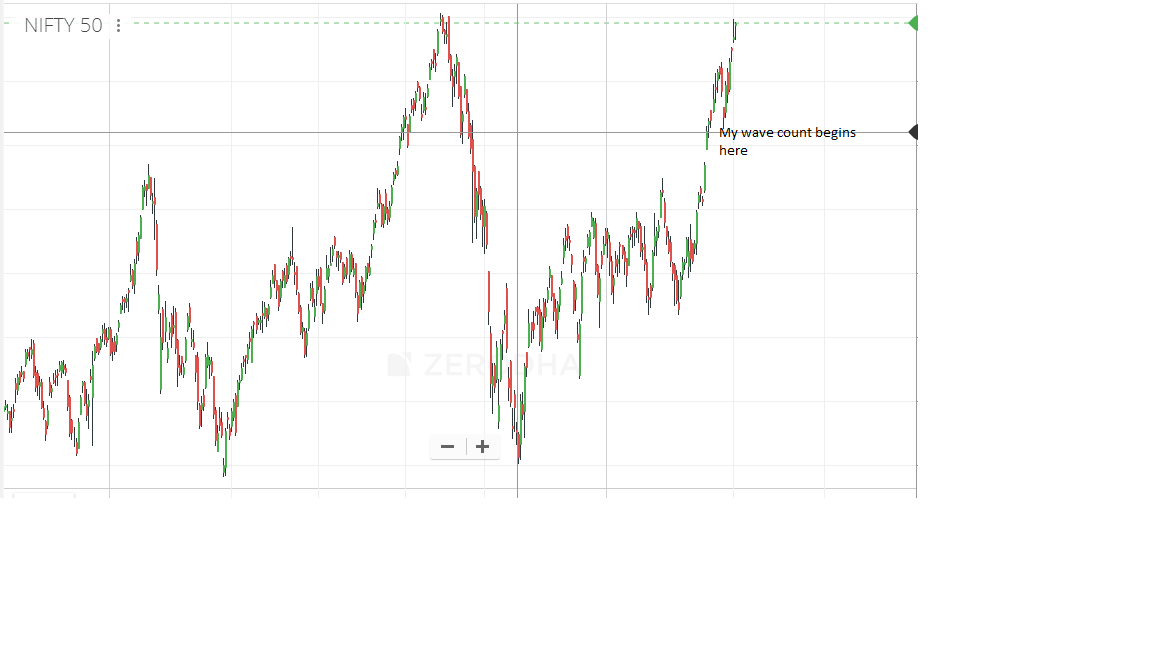
My wave count begins on 26th March. On the daily chart, wave 4 ended on 25th March. This seems reasonable as wave 4 correction was benign and wave 3 was an extended NIFTY rally.
To illustrate my wave count, and to explain the DOJI’s, I have gone down to a 15 minute candlestick chart pattern, and begun my wave count from March 26th, as seen below.
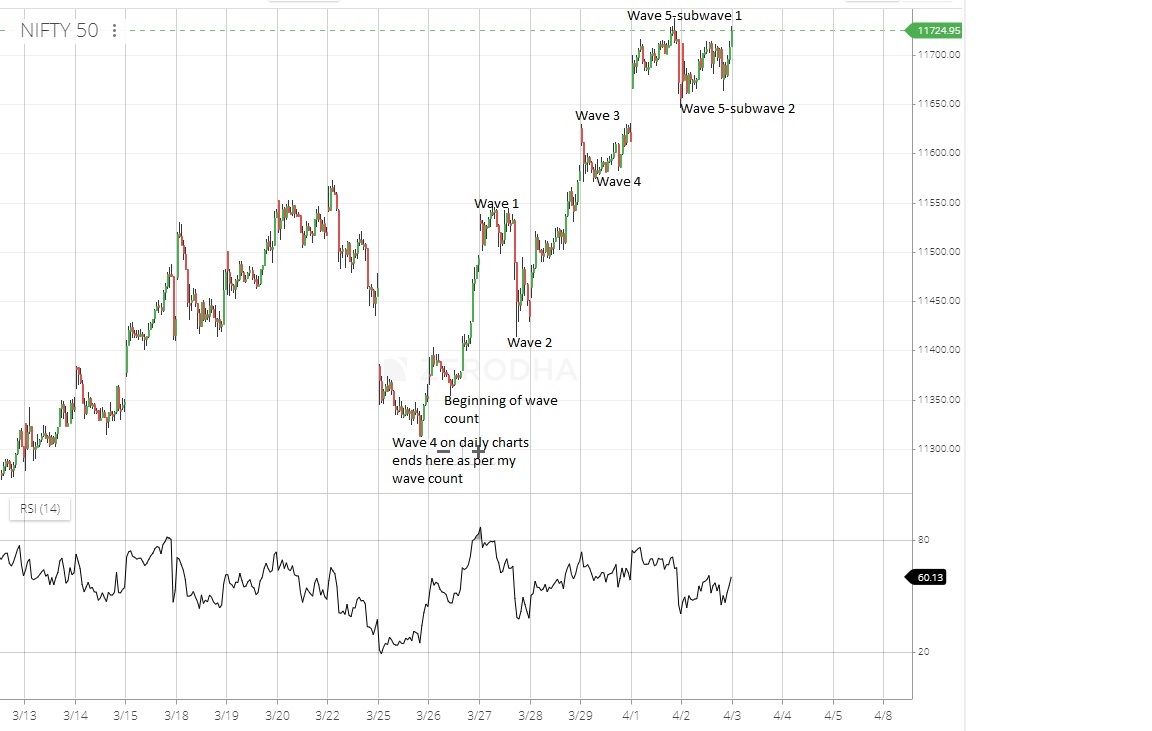
According to the daily wave count, Wave 5 began on March 25th. Sub Wave 5 extension within the daily wave 5 is what I am looking at and that is where my wave count begins. Within this wave, wave 2 is a 61.8% retracement and wave 4 is a 23.6% retracement.
All of wave 5 might correct or a smaller portion of this wave might correct. Tracking BANKNIFTY, Reliance and the IT pack simultaneously will help narrow down more details of the next correction. as these form the bulk of NIFTY. Please let me know if you need more details.
3 Likes
Hello Sir,
Three Doji in a row means a TRI STAR.
It’s a pattern which signals a possible reversal in current trend.
Although the pattern isn’t an ideal TRI - STAR but that is the best possible pattern we can identify as of now.
We’ll have to wait for the next Candlestick to know where will the market head, right now market is confused
2 Likes
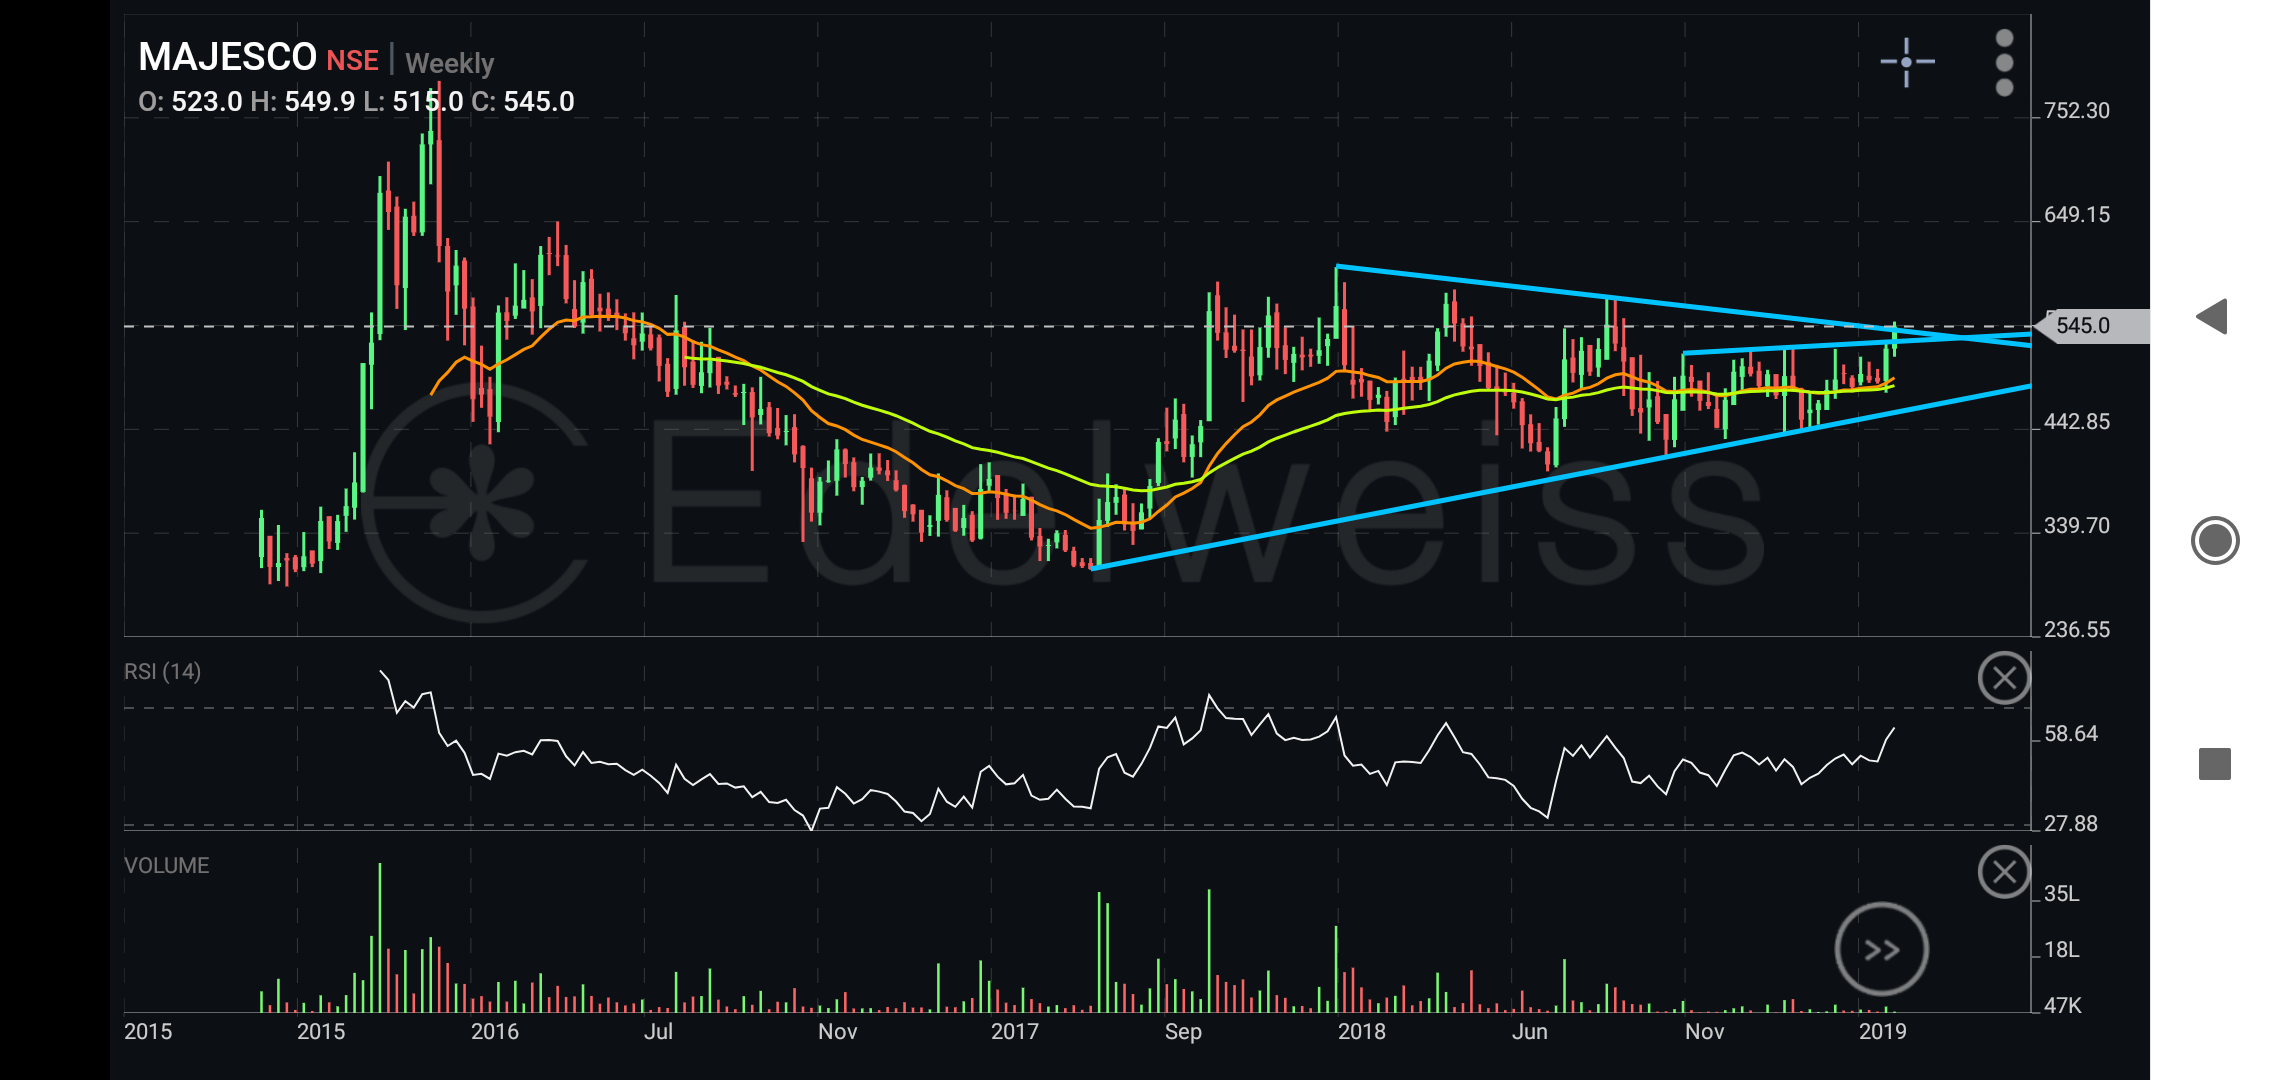
Low volume stocks such as fairchem will make shadows all over the place (see hourly for example). Since your weekly chart is peaked at channel top, try and view monthly for more clarity. Seeing MACD about to cross, a buy on confirmation above 496 may lead to 600+ targets. Personally i would have bought at bottom on stochrsi cross in Feb at 367-370 and looked for an exit at 496 or above on breakout. Just an analysis.
The idea would be VP’s have done their fundamental homework and only then put up a technical chart for entry. Besides all views are personal which may or may not have led them to buy. Sometimes they just share charts to show patterns to novices or others who may have missed seeing that stock. There is no harm in it. It will only be Fatal for the person who blindly buys such mentioned stocks without them doing further research as one shud always do
Doji means mistake in Japanese hence closing prices close to opens and the such. 3 doji’s in a row will have different meanings depending on shape and position such as evening star, gravestone, shooting star,etc Suggest you study Candlestick Charting for Dummies by Russel Rhoads. Great book to learn basics
1 Like
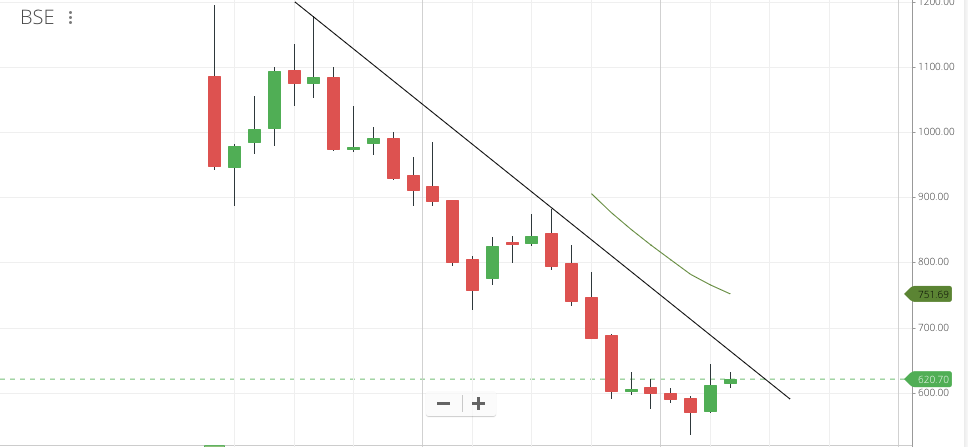
BSE - Valuations are juicy any which way you look at it. At this point, it appears to be forming a bottom around 600 levels with a 6 month consolidation. Last month’s close is the highest monthly close as well. Key will be a breakout past that downward trendline which can possibly happen in May. Looks to be a low-risk (downside probably capped).
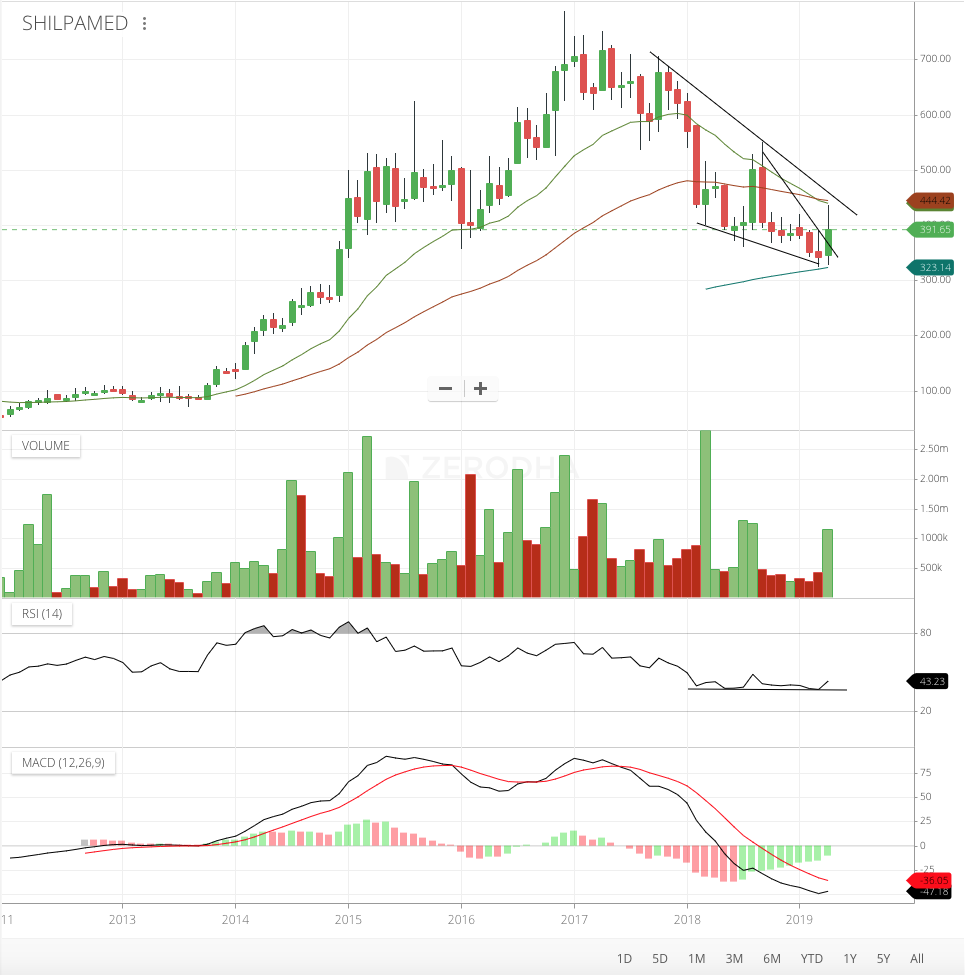
Shilpa Medicare - Appears to bouncing off 100 month moving average, as well as downward trendline support. Also closed past near-term downward trendline but 400 is bound to be stiff resistance. Showing hidden bullish divergence on the RSI and MACD looks primed for a crossover. Being a zero in pharma sector, can’t comment on fundamentals. Return ratios are falling for last 5 years and consequently P/E has derated from 50 levels to 30 levels.
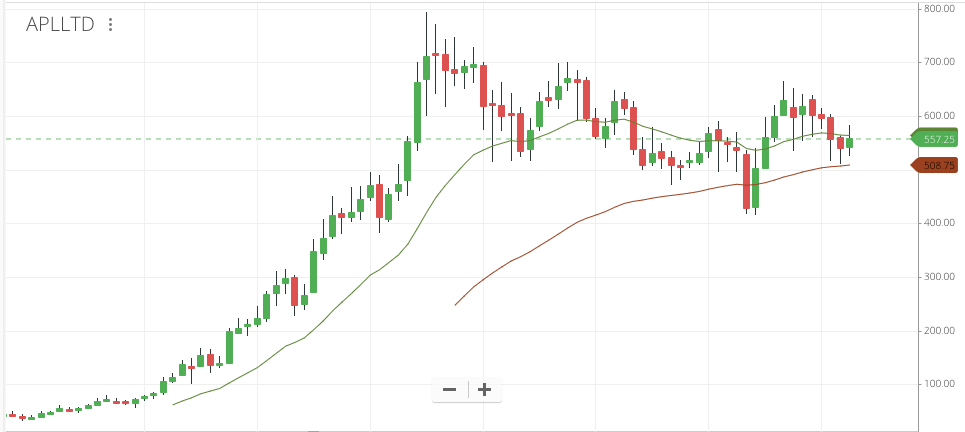
Alembic Pharma - Another pharma stock that appears to be consolidating sideways since 2015. 50 month moving average appears to be a good support, so downside might be limited. Current P/E appears to be lower than historical average which is a bit strange as unlike other pharma companies, Alembic appears to have done reasonably well in terms of bottomline growth in the last two quarters. Maybe the numbers are due to some temporary tailwinds and not sustainable? Not sure, as my pharma knowledge is zero.
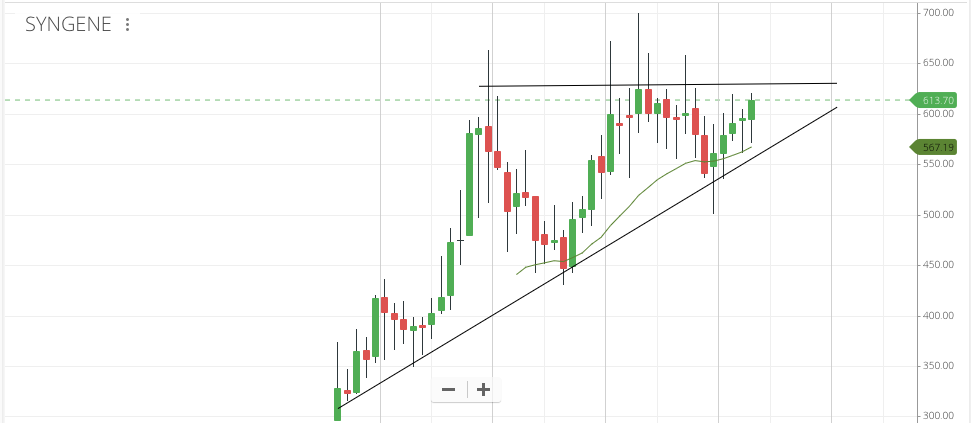
Syngene - Appears to be consolidating within the triangle. At some point of time in this year or next, could be completing a 3 year consolidation leading to a breakout. Fundamentally appears good, going by recent investor presentation and numbers. Looks to have a fair bit of capex that is yet to contribute and management sounds bullish.
Disc: Trading positions in all except Syngene, which remains in watchlist. More pharma positions to push myself to learn a bit about the sector.
6 Likes
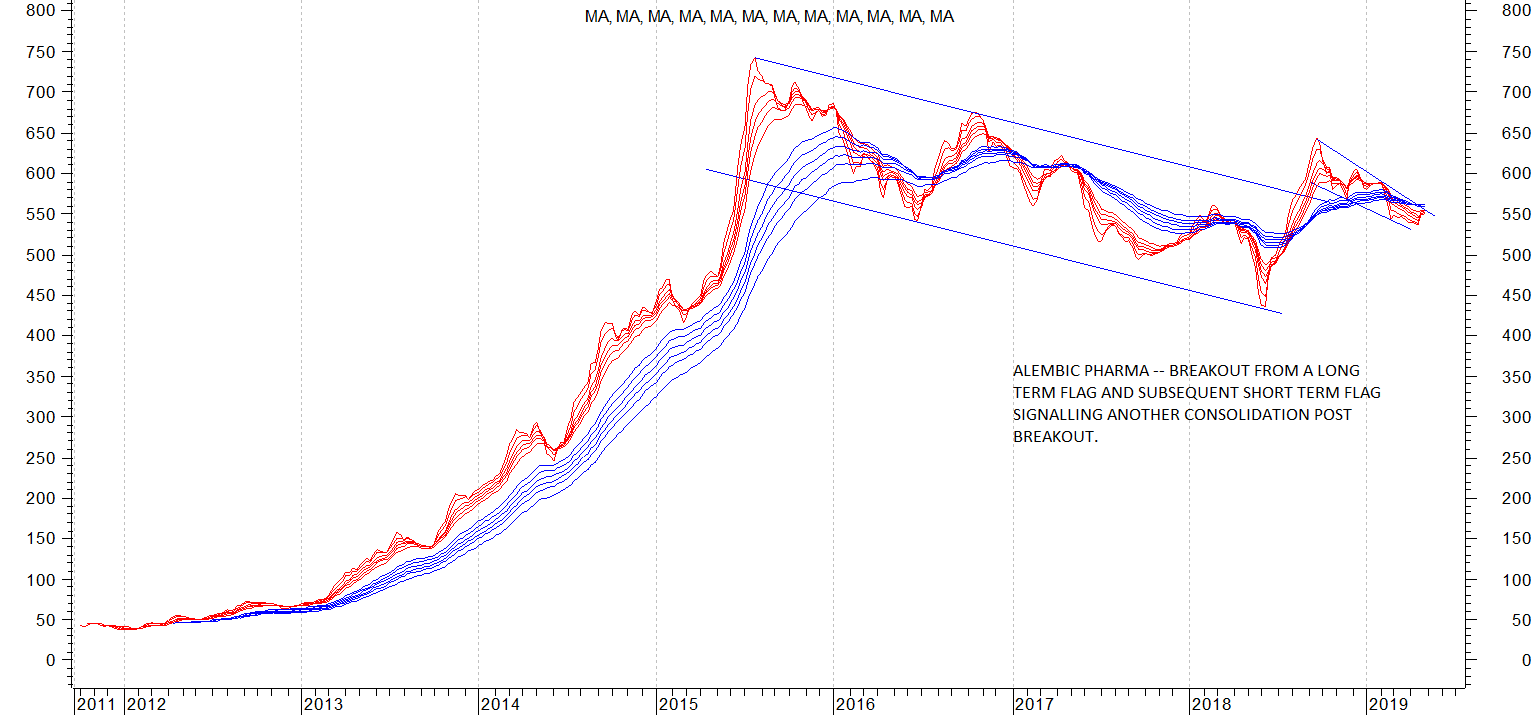
Alembic pharma weekly chart is very interesting. There was a breakout from long term flag in august 2018 but there was no follow through spike expected post these kinds of breakout. Instead the stock price started consolidating in a narrow range shown by the smaller flag. This kind of consolidation can test investor’s patience. And in the meantime newsflow would dictate short term spiky moves. e.g some kind of approval would take it up by 5-10% while some kind of usfda negative can take it down by a similar margin.
attached chart.
5 Likes
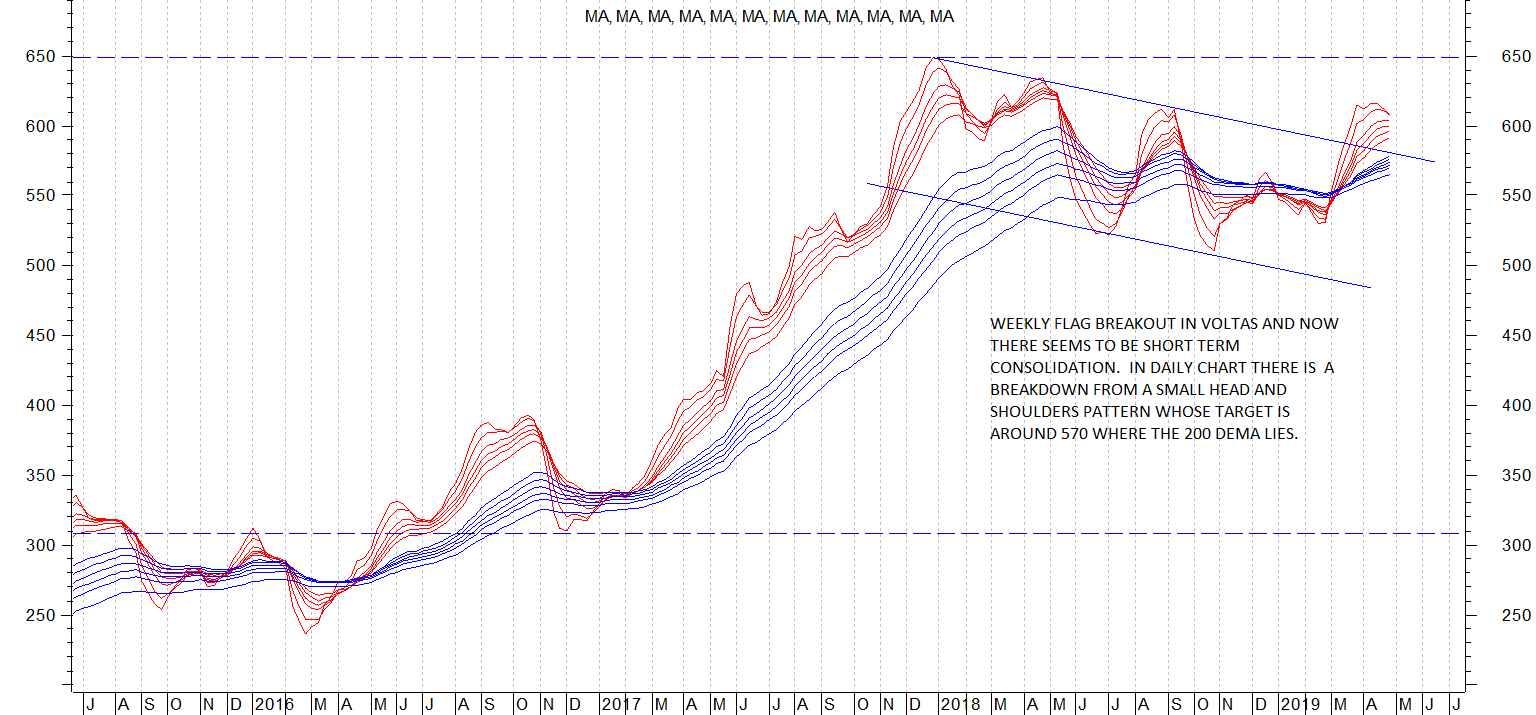
Voltas weekly chart attached. Its a picture in contrast. Weekly chart shows a flag breakout with targets in range of 900. But there is a small head and shoulders pattern visible in daily bar chart whose target is 570 region. And in this range is the 200 dema and which is rising. For me, I would like to see how the stock price behaves if and when it corrects to 570 range. First we need to see if it corrects in accordance with the head and shoulders and next we need to see whether it receives support from 570 range.
4 Likes
shud be common for Voltas to correct to 570 as you say which would also be upper line of channel from which it broke out; that may also result in fulfilling H&S target. Would be interesting to see what happens there. Have been keenly watching ur charts with multi moving avgs. Could you provide me the periods for all the moving avgs in ur charts please as nothing mentioned on chart. Noticing a lot of whipsaws which can create tension with an open trade leading to unnecessary early exit when it may not be required at all. I will try to apply changes to them and see.
I use moving avgs of 3,5,8, 10,12,15 in short term bunch and
30,35, 40, 45,50,60 in long term bunch. All exponential moving avgs.
You can google GMMA or guppy multiple moving averages and it will be available.
As you say it smoothens out whipsaws and often gives very clear cut pattern pictures.
4 Likes
there seems to be a nice cup and handle on Sundram Fasteners on weekly and forming on monthly too with 700 target; but seeing monthly indicators; may be a good buy for 800-900 target for coming year considering auto sector will be down for some time but will revive soon hence auto ancill maybe good bet. Many thanks @hitesh2710 for such a prompt reply 

OIl marketing co’s can also be in flavour. HPCL monthly looks beautiful after having cleared Oct thru Feb highs in March and April lows holding those previous highs. MACD on cross bodes well and stock may well go to previous highs on the backdrop of falling crude prices in coming year. Very promising chart

another chart which may pay off well in coming year is BoB. On the back of merger with other banks, access to more branches,etc may prove to augur well. Has been in rectangle trading range for long and going by indicators, one may take a position for top of rectangle target of 200.

H & S on NIFTY Daily with a confirmed break of the neckline.
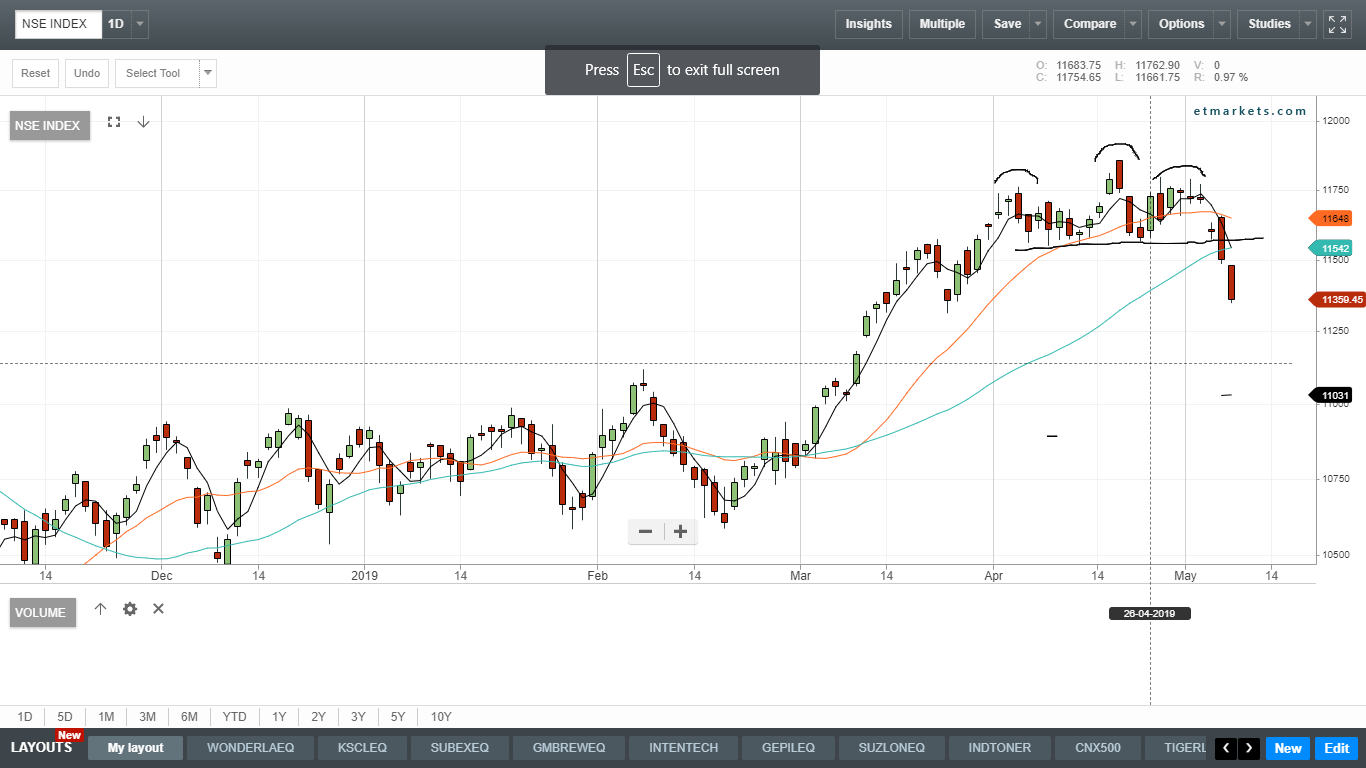
The last time 14 day RSI breached the oversold level (30) was Sept-Oct 2018 during the massive correction. Even now it hasn’t gotten to an oversold position, but its pretty close to it. After a big rally 1200 point rally from the lows, i think we should get ready for a correction. I will be paying attention to the 14 day RSI to see if it breaches the 30 level. If it doesnt - we are all good to go
@ckn sir, if you get a chance, do comment on the chart and prevailing market conditions. Eager to listen to your views as usual.
Thanks
Bheeshma
3 Likes
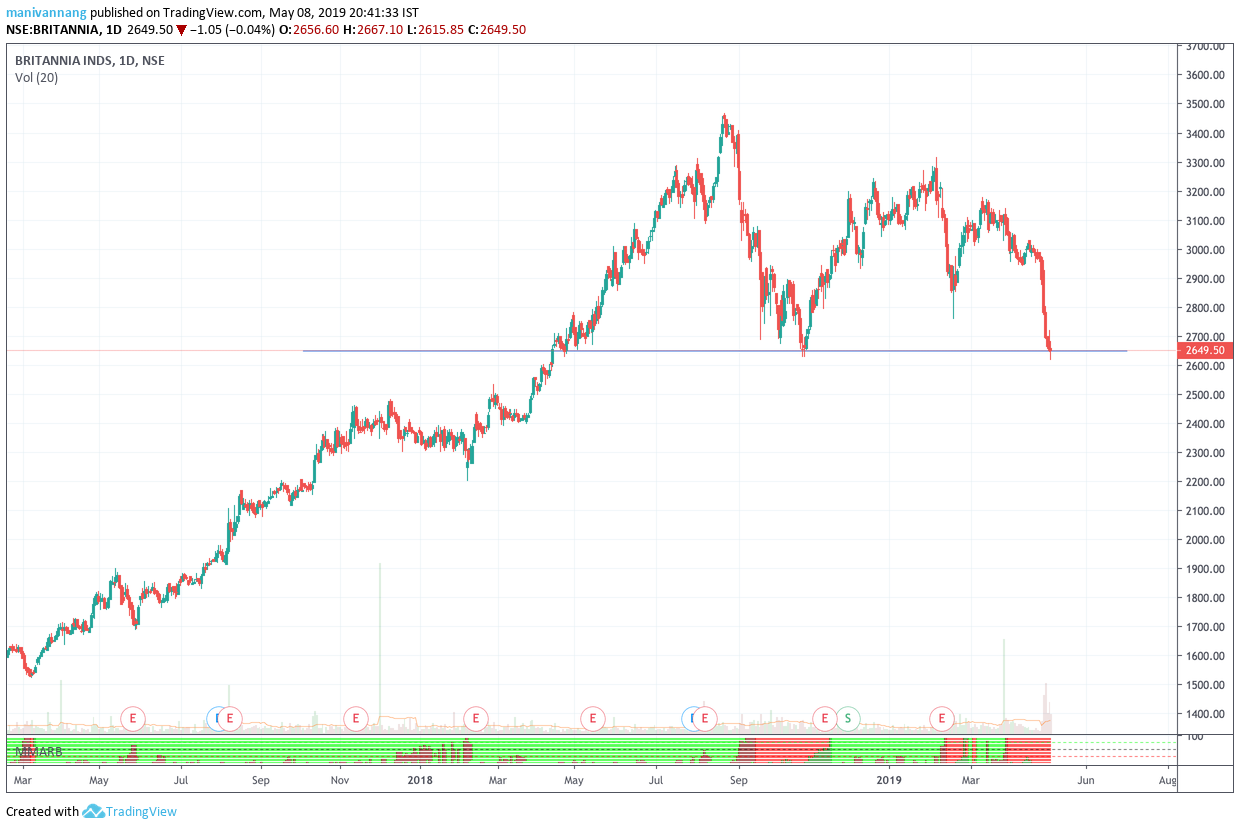
Britannia preciously standing at the support level:
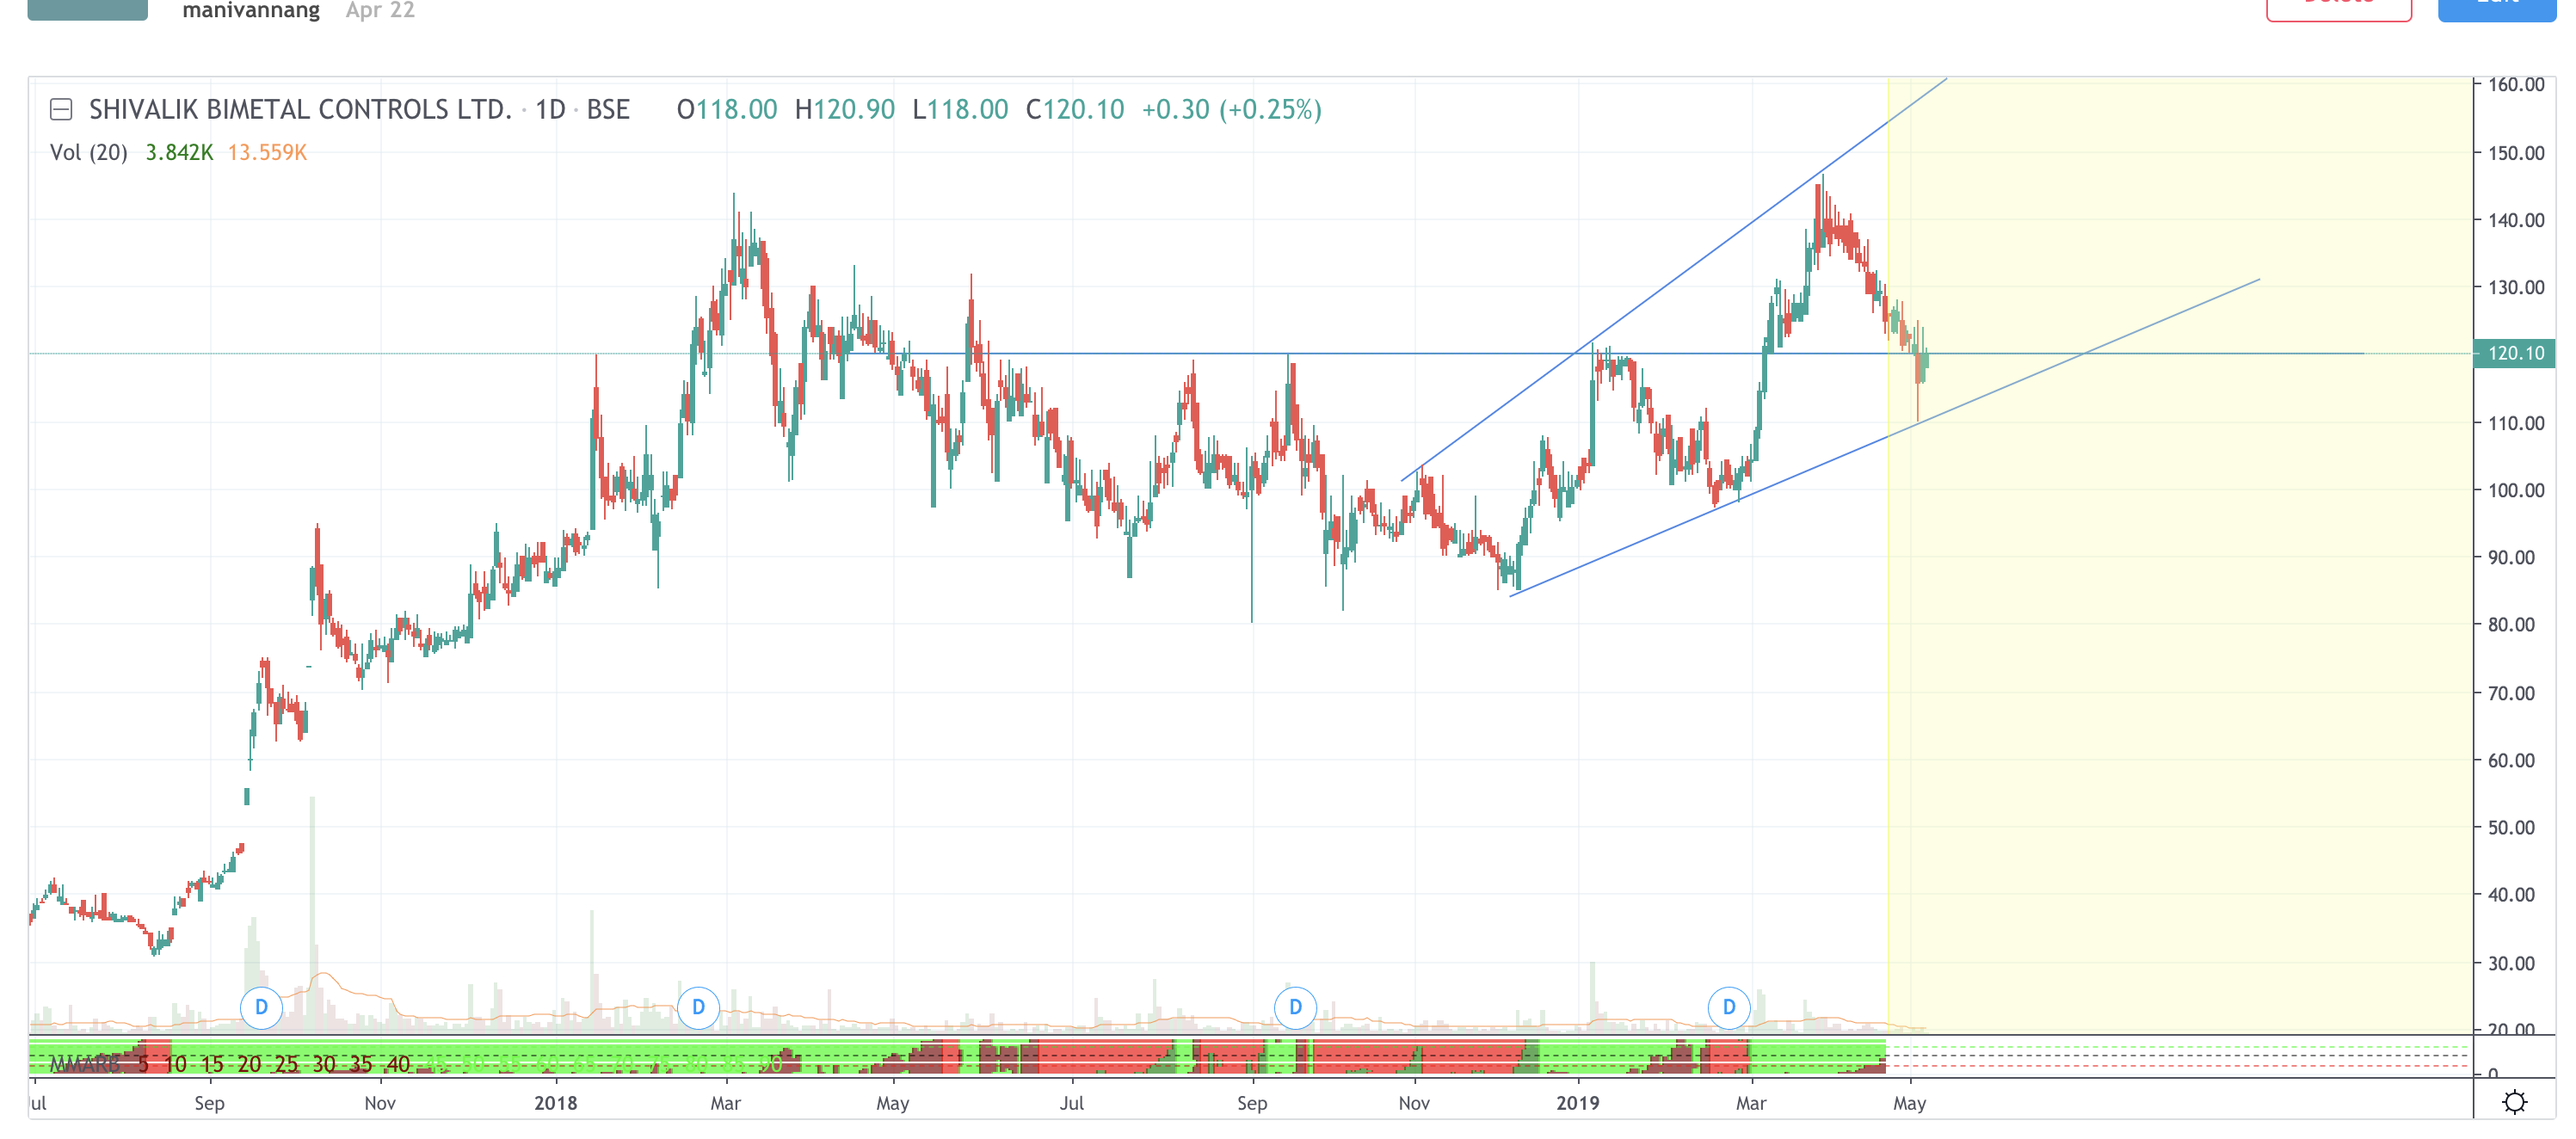
Shivalik Bimetal touched the lower level of the channel and bounced back, but doesn’t look convincing yet.
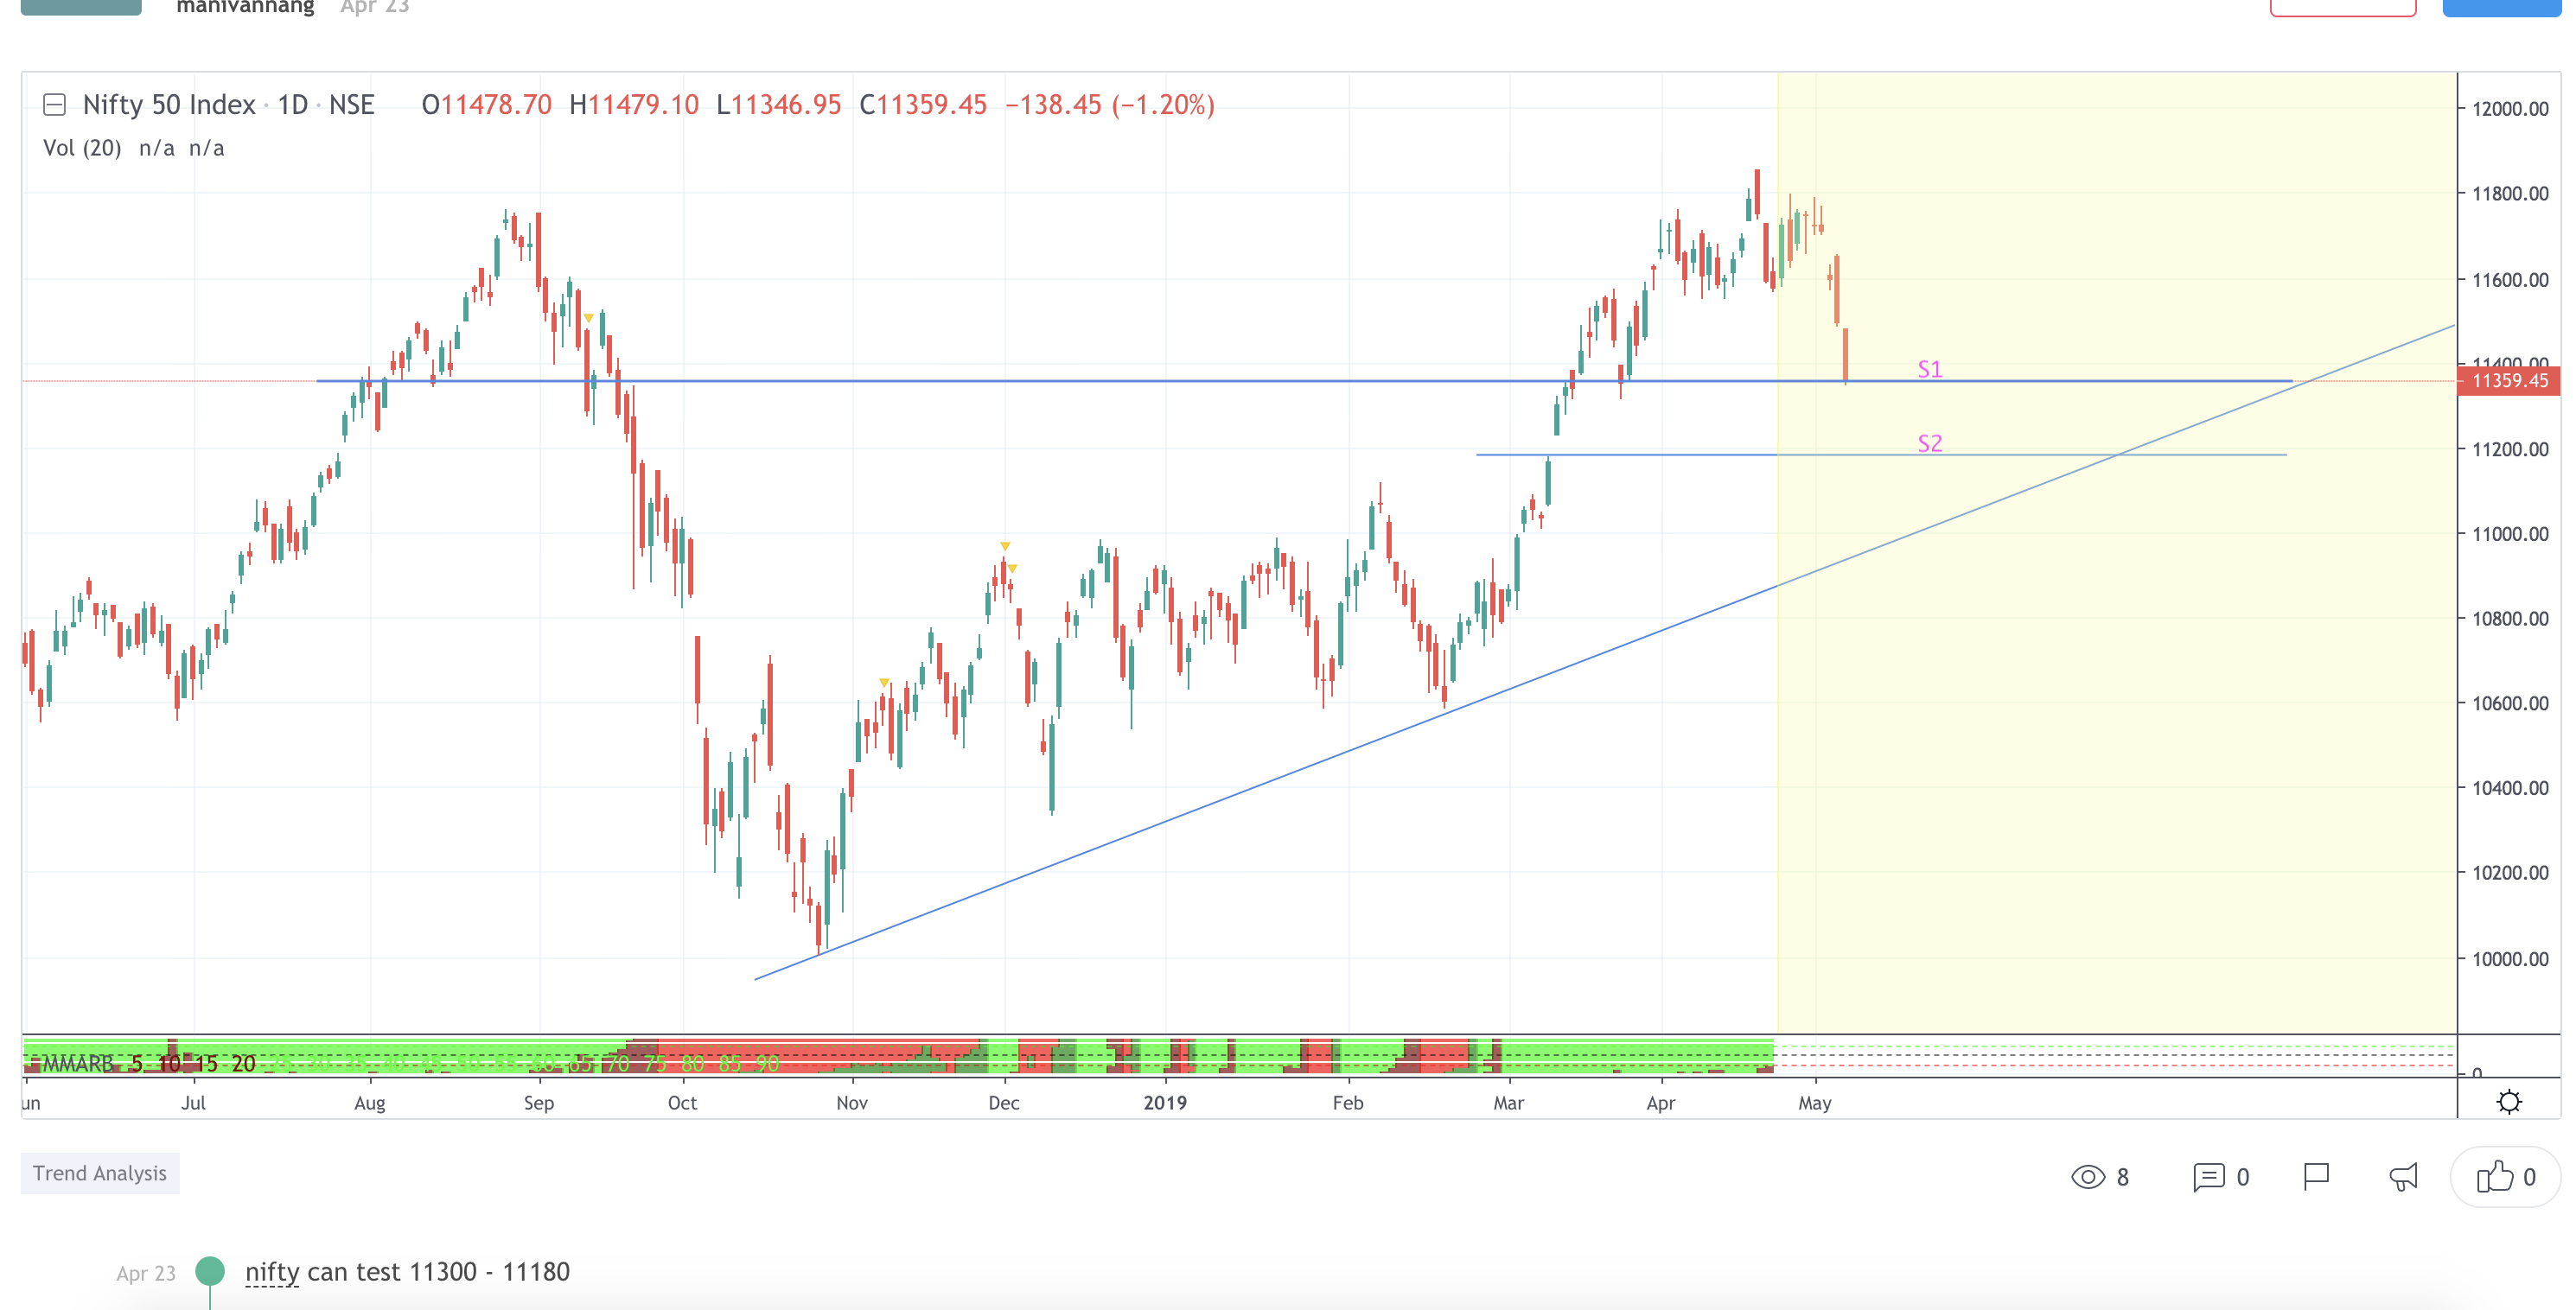
Nifty support levels:
Expected to get some support at S1, breaching can test the gap at S2 level (which seems to be likely, after a small bounce.)
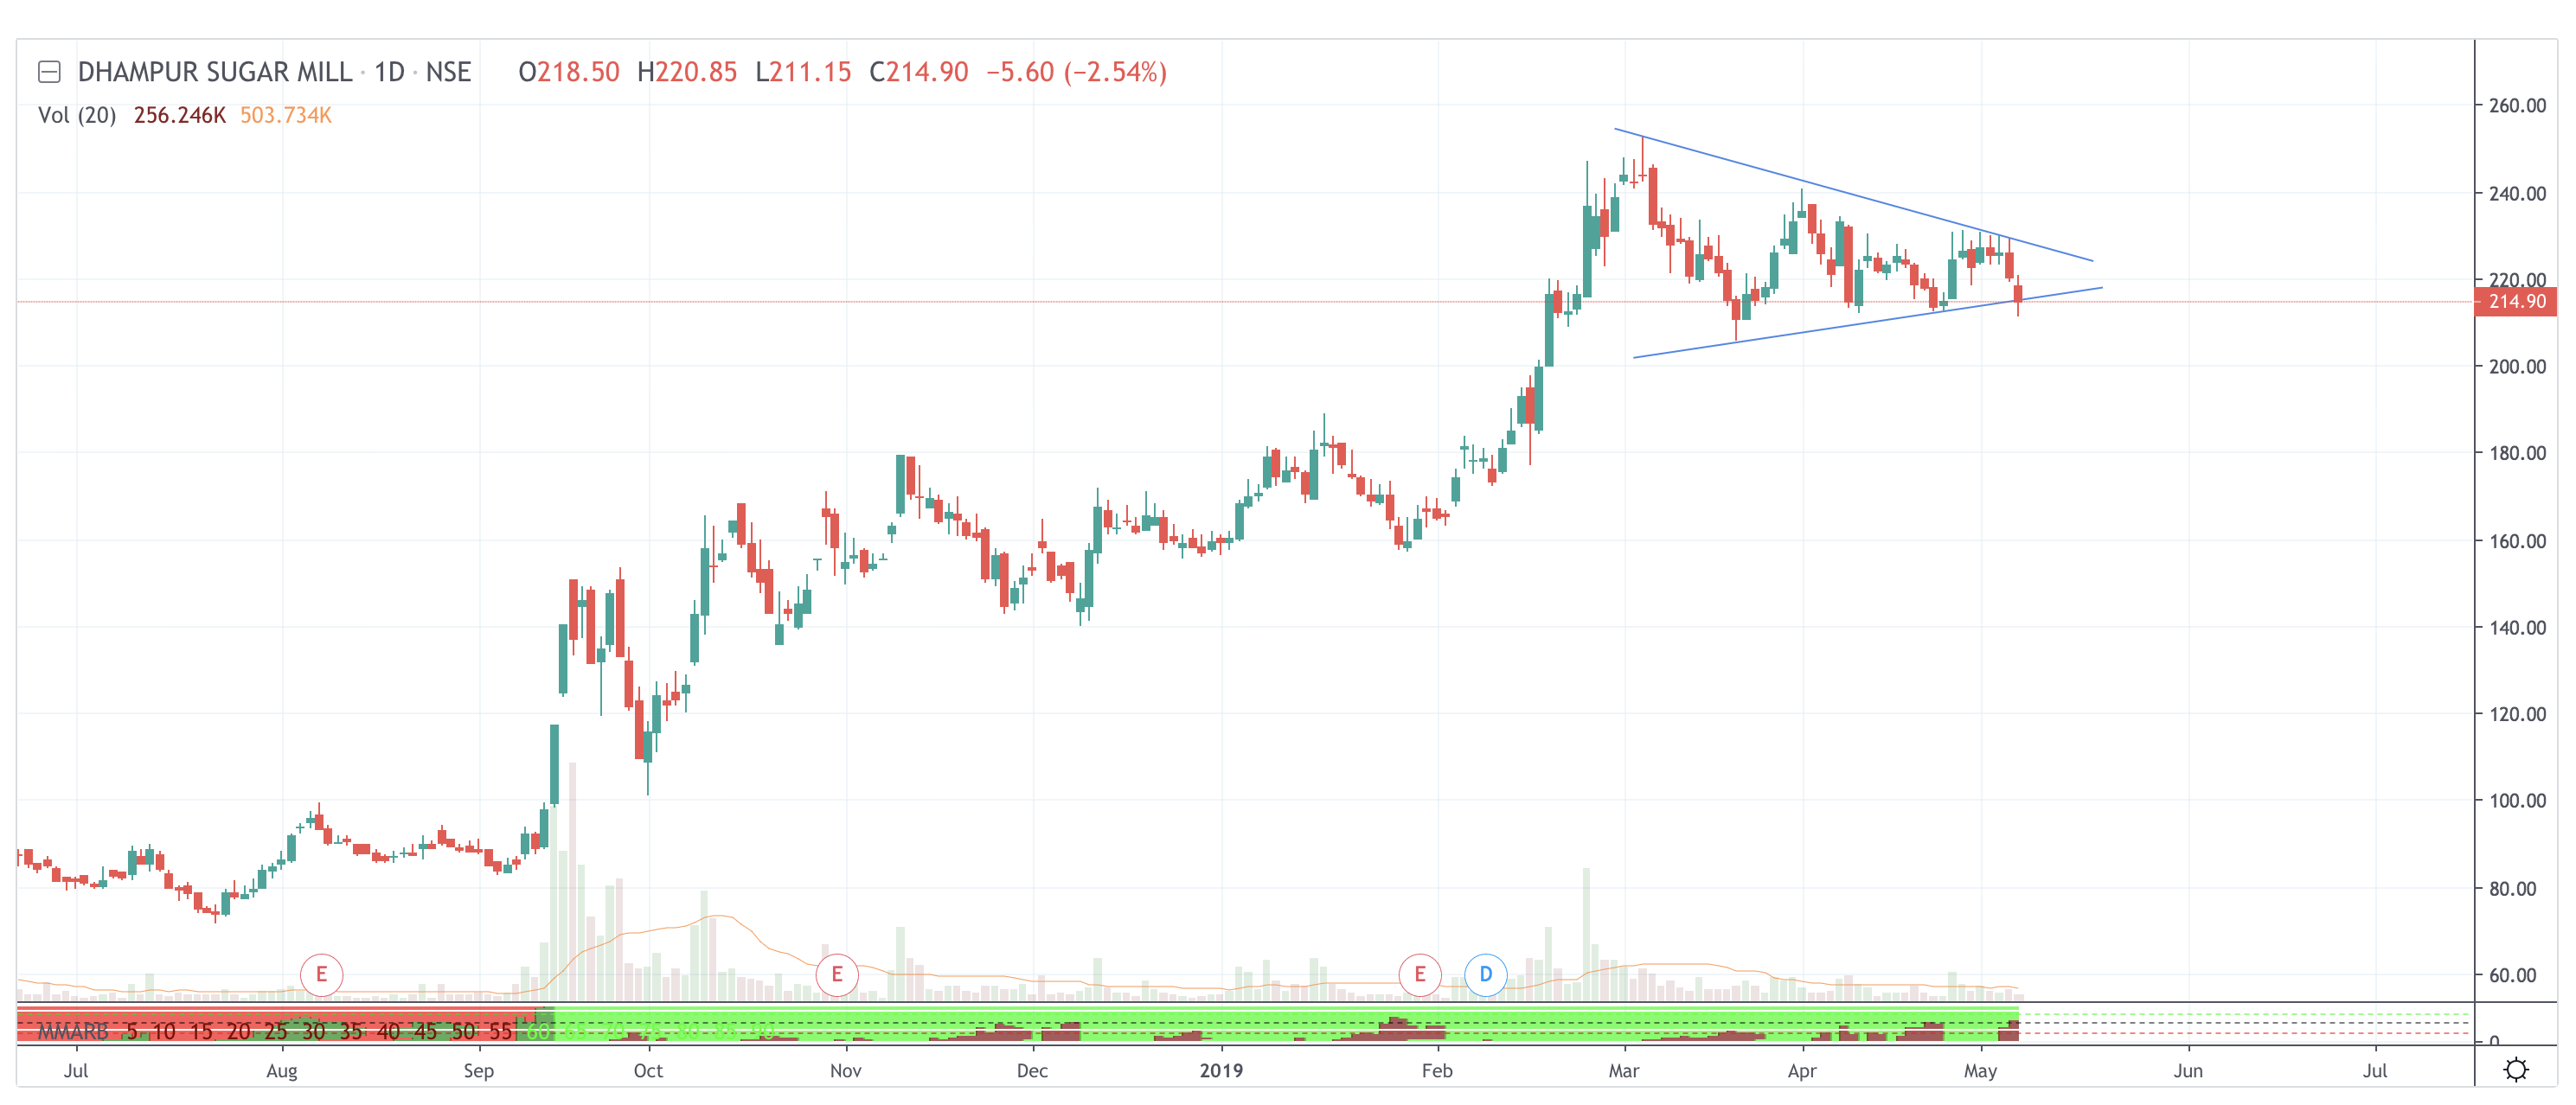
In Dhampur counter, seems like a big move is awaited (either way):
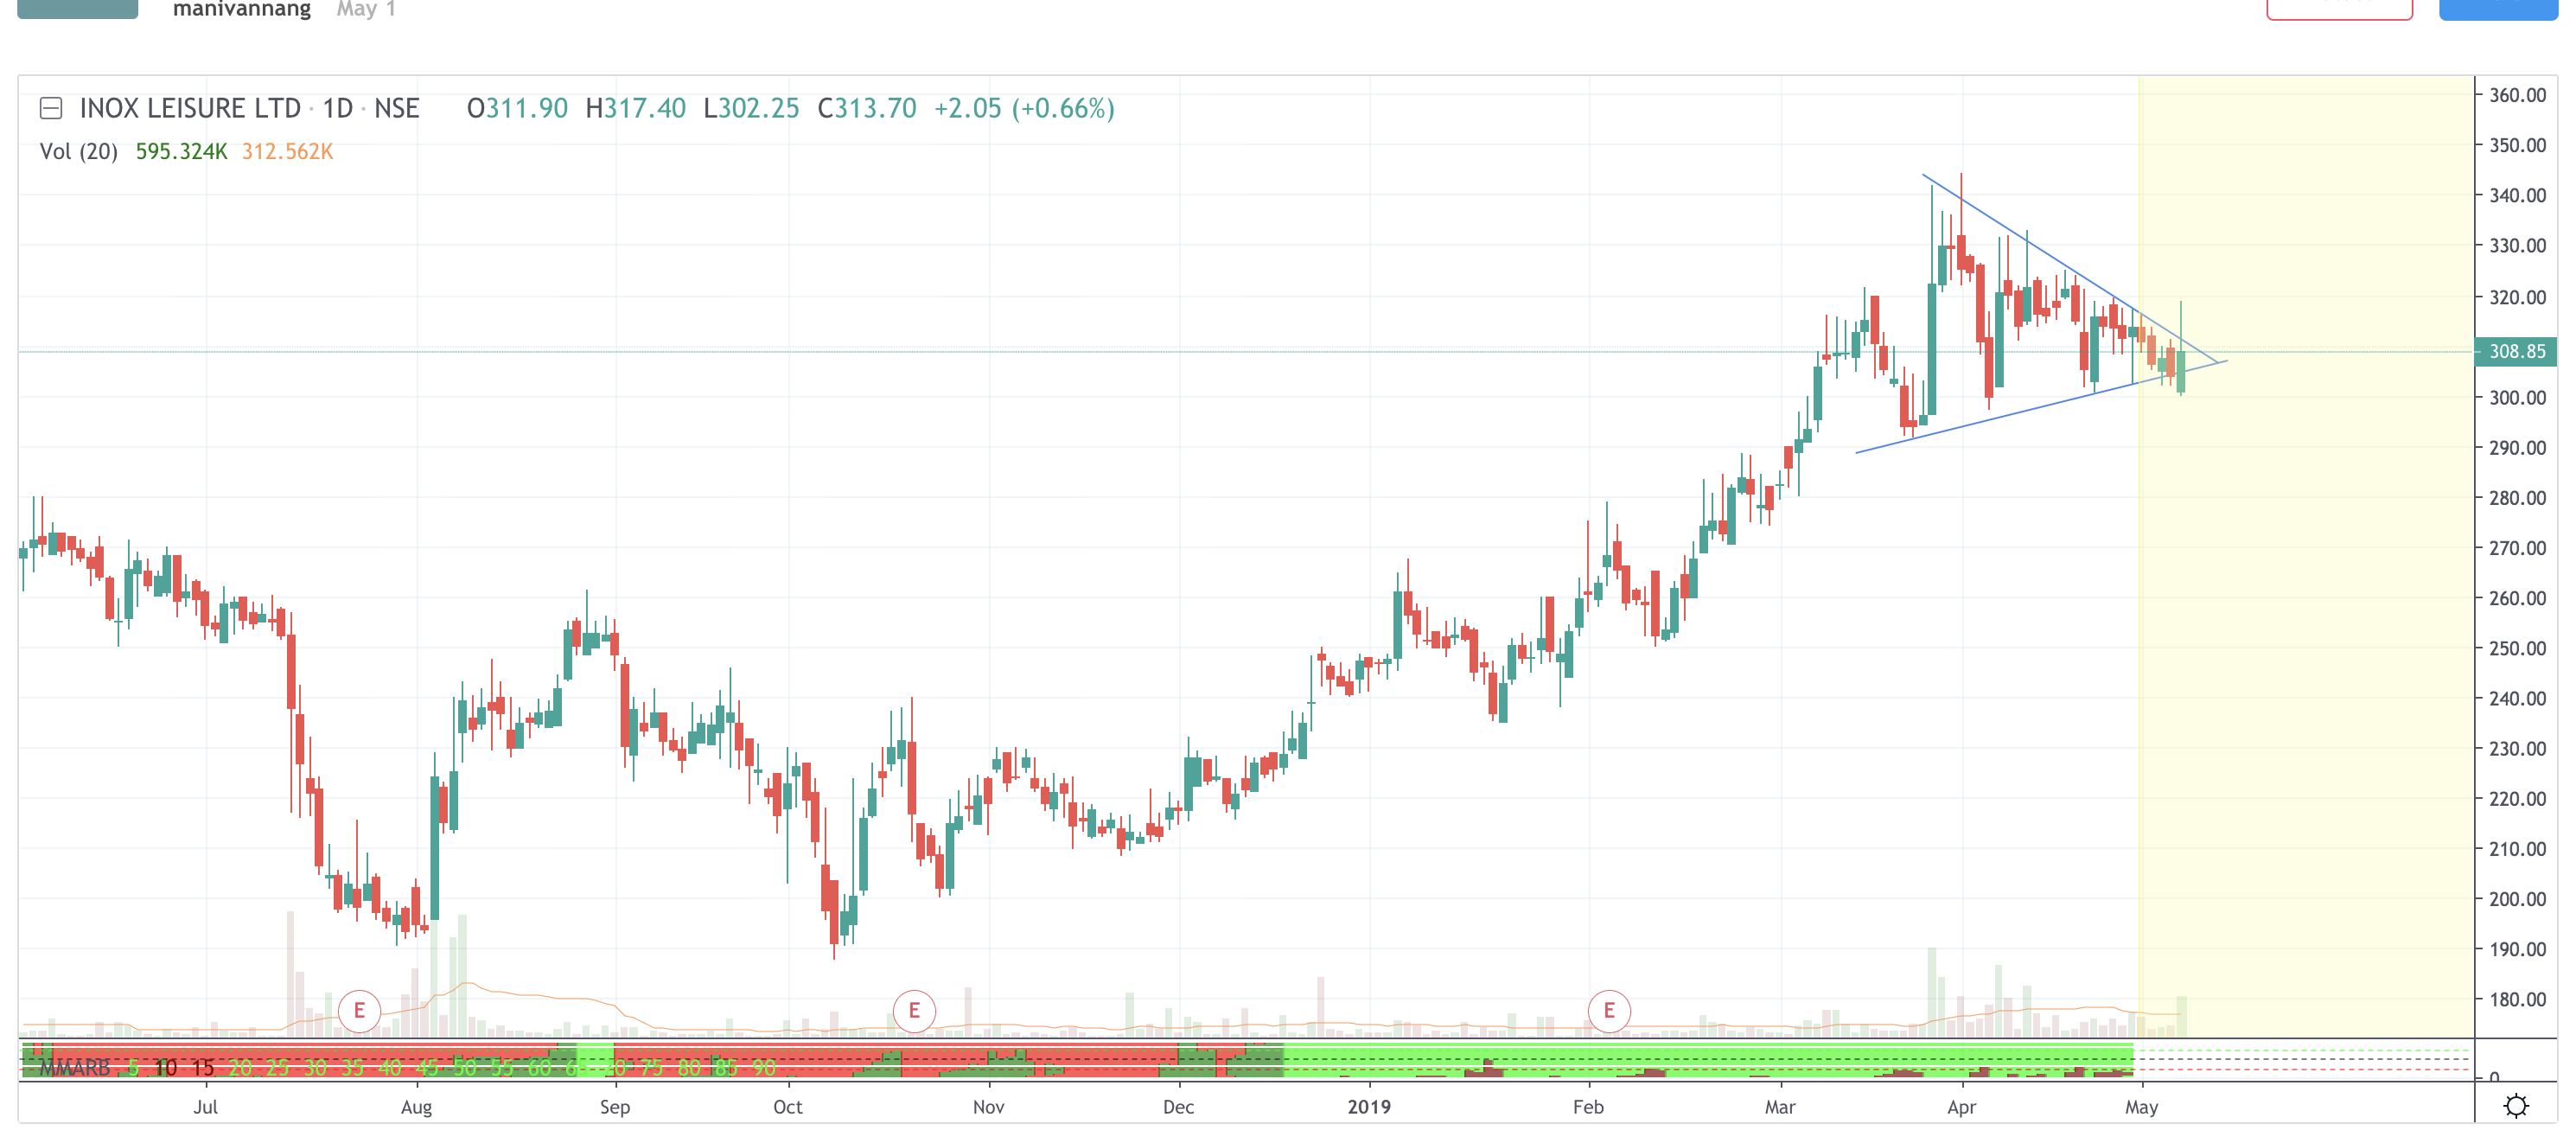
Another one worth tracking: Inox
7 Likes