
firstly as a disclaimer…
i am not very proficient in elliot waves, largely new to the concept…
correction if needed please mention…
time and again, what the headline indices are doing has baffled me, after all market leads the path…
the basic confusion i had, was the small and midcaps were not delivering as nifty was and there has been a lot of divergence…
the basics of dow theory mentions all indices move in tandem…
also, the composition of nifty 50, the leadership stocks such as hdfc twins were looking horrible with wyckoff distribution , and its very unlikely to have a impulsive nifty with its leaders under distribution…
nifty50’s wave structure is such that eyes can easily get biased, while i turned to nifty 500,something was different…
as a conclusion, its a drastic thought, but i think in most likelyhood, nifty had been correcting all along along with mid and small caps… this is not a bull market rally…
this is rather what is a flat correction going on …
and the final leg of the correction is under way…
for reference on flats, i am using this good website link…
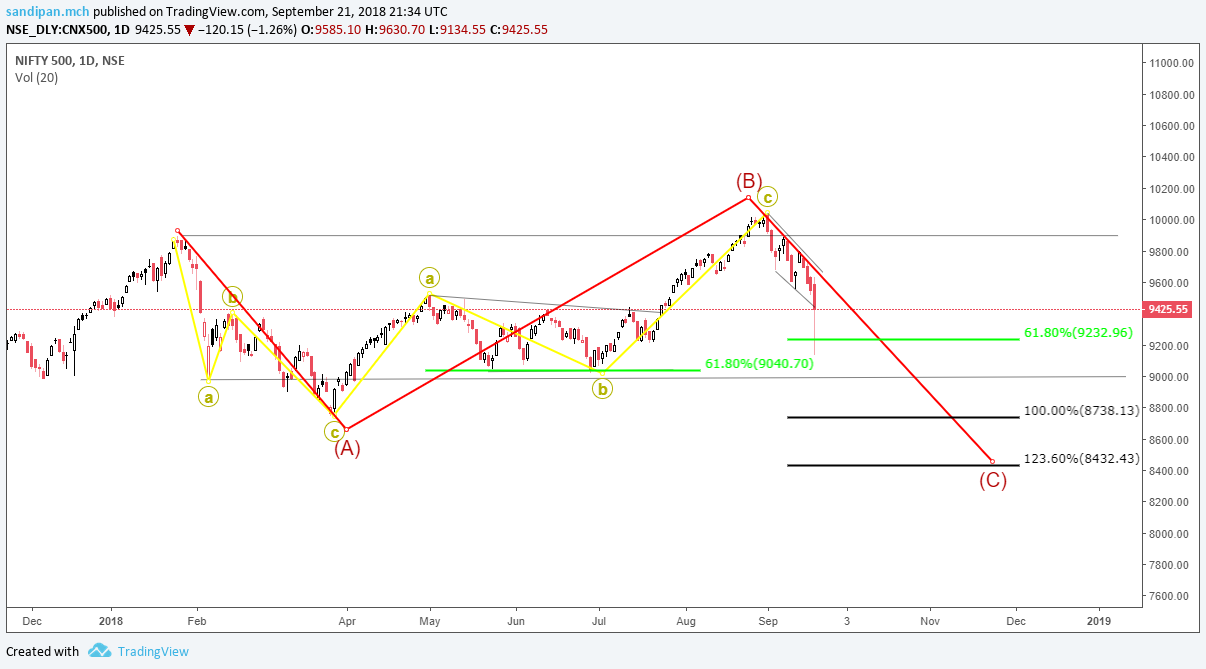
i do not know where the C is going to end…
it might as well have ended at 61.8% or may not have yet… a there are other possibilities like 100% and 123% as the text mentions…
it also mentions there is most likely going to be momentum divergence, which is not yet seen in the oscillators
interestingly… down jones industrial average is facing climactic volumes tonight with deliberation candle stick pattern…
very near the supply line…
also there is bearish divergence in the RSI
a global correction might be coming?
algeria opec outcome and fed rate hike are the two upcoming events…
although the later should be factored in…
i have extreme difficulty in applying wyckoff principles to headline indexes due to lack of volumes in the chart…
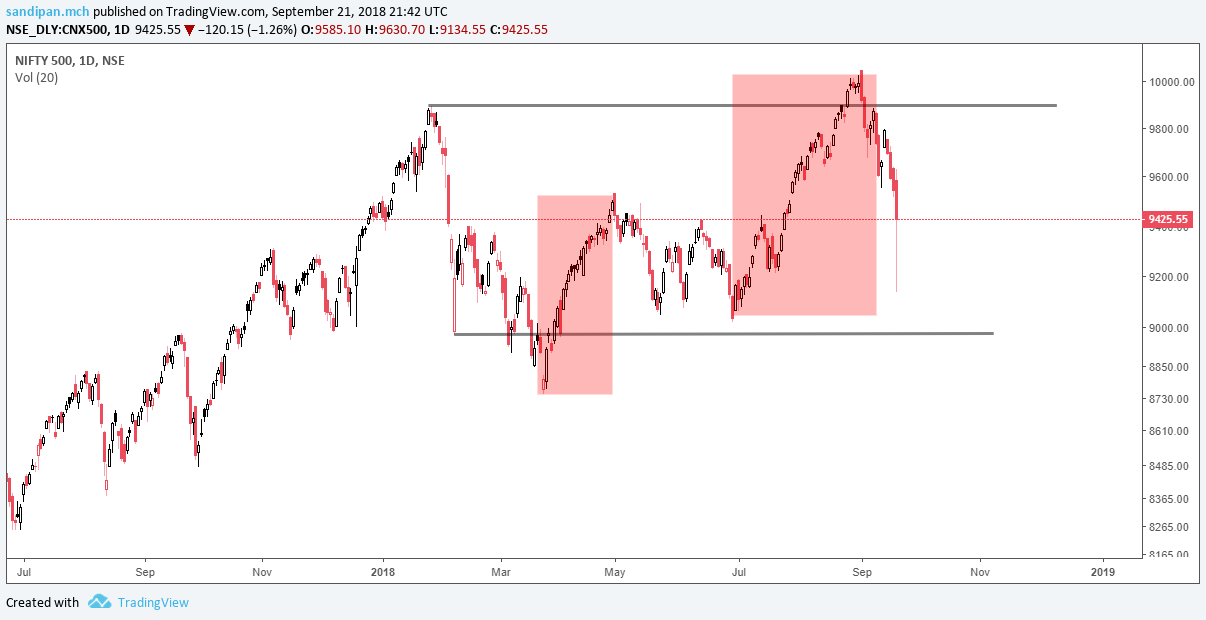
but what i gather is , increasingly impressive rally till now, which has been essentially been converted into an upthrust for now, followed by a rampant decline, which does look like a show of weakness…
lets see how the schematics goes, as the market is neitherways right now…
i am going to hold my scrips, all of which are fundamentally backed beside good technical relative strength…
notable today was, reliance and alembic pharma…
excellent relative strength…
the optimist i am, good news is, this correction should be fast and will be over soon, and a whole impulse wave is left before the actual correction happens, based on the elliot wave theory i am having…
what is going to take the nifty 50 up? thats the million dollar question…
maybe fresh buying coming in after an oversold situation?
after all i believe the issues what caused the crash today was inorganic and manipulated…
whatever it is, ITC and reliance certainly look good on the technical charts…
as of now, 10600-10800 should be a region to watch in nifty 50…