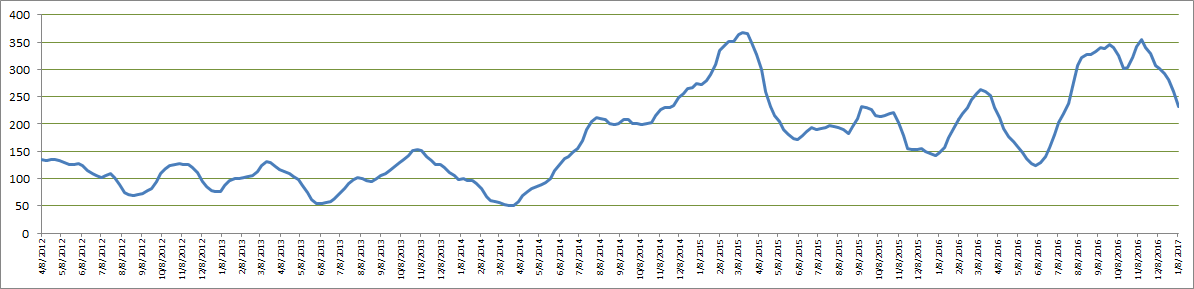
I have been experimenting with Google Trends a lot after reading the book " In the Plex". Its awesome what you can extract with google. for e.g here is a sentiment indicator that i have derived from the search volume data available on google trends and it tells you a story. The data ranges from 2012 to 2017.
Anything below 100 is fear and anything above 250 ish is approaching greed with 300+ being “rulayega kya”. These are levels that i have eyeballed and decided as thresholds but they certainly mirror greed and fear in my opinion. Please note that all this data is based on search volume and not on financial prices or any derivative of it. I find it very very cool. Please add to this if you find it useful and maybe you can extract your own stuff from google and post it here for the benefit of the rest of the community
I agree with Deepender.Juxtaposing this trend line with index might produce some interesting output.However,we need to keep the context in mind while analysing.
you go to google trends and type in a keyword that you think is strongly connected to stock market optimism & pessimism. There is a research paper that did just that and found very positive results with the word “debt”. You can google for it . You can then download the data and play around with it
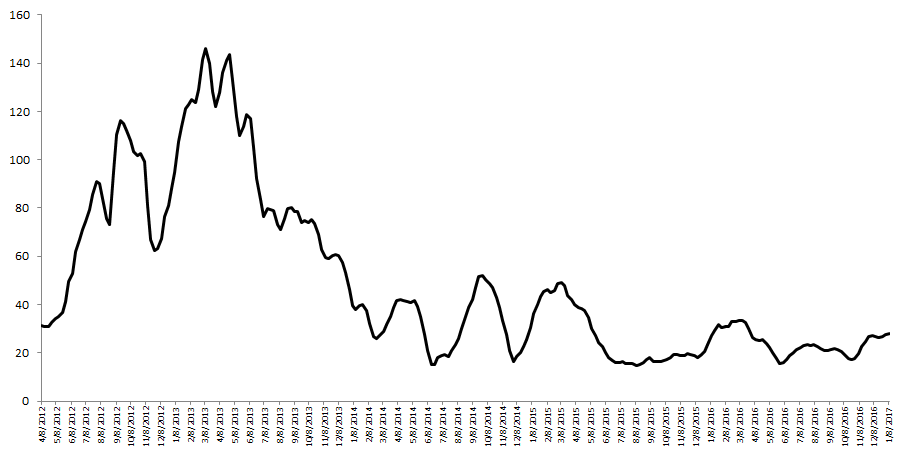
Similar sentiment chart for property. It would be a good idea to look for attractive bargains in property or property related stocks at this juncture… sentiment has just fallen off the cliff here
the google trends data will have a value between 0 to 100. You will have to import the data and use it to create your indicators. For e.g i sum the data for a couple of periods and do a moving average
5 year data tells you nothing. You should get the data for as long as you can find, in India that’d be from circa 2003 I suppose, when internet became somewhat accessible to a lot of people.
Secondly, rather than having the index overlaid on top of this, wouldn’t the PE ratio or volume would be a better choice?
PS: I would have agreed with the OP that google trends are a great tool even for as short a time as 5 years, except this time, the interest is high even though banks have boatloads of NPAs, there is little increase in profits of corporations, the world is in recession and we just had demonetisation.