Can you please quote source of your date i.e end of November?
Can you please quote the source? I could find this figure anywhere. I read somewhere that EU comprises of 18% of Indian marine exports (not shrimp).
Can you please quote source of your date i.e end of November?
Can you please quote the source? I could find this figure anywhere. I read somewhere that EU comprises of 18% of Indian marine exports (not shrimp).
Hi Gaurav,
It’s in the articles I have shared.
Source: http://pib.nic.in/newsite/PrintRelease.aspx?relid=171355
Quoting the text from above url below. According to which EU’s share is 77,178 MT out of 4,24,484 MT. The numbers are for 2016-17.
The demand from the European Union of Indian marine products grew substantially during this period while USA and South East Asia continued to be the major importers. The overall export of shrimp alone was pegged at 4,34,484 MT worth US$ 3,726.36 million during 2016-17. USA was the largest import market for frozen shrimp (1,65,827 MT), followed by the EU (77,178 MT), South East Asia (1,05,763 MT), Japan (31,284 MT), Middle East (19,554MT), China (7818MT) and other countries (27,063 MT).
Tejas
US imports from India continued to grow in September
Key highlights from Sept’17 data of US shrimp imports:
Source:
https://www.st.nmfs.noaa.gov/apex/f?p=169:2:::NO:::
Disc: invested in Avanti
Points from above article which would imply significant tailwinds for shrimp exports for the next few years:
China has a target of increasing its aquaculture production by 15.4 million metric tons by 2025, but the level in 2017 is set to drop.
However, output will drop this year and also until 2020, as part of a Chinese government plan to cut total output – including wild catch – and focus on innovation and higher quality.
At the same time, imports are forecast to go from 5.7m metric tons in 2017 to 6.4m by 2020, according to Cui.
0.7m metric tons in 3 years would be humongous! ![]() That’s more than India’s annual shrimp production.
That’s more than India’s annual shrimp production.
Added later: Got confused! The article refers to the complete aquaculture industry in China and not shrimp alone!
http://tu.listedcompany.com/misc/PRESN/20171107-tu-resultPresentation-3q2017.pdf
Slide 29 mentions:
Net profit was driven by improved contribution from strategic investments and Red Lobster & Avanti Feeds
Disclosure: Invested
Great find. Thanks for sharing
@madhavikkutti
Thanks for sharing.
Good to see Donald’s name in the above article.
Bangalore-based value investor Donald Francis (47) says if the industry grows at a stable rate and the company does not let its competitive edge go, there is no reason why one should not hold a stock.
Read more at:
//economictimes.indiatimes.com/articleshow/61573206.cms?utm_source=contentofinterest&utm_medium=text&utm_campaign=cppst
Q2 Results:
YoY nos.
sales : 854 Cr vs 684 cr (up 25%)
PAT: 126 Cr vs 42 Cr (up 300%)
OPM @ 22%
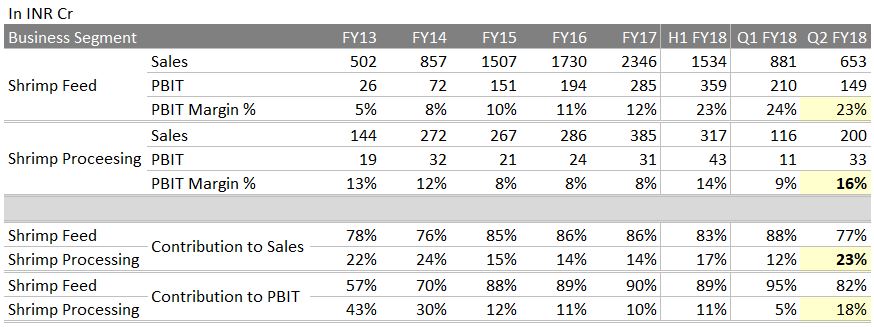
Shrimp feed revenue: 652 cr vs 555 cr (up 17%)
Processed Shrimp: 200 cr vs 129 Cr ( up 55%)
http://www.bseindia.com/xml-data/corpfiling/AttachLive/02610a22-ba28-49dd-be58-a547c3c095ad.pdf
Good Q2 numbers by Avanti. As expected, y-o-y Profits continue to raise in Q2 FY 18 ( by 3 times this year compared to Q2 FY 17). Q-O-Q, profit is down in Q2 compared to Q1( by ~ 15%). In my opinion, management target of shifting the business mix to feed & processed shrimp to 60:40 is happening as can be seen from this qtr result.
http://www.bseindia.com/xml-data/corpfiling/AttachLive/02610a22-ba28-49dd-be58-a547c3c095ad.pdf
Disc: invested
qoq is down though yoy results are good. Could anyone please guide if q2 is always sober than q1 for avanti. Also the processed shrimp share is showing good healthy increase.
Disc: Invested
From an article above:
That said, the March-June period is a peak consumption season for shrimps, September is good while December and the March quarter are known as a lean season.
Good show and slightly above expectations fuelled by the processed shrimp business (Revenues up 55%) while shrimp feed revenues growth moderated at 17% YoY. Overall, I think bottomline growth remains strong and even at a 20% run rate, FY19 EPS should be at around 150-155 implying that the stock is trading at 19x FY19E. I think stock should be up by at least 3-4% on Monday. Keen to understand why shrimp feed revenue growth have been fairly subdued YoY given the capacity expansion
We have to keep in mind Management guidance is overall 25% topline growth. Mr.Indra Kumar mentioned this number in a number of Interviews, if I am not wrong
The key highlight of Q2FY18 result is Shrimp Processing numbers. Contributed 23% to total sales (co. intends to reach 50% in 2-3 years). Can processing be as profitable as feed? Q2FY18 provides data point to ponder. 16% PBIT margin; this is when fraction of processing capacity is utilized. Seems exciting times in Avanti is going to continue, if the shrimp processing numbers are an early glimpse of trend forward…
Some data to chew…
Fair enough.
Nevertheless, few things I am thinking of. Last quarter, revenue growth was 40% YoY for shrimp feeds while this quarter its come down to 17%. Given that the Bandapuram plant started starting operations in early Aug’16 (150,000), the company had the benefit of a low July base which will not be there in Q3. As long as input prices remain low they will cushion lower revenue growth in shrimp feed business but given the headwinds from a prospective EU ban and current valuations, I am keen to understand how the shrimp feed business is performing - is revenue growth moderation due to lowering of pricing to gain market share or something else?
Your question can be answered by looking at the seasonally adjusted sales and other data.
When we measure sales every quarter, we want to know what happened in that quarter. This can be done by looking at quarter on quarter change. But for a company with seasonality in sales, q-o-q change can be misleading. So we look at year-over-year numbers to account for seasonality. But year-over-year change number is essentially weighted average of 4 quarterly changes so y-o-y change for any quarter only shows 1/4 of the impact of change in that quarter along with 1/4 of the impact in 3 preceding quarters.
This does not give complete picture of impact in the most recent quarter. In fact, the impact (either +ve or -ve) will be seen in the next 3 quarters. Moreover, as the quarterly impact is divided over 4 quarters, its intensity is also reduced. It is equivalent to taking a moving average of 4 quarterly changes which tend to dampen the real volatility in underlying series.
To solve this issue. seasonal adjustment is done to the data series.
Here is how Avanti Consolidated Sales appear using reported numbers.
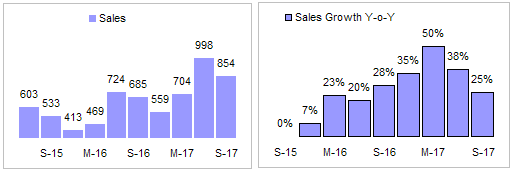
Source: Capitaline
Here, we can see that June and Sept quarters are clearly strong in sales while March and December sales is relatively weaker. Now, when sales is adjusted for this seasonality, we can see the seasonally adjusted annual sales. Chart below shows seasonally adjusted sales and q-o-q change in seasonally adjusted sales.
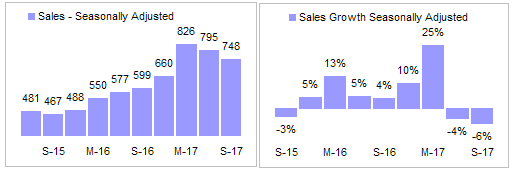
Source: Capitaline
Here each quarterly sales number is adjusted for seasonality factor so that a quarter-over-quarter change shows full impact during the quarter (instead of only the 1/4 impact as in y-o-y series). This shows that Avanti had a great run from Dec 15 to March 17. Since then sales have declined sequentially for last 2 quarters (on a seasonally adjusted basis). Of course, a small decline after a great run is nothing to lose to sleep over but this exercise shows that while y-o-y growth for last 2 quarters is seen as 38% and 25% respectively, it is -4% and -6% on a SA q-o-q basis.
Seasonal effect becomes more pronounced as we move from top line to bottom line as fixed costs tend to magnify effect of seasonal changes in sales on bottom line.
Here is the the chart showing EBITDA growth on a y-o-y basis and on Seasonally Adjusted Annual Rate (SAAR) basis.
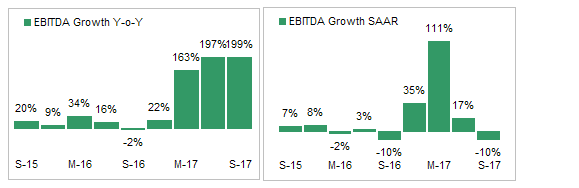
Source: Capitaline
Attached spreadsheet shows detailed calculation.
Seasonal Adjustment - Avanti Feeds.xls (227.5 KB)
Disclaimer - My seasonal adjustment calculations are very basic and still in beta stage. There are far more sophisticated seasonal adjustment algorithms (e.g. X-13 ARIMA) available publicly.
Hi,
I didnt understand so requesting. Could you pls also help explain how does your analysis answer the question which I guess you tried answering:
how the shrimp feed business is performing - is revenue growth moderation due to lowering of pricing to gain market share or something else?
Thx
RR
Assume a company X having sales of 100 crore in q2fy17 and sales of 120 crores in q2fy18. Increase in sales in ((120 - 100)/100) x 100 = 20%. This is year-on-year sales growth.
I have not taken weighted average of 4 quarterly changes. For that matter I do not know what are the sales figures of other quarters. Can you please explain what do you mean by what you have written and I have quoted above?
To explain it better, I am including chart of growth in gross profits (on a seasonally adjusted rate basis).
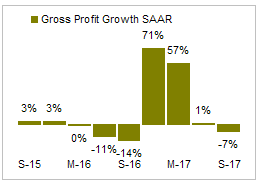
Source: Capitaline
Posting Sales growth chart from previous post.
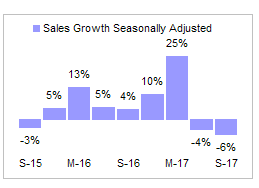
Source: Capitaline
Comparing sales growth and gross profit growth (on SA basis) shows that finished goods prices started rising in December 2016 quarter (as gross profit was rising faster than sales) and continued until June 2017. In Sept 2017 quarter, sales have dropped marginally and gross profits have dropped along with sales by about same % points indicating prices peaked sometime around June quarter and have remained around those levels in Sept quarter. Operating leverage kicked in March quarter as EBITDA grew much faster than gross profit (again on a SA basis). In Sept EBITA declined along with Sales indicating full impact of operating leverage is already in the accounts at current level of sales.
Combined effect of sales growth and change in margins can be seen in (seasonally adjusted) bottom line shown below
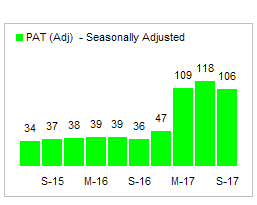
Source: Capitaline
Profits peaked in June quarter and moved slightly lower in Sept quarter although still substantially higher than historical levels.