Amazing Fib Time Zones sequence seen in this Nifty Rally

This forum being dedicated for sepperating wheat from chaff, I am not sure it is right to post this here. Any way sharing my observation. Any respectable members who can guide me in a better way in this analysis pls share their valuable views

Fib numbers:
0,1,1,2,3,5,8,13,21,34,55,89,144,233,377,610 …, ……, ……, ……, ……
Fib Numbers are a series starting with 0 and 1 the next number is the sum of previous two numbers.

After the first few numbers in the series the ratio between subsequent numbers are a constant 0.618. The ratio between one number and previous number in the series will be 1.618. Ratios between alternating number is 2.618 and reverse ratio is 0.382. These are important fib ratios.

The fib sequence and fib ratio has got astonishing influence in many natural phenomena, and is said to influence financial markets also

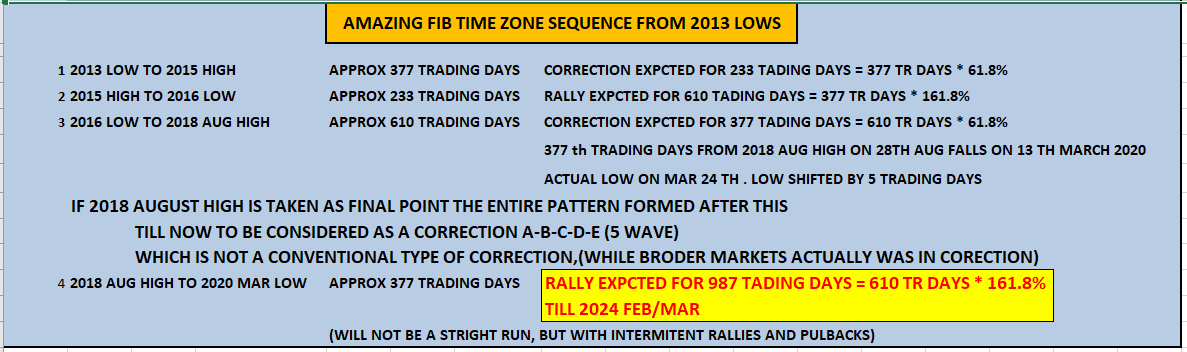
Fib time sequence in the present rally.

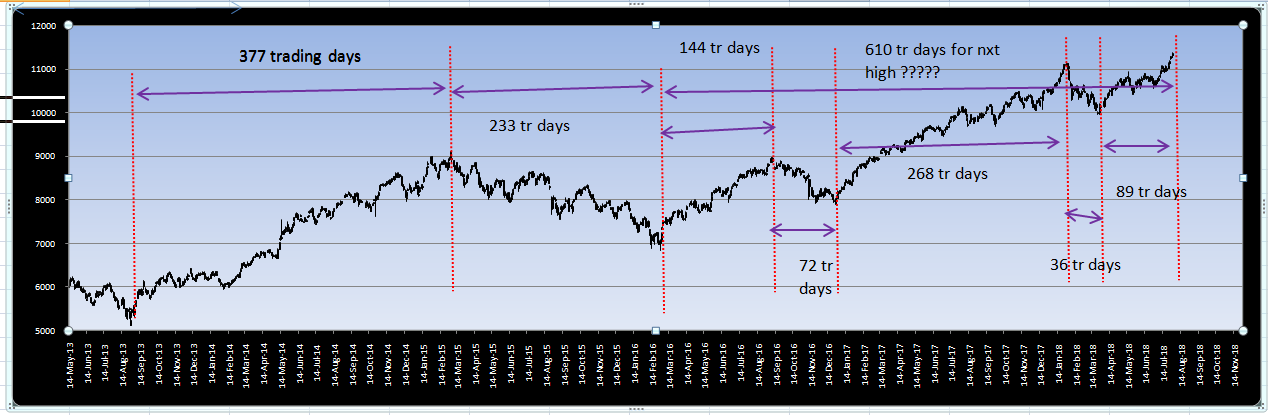
The present rally in nifty has started from the lows of 2013 aug. ie 5119( When ReghuRam Rajan took over as RBI Governer followed by BJP’s declaration of Narendra Modi as PM candidate in sept 2013.This rally till present has shown an amazing sequecnce of fib time zones.

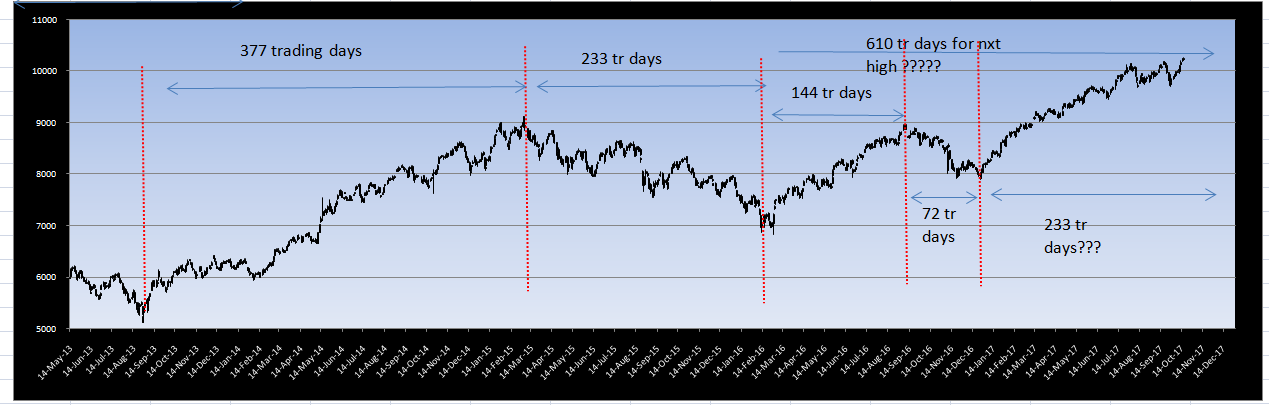
Low on Nifty was made on 28th august 2013 which was 5118. On march 4,2015 nifty made a high of 9119. This occurred after 374 trading days from 28th august 2013, which is very near to a fib number 377. Then a correction happened and nifty fell to 6825 in feb 2016. The closing low was on feb 11th 2016 which was 6976. This was after 233 trading days from march 4,2015. 377 X 0.618 =233. (0.618 is the golden fib ratio)

The next high was on sep 8th 2016,closing at 8953. Ie 141 trading days from feb 11th 2016, which is very near to a fib number 144. Again 233 X 0.618 = 144

Then the demonetization low came on Dec 26th 2016, and this was 73 trading days from sep 8th 2016. 144 X 0.5 = 72. (0.5 is also considered as important fib ratio.)

From Dec 26th 2016 low of 7893 nifty has rallied in a non stop manner and several fib time zones passed like 55, 89, 144, etc. Now next fib number 233. 233 trading days from Dec 26th 2016, falls on Dec 5,6th 2017. Will nifty hit a high near those days and retrace after that is the next big question.

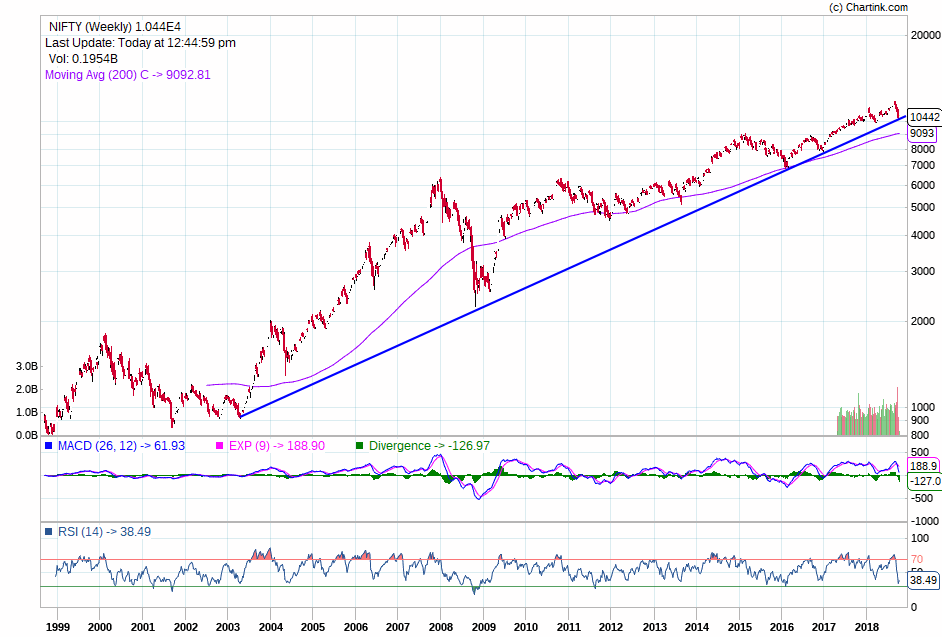
This is the weekly chart of nifty.

It can be seen that if nifty hits 10600-700 in the first week of Dec 2017, it can face resistance on the channels upper boundary of the present rally from feb 2016 lows. This coincides with the previous Fib time zone theory of 233 trading days. If nifty hits resistance at 10600-700 levels near first week of Dec 2017 and then goes in a correction mood, that means the fib time sequence is working again.
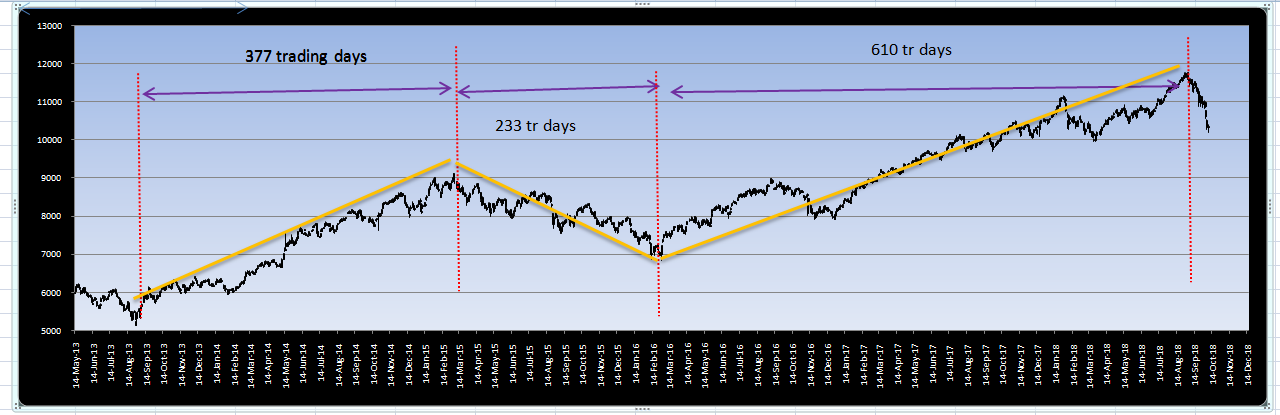
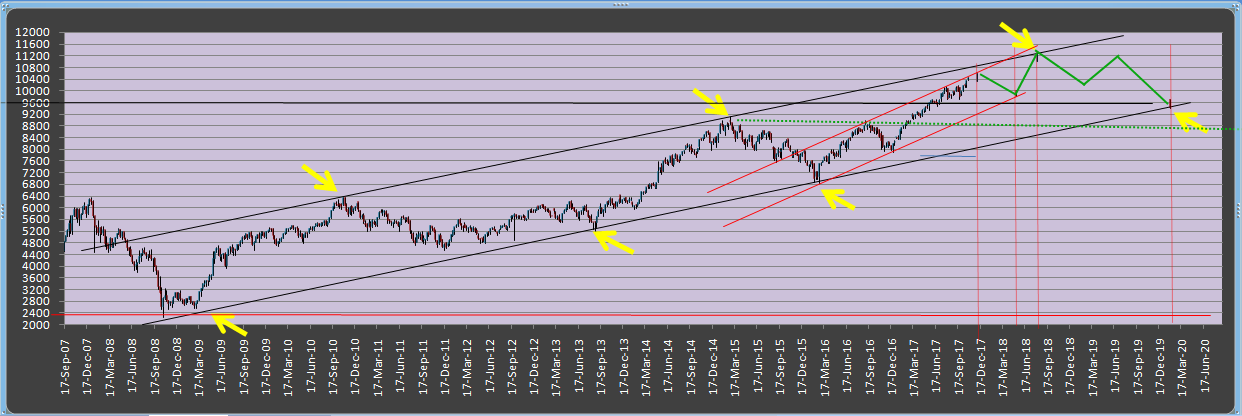
My projection

After hitting the resistance nifty may go into correction mood. I expect a major high of 11200-300 after 610 trading days from the on feb 11th 2016,which is another fib number. I took this 610 as it is 1.618 X 377, which was the first rally from aug 2013-mar 2015. 1.618 is the ratio between two successive fib numbers. This will coincide on August 2018. This will hit the upper boundary of the upward channel shown in the chart from the 2009 lows.

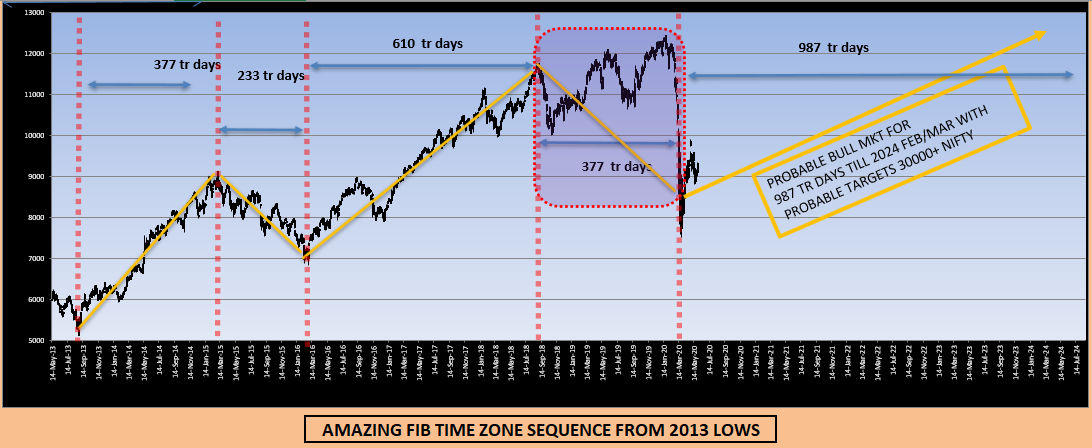
After that 0.618 X 610 = 377 trading days correction which may take nifty to the bottom boundary of the channel may happen. This will coincide at 9600 levels by Feb 2020. By the time there may be earning upgradation happening there by cooling the PE multiples to fair valuations.

Then next fib number 987.ie 610 X 1.618. This works to about 4 years from feb 2020. Ie 2024. trading days Mean time any breakout above the upper boundary of the upward channel from 2009 lows may initiate the mega bull run.

Here is the long term chart of nifty from 1990.

NIFTY CHART 1990 onwards

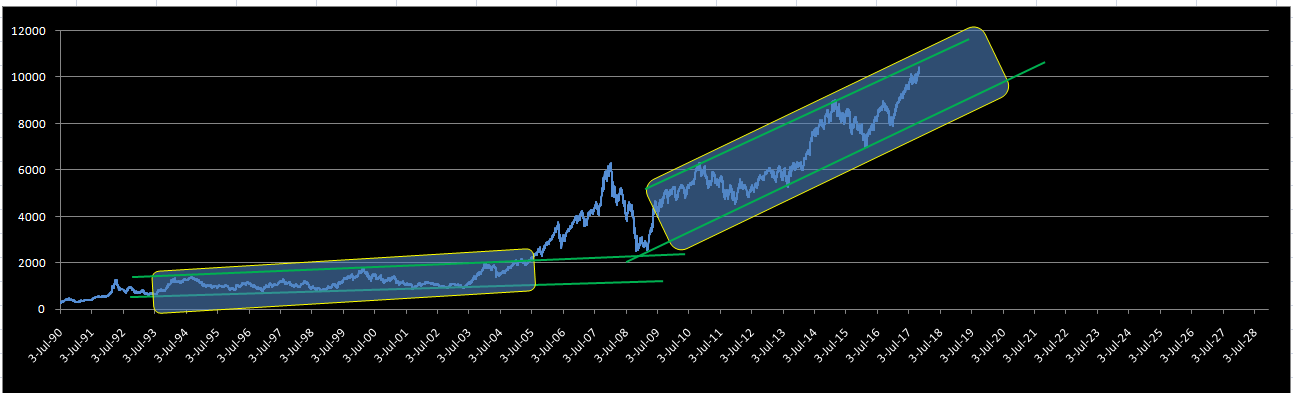
NIFTY LOG CHART 1990 onwards

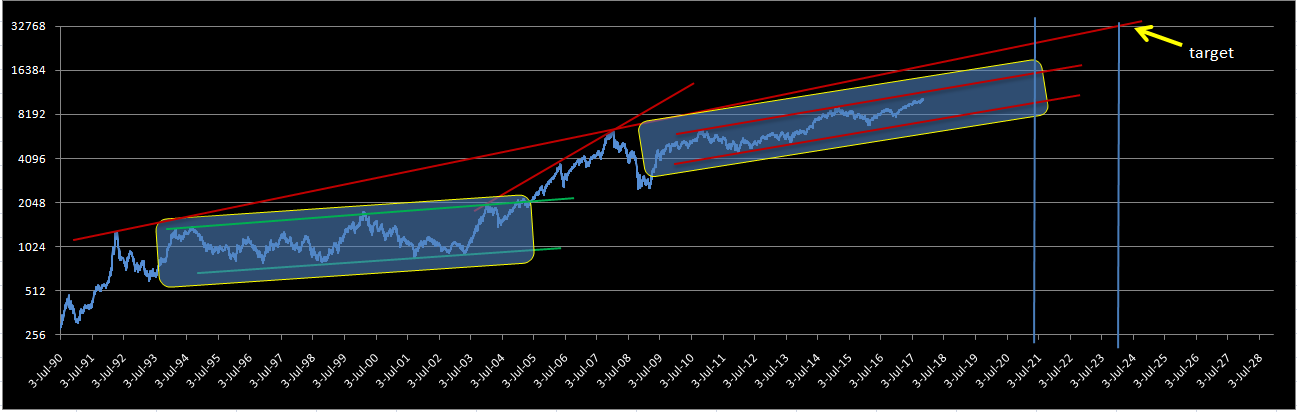
After the 1991 Bull market , nifty consolidated within a channel, which was brocken out in 2005 for the next bull run.This can be seen in log chart also. Interestingly in the log chart 2024 coincides with 32000 range in nifty. Elliot wave international, an authority in EW analysis has given a target of 100000 sensex by 2024 in 2009 itself. And 100000 on sensex means 32000+ on nifty.

Discl: This is just my observation from my limited knowledge of chart analysis and fib time sequences. As they say limited knowledge may be more dangerous than no knowledge. I can be completely wrong also. And the pattern in nifty till now which resembles a fib time sequence may be a mere coincidence also.

(I am still 100% invested and is planing to deploy more in corrections. Does only portfolio reshuffling at times. Not planing to change to more than 20% cash at any point. Has hedged my portfolio by holding gold mining stock- deccan gold, gold refining stock- shirpur gold, and invested in DSP blackrock world gold fund. These alltogether has 20% of my portfoilio)

8 Likes

Not to devalue your work here, but it seems to me a combination of two series: 1) The fibonnaci number series and 2) The fibonnaci ratio series. And you allow for any number of combinations of these two series (like 233 x0.618). And you then also allow for “very near to”. It seems ypu can fit any random series under these constraints.

1 Like

appreciate your comment. but i think fib number series and ratio series are very much interrelated.
Regards

Although the effort to explain the recent run and possible future scenarios is commendable, I think we need to keep in mind that “Correlation does not imply Causation”… Probably a series of prime numbers can also explain the movements of nifty but I doubt if it could be of much help to predict the future

Hi,
rightly said. It may be wrong to predict future trends based on any past trends. Making investments and trades purely based on this type of analysis can be dangerous. Only thing is that we can keep tracking such trends and keep a vigil on potential trend changes in future

Hi all
eventhough nifty made a high of 10490 on Nov 6th, 10410 which was very close to the alltime high was made on nov 28th. The previous high of 10490 would’ve been breached on nov 28th if there was not a ICBM testing by north korea (US markets were closed at a big positive on the prior day). If the nov 28 is taken as a high day, then it was 229th trading day from dec 26th 2016, which was the low day from which the current rally started. it is again very close to 233 a fib number. So this can be an intermediate top and after this trend changes are seen from the charts with lower highs and lower lows. So i expect this down trend to continue till we reach a bottom from which the next phase of rally to 11200-300 some where in august 2018, (which is after 610 trading days from the low on feb 11th 2016).
Somebody who is having a criticising approach will say that i have selected the high and low days as per my convinience to suit the analysis. This may be somewhat correct (as i have selected a low day on feb 11th, 2016 instead of feb 28th which was the actual low day and now i selected nov 28th as high day instead of nov 6 th which aws actualy the high day and given my justification for selecting those days) ,but i still belive that Fib time zones has got its effects in financial markets. I request other respected members who are experts in technical chart reading to look into this thread and give their guidance. thanks in advance

Hi @josephseby

Like you - i also believe that there is a kernel of truth to fib sequences - whether applied to time or prices. However, I dont have the intellectual scope of finding any systematic recursive application of it and I gave up after finding myself spending too much time on them and finding patterns where none existed. Once bitten by the TA bug, one tends to assign meaning to random occurences which by definition have a 50% chance of occuring. All i can say is that fib levels need further study and have promise and in conjunction with what you know about the fundamentals of the company - form a great pair of tools. However , I like what you are doing and encourage you to dig deeper and share your findings.

TA also has a rich heritage and one needs to have an open mind about these things. It gives you an edge for sure if you can read the charts and learn to separate the spurious from the real.

3 Likes

@josephseby- fascinating work done by you. I have very less knowledge of technical analysis, but it is very intriguing. the target mentioned you in the post have more or less hit the mark, however, there is some variation w/respect to the time guideline. nothing to take away from your work, (i am not even 0.1% capable of doing such work), but can explain the reason (if there is any) for the time variation and also how does this change your future targets.

Regards

1 Like

eventhough the current rally can be related to fib time sequence, it may not be prudent to try to predict the future course. Any way I didnt expected markets to touch the channel resistance in the month of january. I expected it somewhere in august. Now if we are considering the same fib sequences markets can still rally and a new top can be reached somewhere near august. I think this type of analysis is of accademic interest only
discl: invsted 80%

2 Likes

AMAZING EFFECT OF FIB SEQUENCE CONTINUED
Gap between 2016 dec demonetization low and 2018 january high 268 days = 233+34 both are fib numbers
Gap between 2018 january high and 2018 march low = 36 trading days very close to fib number 34
Now august 1st week falls 89 (fib number)trading days after 2018 march low
This coincides with 610 trading days (fib number)from 2016 feb lows
The previous rally from 2013 august lows to 2015 march highs was for almost 377 trading days (fib number). The fall from 2015 march to 2016 feb lows was for 233 trading days. So as per fib time zone theory the next rally should be for 377+233 trading days ie. 610 days. 610 trading days from 2016 feb lows almost falls at August 1 st week


This coincides with a high of 28 PE multiple for Nifty. Historically nifty hadn’t survived 28+ PE multiple. This is my study about nifty PE multiple and Anatomy of bull markets

6 Likes

good work @josephseby … have you done anything on small cap or midcap ?

Another instance where fib time zones showed its magic

A fib time zone of 610 trading days from 11th feb 2016 closing low was expected to come on august 1st week 2018. As per this I was expecting a high near august 1st week. But on Feb 29th 2016 a new intraday low was taken and if we take fib time zones 610 trading days from that day it will be on 21st August 2018. Here the high of 11760 was on 28th august 2018 and was delayed by just 4 trading days.

2013 low 28th August 2103 – 2015 March 5TH – 373 trading days (very close to fib number 377).

As per fib time zones the retracement of this rally should be 377 * 0.618 = 233 trading days

233 trading days from march 5th 2015 falls on Feb 17th 2016. A closing low was made on feb 11th 2016 advanced by just 4 trading days

As per fib time zones next rally can last for 377 + 233 trading days = 610 trading days.

610 trading days from 11th feb 2016 closing low was expected to come on august 1st week 2018. As per this I was expecting a high near august 1st week. But on Feb 29th 2016 a new intraday low was taken and if we take fib time zones 610 trading days from that day it will be on 21st August 2018. Here the high of 11760 was on 28th august 2018 and was delayed by just 4 trading days.

As per fib time zones the retracement of this rally should be 610 * 0.618 = 377 trading days.

Which is almost 18 months. If this sequence is been followed the bear market can extend till 2020 february. From March 2020 onwards a rally for 610+377= 987 trading days may be followed till 2024

Discl: Exited 50% of portfolio on aug 1st week. was unable to spot the fib time zone on august last week. has deployed most of the cash into stocks by now. Not planing to wait till 2020 feb as per above analysis. But if it happens then surely will deploy more cash (lump sum) at that point of time. Presently planing to invest in a SIP mode
This following chart is the reason for not waiting more. This is the log chart of Nifty. It has taken support on the trendline from 2003 lows

1 Like

A new update as per 23/10/2018 intraday. may review EOD

Hello @josephseby

Are you still following Fib Time Zones? Do you have any update whether past 1 year it followed the logic. Just based on previous posts, around Feb 2020 (+ few days for holidays), this should be bottom for the market for next rally for 3 years.

The fib time zone was not in Feb 2020 , but in march 2020 (due to adjustments of holydays ) I have been updating in my twitter handle @josephseby78

1 Like

`

#nifty closing low was on march 23rd. and interaday low on 24rth. Just 5 days shifted from 377 trading days from Aug 2018 high. I feel the #timecycle is still intact. https://t.co/qjem5JWe0n

— Seby Joseph (@josephseby78) April 18, 2020

`

Latest updates of fib time zones

3 Likes