
One could add 7.0 HFC’s too into the list of entities as they facilitate buyer-seller transactions.
1 Like
Excerpts from the Article.
Although it is small loans that are driving growth, the borrowers are not from low-income segment. According to HDFC data, in 2017 the average borrower paid out 3.8 times his annual salary towards a home purchase. A year ago, this was 4.1 times annual income, while a decade back it was 5.1 times annual income.
2 Likes
An add-on thought to improve the data collection for this endeavor, the break up of the revenue pool amongst these providers could see dramatic differences between an AH and a middle-income home, depending on the locale, construction techniques used, quality of materials, etc. etc.
Crowdsourcing such information will work only if we have a lot of sample data and the project characteristics.
While @Donald did say we are looking for approximate figures, where the revenue and profits flow could be dramatically different for say the different type of pipe manufacturers, cables, type of doors, etc. while the overall industry profit pool may remain same.
We constructed a 5-floor apartment building in 2012, in a small town. I can try and get the data for that. But intuitively it will be best to gather the data from a recent AH construction project.
Abhinav - you are right. This is also the first thing anyone serious about scuttlebutt, should think through - make sure that the data provided is as authentic, and logically defendable as possible. This is NOT about crowdsourcing, It is about getting the data right from the horses mouth - just like we have been doing in countless cases like in Astral, Kaveri Seed, Avanti Feed, and many more - directly from the stakeholders in the value chain.
The (20000+ strong) community has a big advantage. Each one of us are in touch with professionals from various domains. What we are asking here is to get in touch with a friend, friend of a friend, working with a developer or construction company. Ask for help, ask for data.Verify and cross-verify with 2 other sources before putting it up. And aren’t there many of us working in Real Estate, Construction domains, who can come forward to help - who may not have the data themselves, but can collate authentic data much faster from their professional contacts
We DO NOT require large sample data. We just require authentic data ![]() from different regions.
from different regions.
Cheers
@donald sir, my statement for a larger data sample was to account for the diversity and size of nation and the fact that AH is not a standard product like that of Astral, Kaveri and Avanti.
Costs vary with geography, but maybe the difference is not more than 10%, might be insignificant to the final sample.
Sourcing authentic data was never my intention to question, I was trying to steer the data collection more towards the relevant AH sector from MIG or HIG housing projects.
1 Like
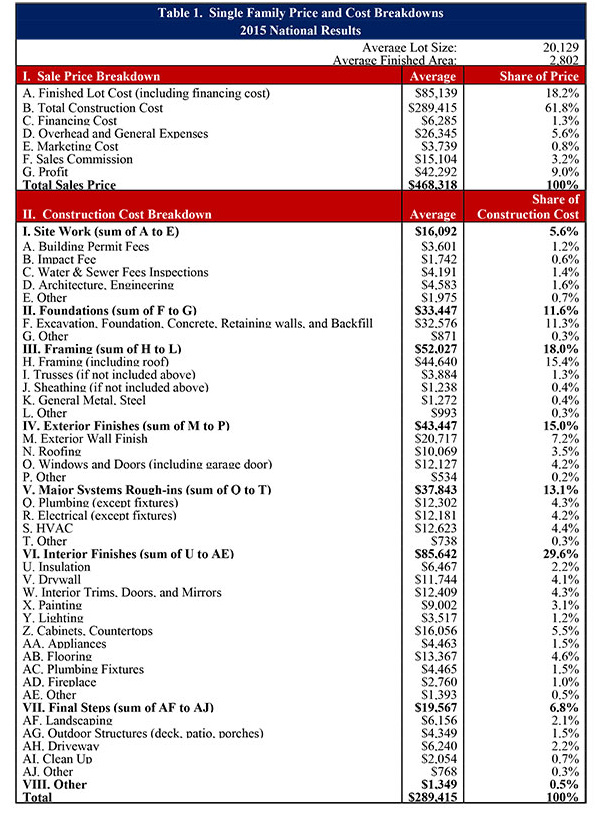
Below is the example of the share of general construction cost for an housing theme in US(HighEnd/Luxury). This info is taken from nahb.org (association for home builders based in US). Some of the construction elements will not apply for Indian Affordable Housing theme, since the cost looks exorbitantly high for this theme. However this may give an rough idea on the % of costs and the distribution elements
Experts in this field may give their opinion
Ambit capital research report on Building Materials.
2 Likes
how to download this report ?
Yes. Appreciate that. We should be collecting authentic data from Tier 2 and 3 Cities from different regions as well to take care that the data points are representative. As you mentioned, its about the average revenue and profit shares among categories, not so much the levels.
Some useful information / data may be available at below link
Kishor Barhate
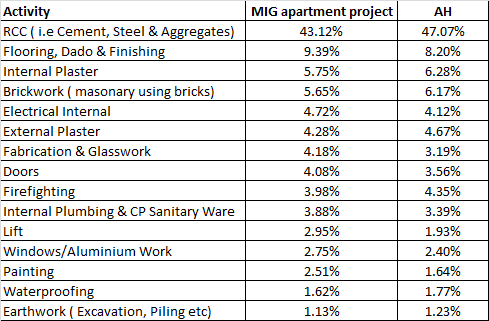
Here’s a useful snapshot - Construction cost across housing segments (Source:CLSA).
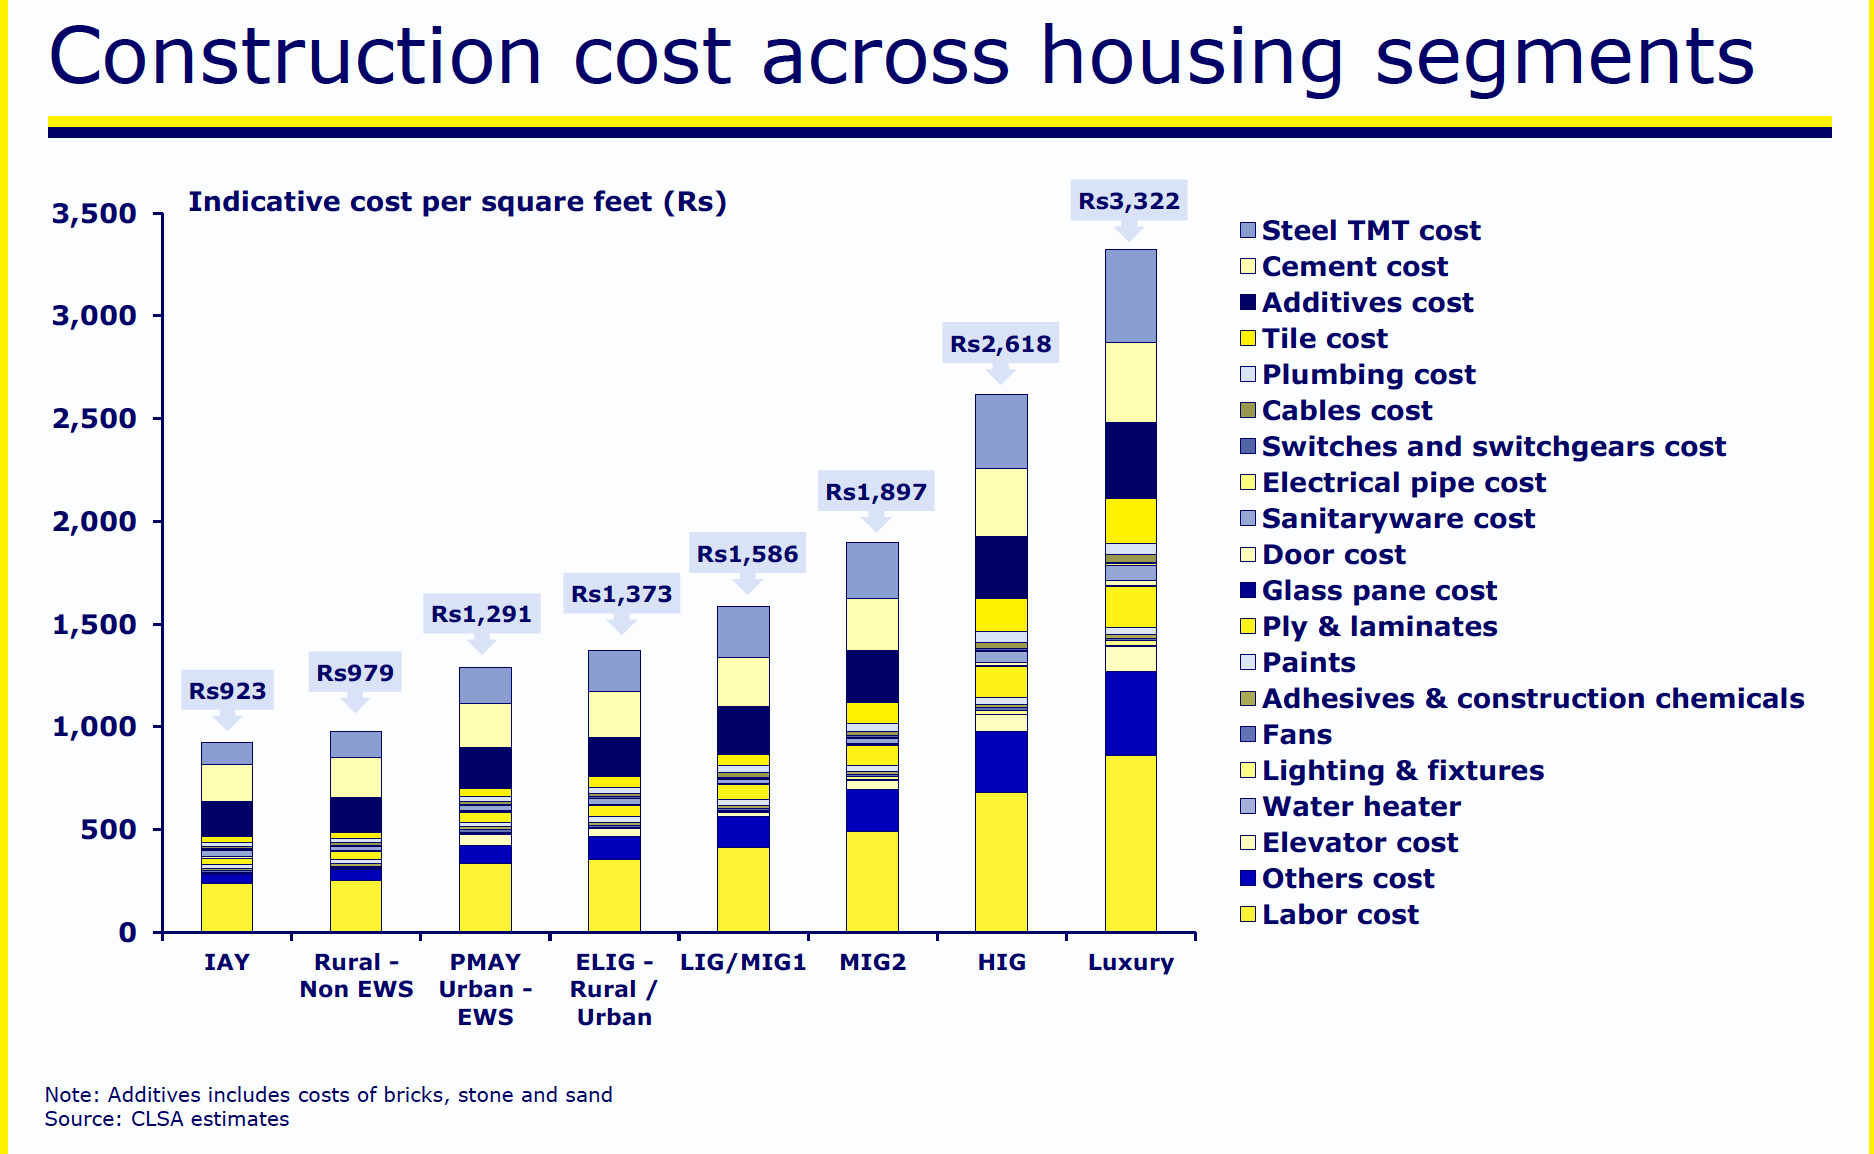
Looks reasonable to me. Perhaps folks like @bheeshma @bobbyusd and others working in RE/Construction domains can use this data as indicative - and give us the figures after cross-checking in industry
@Yogesh_s - this is what you are looking for?
8 Likes
Hi @Donald, yes this is good. This chart gives us item 6 in my list. This is the investible slice of the pie. Do we know what % of the total cost of a house is construction cost? My knowledge is limited to Mumbai and over here it’s not much. First 4 items in my list make up bulk of the cost.
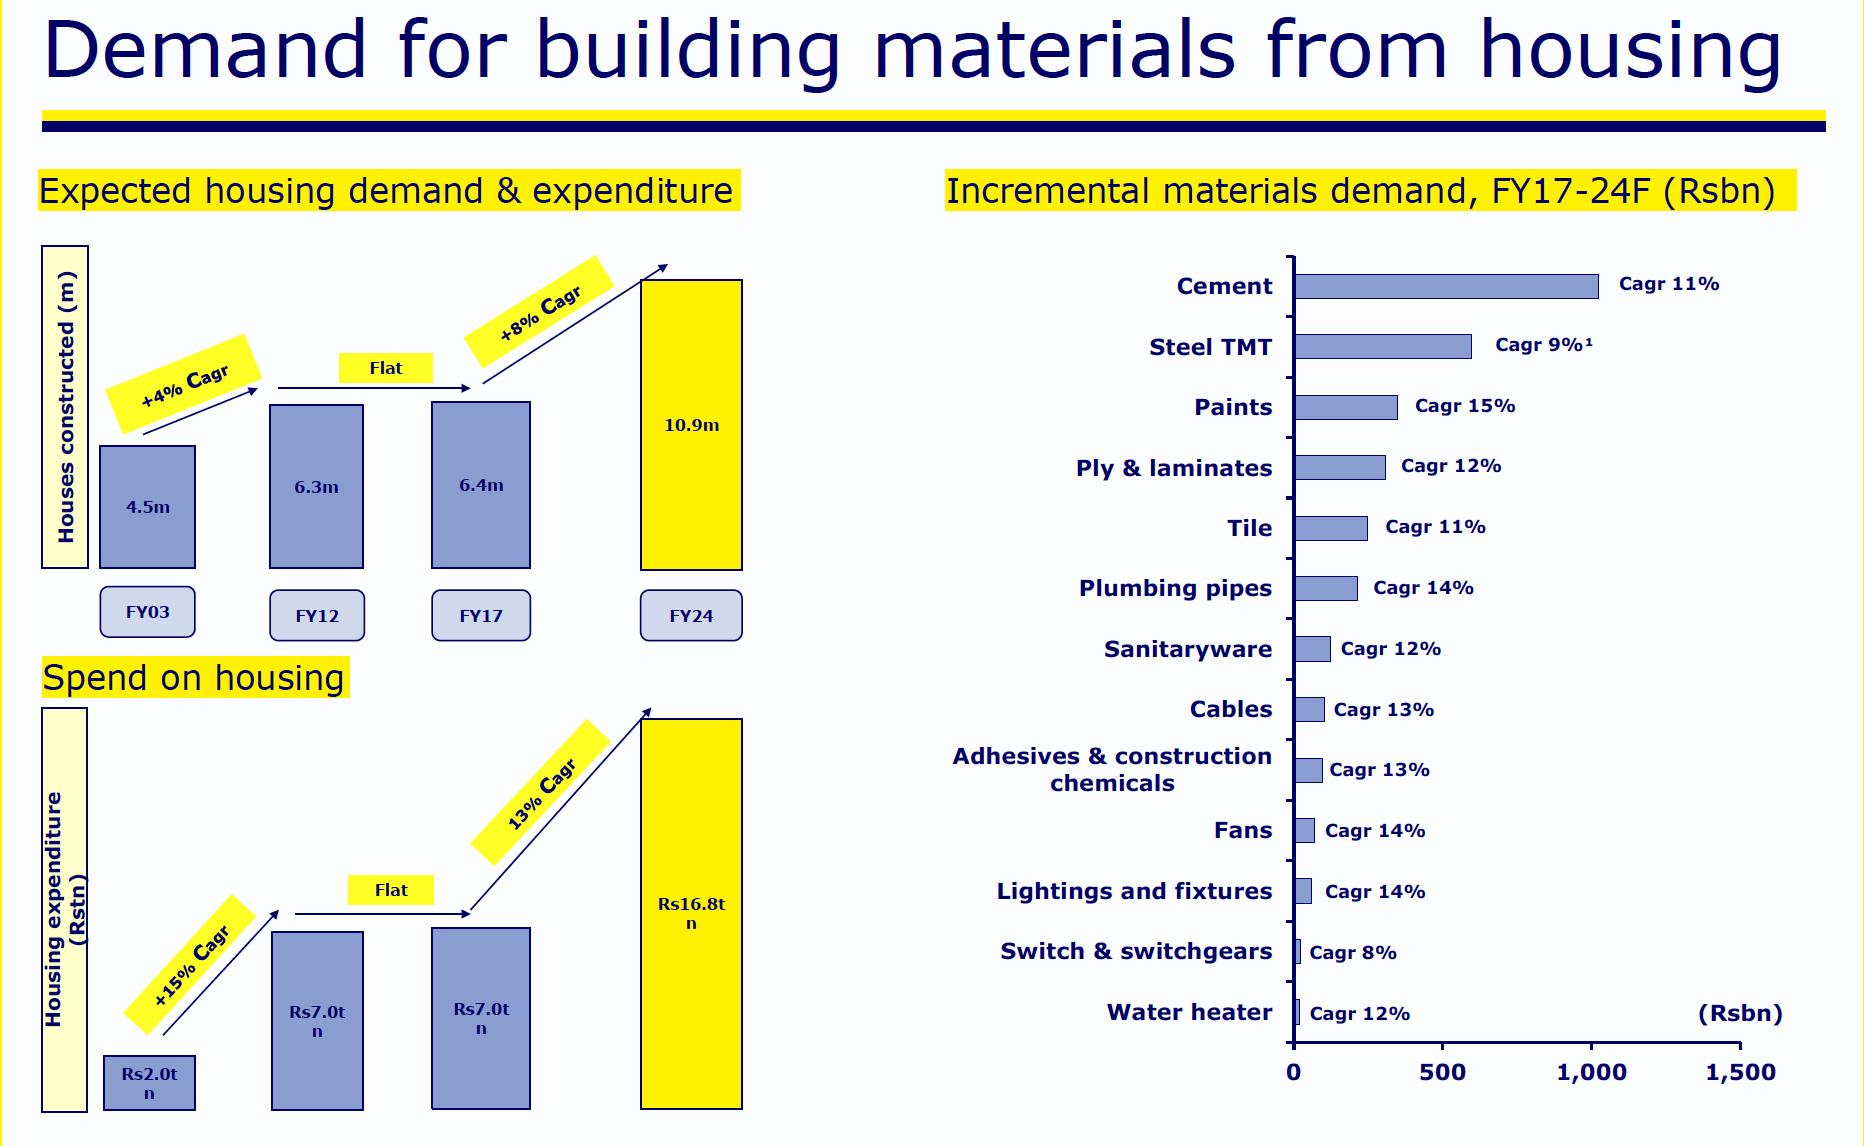
Second chart you have provided is actually very useful. Incremental demand especially the CAGR is the most useful piece of information. Your chart shows that paints, pipes and fans has the highest growth rates which sounds logical because the least an affordable house owner will do is to paint the house and install a fan. Switchgears have lowest growth rate as those are mainly used in mid to high end houses.
This chart does bulk of the work for us already. We now have to list out companies that provide these items and do a bottom-up analysis on the set.
3 Likes
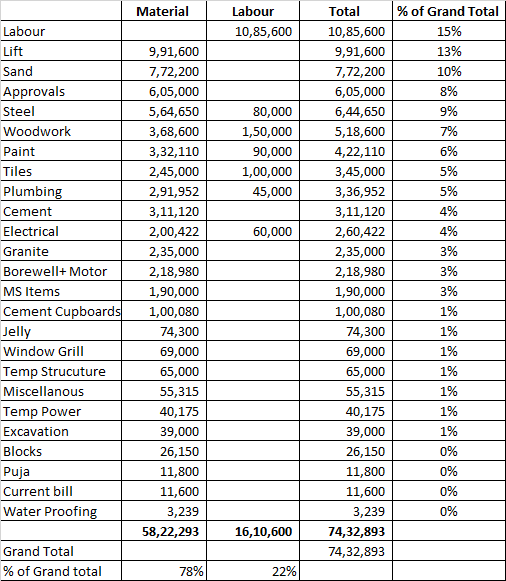
Here is the total cost break up of material and labour for G+ 3 house built in Bangalore. This excludes land cost.
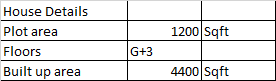 House Details
Plot area 1200 Sqft
Floors G+3
Built up area 4400 Sqft
Labour 10,85,600 10,85,600 15%
Lift 9,91,600 9,91,600 13%
Sand 7,72,200 7,72,200 10%
Approvals 6,05,000 6,05,000 8%
Steel 5,64,650 80,000 6,44,650 9%
Woodwork 3,68,600 1,50,000 5,18,600 7%
Paint 3,32,110 90,000 4,22,110 6%
Tiles 2,45,000 1,00,000 3,45,000 5%
Plumbing 2,91,952 45,000 3,36,952 5%
Cement 3,11,120 3,11,120 4%
Electrical 2,00,422 60,000 2,60,422 4%
Granite 2,35,000 2,35,000 3%
Borewell+ Motor 2,18,980 2,18,980 3%
MS Items 1,90,000 1,90,000 3%
Cement Cupboards 1,00,080 1,00,080 1%
Jelly 74,300 74,300 1%
Window Grill 69,000 69,000 1%
Temp Strucuture 65,000 65,000 1%
Miscellanous 55,315 55,315 1%
Temp Power 40,175 40,175 1%
Excavation 39,000 39,000 1%
Blocks 26,150 26,150 0%
Puja 11,800 11,800 0%
Current bill 11,600 11,600 0%
Water Proofing 3,239 3,239 0%
58,22,293 16,10,600 74,32,893
Grand Total 74,32,893
% of Grand total 78% 22%
I had experience in working from Contractor side and this labour to material ratio significantly changes if we are looking at large scale apartments. Labor + services cost will go up to 40-50% for buildings like G+30 with multiple towers in same location.
Hope this info will be of some use. Pls let me know if you need any further info.
12 Likes
Hi @Donald
Something doesnt look ok to me in this chart. I am unsure why construction costs vary so much across different segments. A 10 floor building with 4 units per floor should by and large have similar construction costs with a +20-40% variation for higher quality branded materials used ( excluding cement /steel).
In fact , for low cost housing where the standard is 10 dwelling units per floor, the construction cost is higher with more labour, cement , steel, plumbing, wiring etc required due to more walls being constructed. Luxury housing/HIG housing in fact has lower construction costs.
Things like Plumbing, Switches, Sanitaryware, Doors, Glass panes, Water heater , Lighting , Elevator cannot be expressed on a per sqft basis as well. They need to be expressed on a dwelling unit basis i.e How many water heaters for x dwelling units
I will try and come back with my estimates
Thanks
Bheeshma
2 Likes
If you are constructing real estate in a place like Mumbai, then it is worth thinking about the cost of approvals/regulatory and other costs. This component forms a significant chunk of total cost of development! CLSA charts do not have them. Let me elaborate:
- Fungible Premium - Fungible are is 35% in addition to built up area which a plot if eligible for. I know for a fact that fungible premium is not so cheap.
- Development Cess - based on some formula involving RR
- Development Charges - also based on some formula involving RR
- LUC or Land Under Construction Tax
- Labour Welfare Cess - Based on RR and your total built up and fungible area
- CFO Capitation Fee - Based on plot area
- Staircase, open space deficiency premiums - Based on design on the building
- Scrutiny fee - It is Municipality’s job to scrutinize building plans, but they do charge you a fee on this one.
- Estate transfer fee and Estate ground rent - If land is leasehold and not freehold, then this is applicable
Now let us look at some other costs:
- Rent - In case of redevelopment, existing tenants need to be given rent till the time construction happens
- Corpus - Sale building constructions charge this to buyer, but in case of redevelopment, builder has to provide corpus fund to the old tenants who will come back once construction is done. A cost none the less.
- If project is a redevelopment, then cost of tenants building/flats will have to be recovered from the sale area, which again effectively adds cost to the saleable component, if you see what I mean.
And finally another big one:
Interest! Banks need to earn some dough too. Though this interest cost will be low due to infra status to affordable housing, it still is a big cost. No builder will put 100% equity, 60-70% will be financed/leveraged. RERA will stretch this cost even higher because 70% of sale proceeds are locked in for a certain time period.
I may as well squeeze one more:
Cost of Corruption - I am not even going to start discussing the cost of corruption, but I know that it is a fixed per sq feet rate that officers in the administrative bodies expect as a bare minimum. Add that to the cost as well.
So adding all these costs, you can see how challenging it will be to hit satisfyingly low price points for those affordable homes. That is one answer I cannot find either. The city and state government bodies depend on these fees and premiums for their revenue. Any comments?
5 Likes
Here are my estimates expressed as a % of construction cost per sqft of saleable area. The construction cost psf varies in different geographies. In gujarat, for example where the building materials industry is centered construction costs are lower but its not a dramatic difference. In my view, the average construction cost is Rs 2000 psf, in AH its about 1700 psf and for higher end projects it varies from 2000 psf to 2700 psf.
The actual construction cost ex-contractor margin ( only labour + material ) is 20% lower. Labour is generally 30% so roughly about 60% of the construction cost is pure material cost. So if the construction cost is Rs 2000 psf , 60% of this i.e Rs 1200 psf is material only. The % given below should be interpreted based on this.
Roughly 40-45% of the material cost is RCC. In my view, RCC is about Rs 500 - 600 psf. RCC is the non-negotiable part of the building cost. You require x amount of cement, steel etc regardless of AH or luxury and when the structural stress on the floors is going to be higher - in the case of AH there are going to be more apts per floor and more walls - so structurally the building has to be capable of withstanding more structural load - so the RCC cost will be higher.
One can skimp on the Doors, windows, paint etc. In any case, the variation in construction cost for AH is not dramatically different than a regular building.
Best
Bheeshma
12 Likes
From the thesis a good AMT of revenue should flow into the cement industry… From this thesis I was looking @ cement companies with good spare capacities.I came upon India cements ,I couldn’t find any consolation from the recent results.maybe once the projects really take off,there could be a difference.PMAY is yet to be launched in rural areas.it may be launched atleast by d end of next year …elections r coming up by 2019,so leaving out rural areas can’t be a good idea…
Great news for affordable housing, carpet area of MIG 1 (annual income upto 12 lakhs) and MIG 2 ( annual income upto 18 lakhs) raised to 120 and 150 sqm respectively. The govt has earlier itself removed the carpet area limit for EWG/LIG beneficiaries.