
Graphs can be very powerful, so much so that it can describe the entire story behind one’s investing decisions.
In my excel based valuation tool, I have a lot of pre-built graphs and many a times, just by looking at the graphs, I decide not to proceed further (not the other way round though ![]() )
)
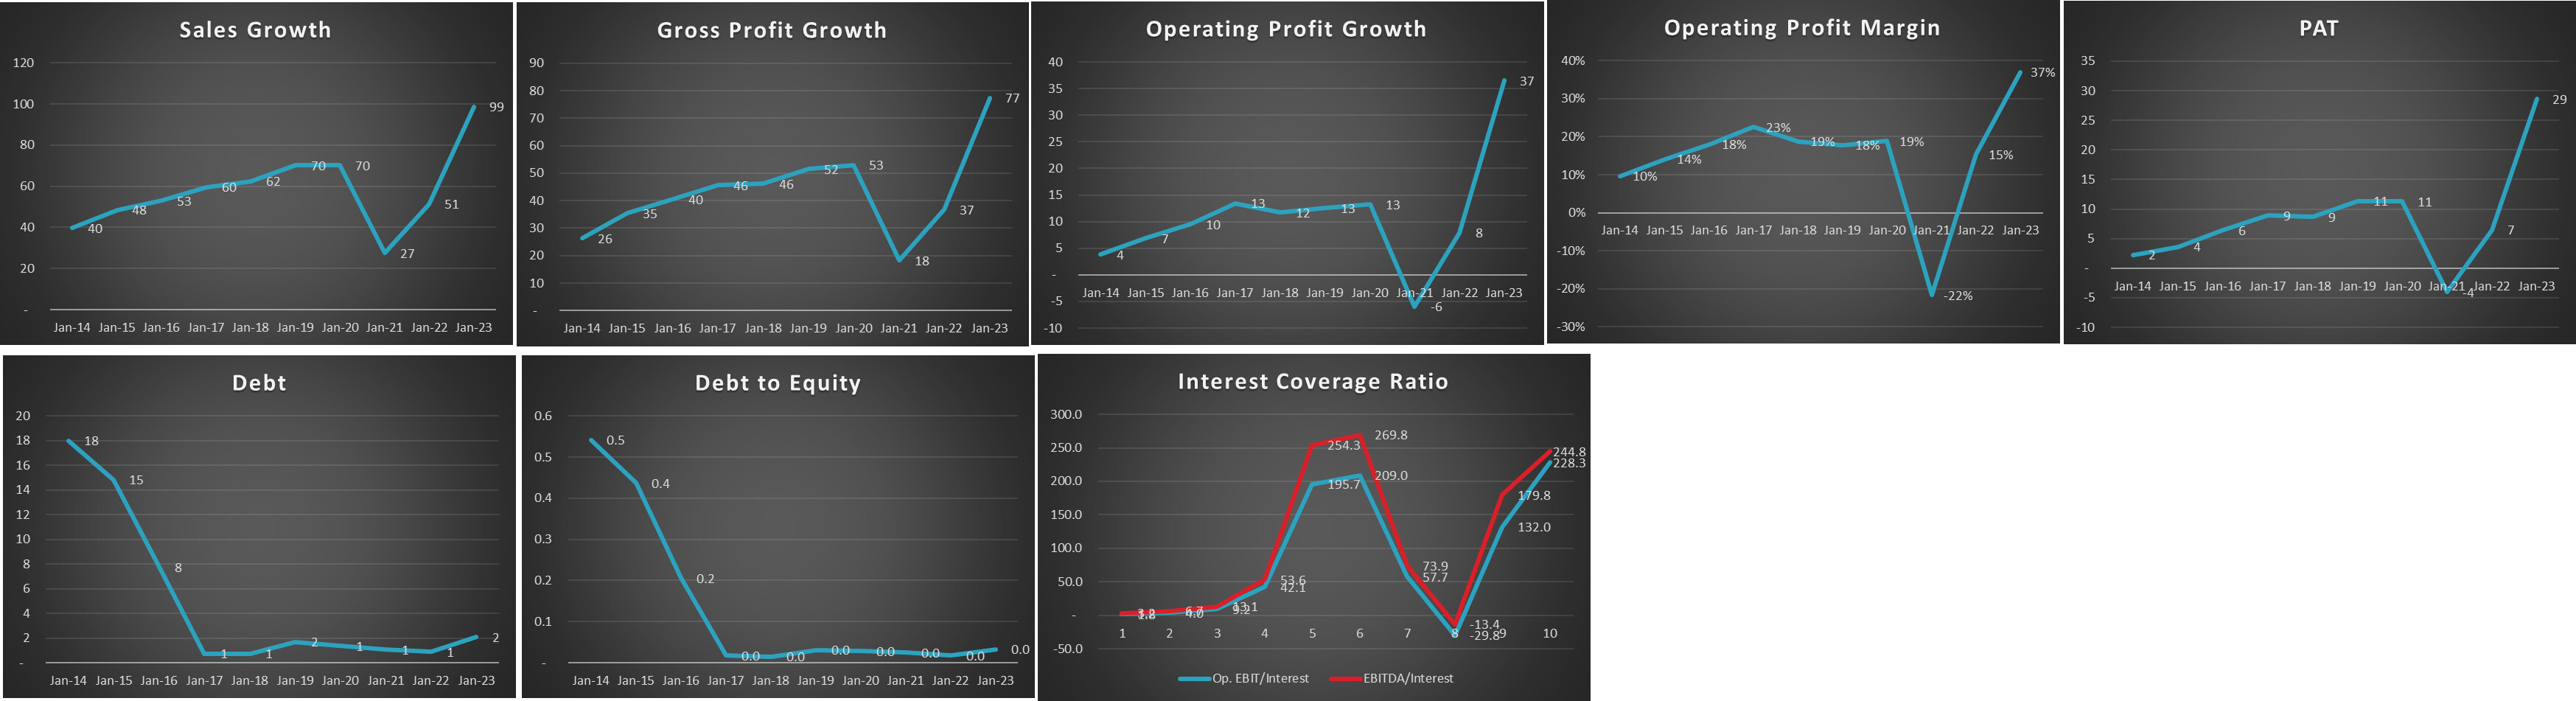
Here are some of the graphs that I have in my excel tool (this is for Advani Hotels and Resorts):
- Business performance
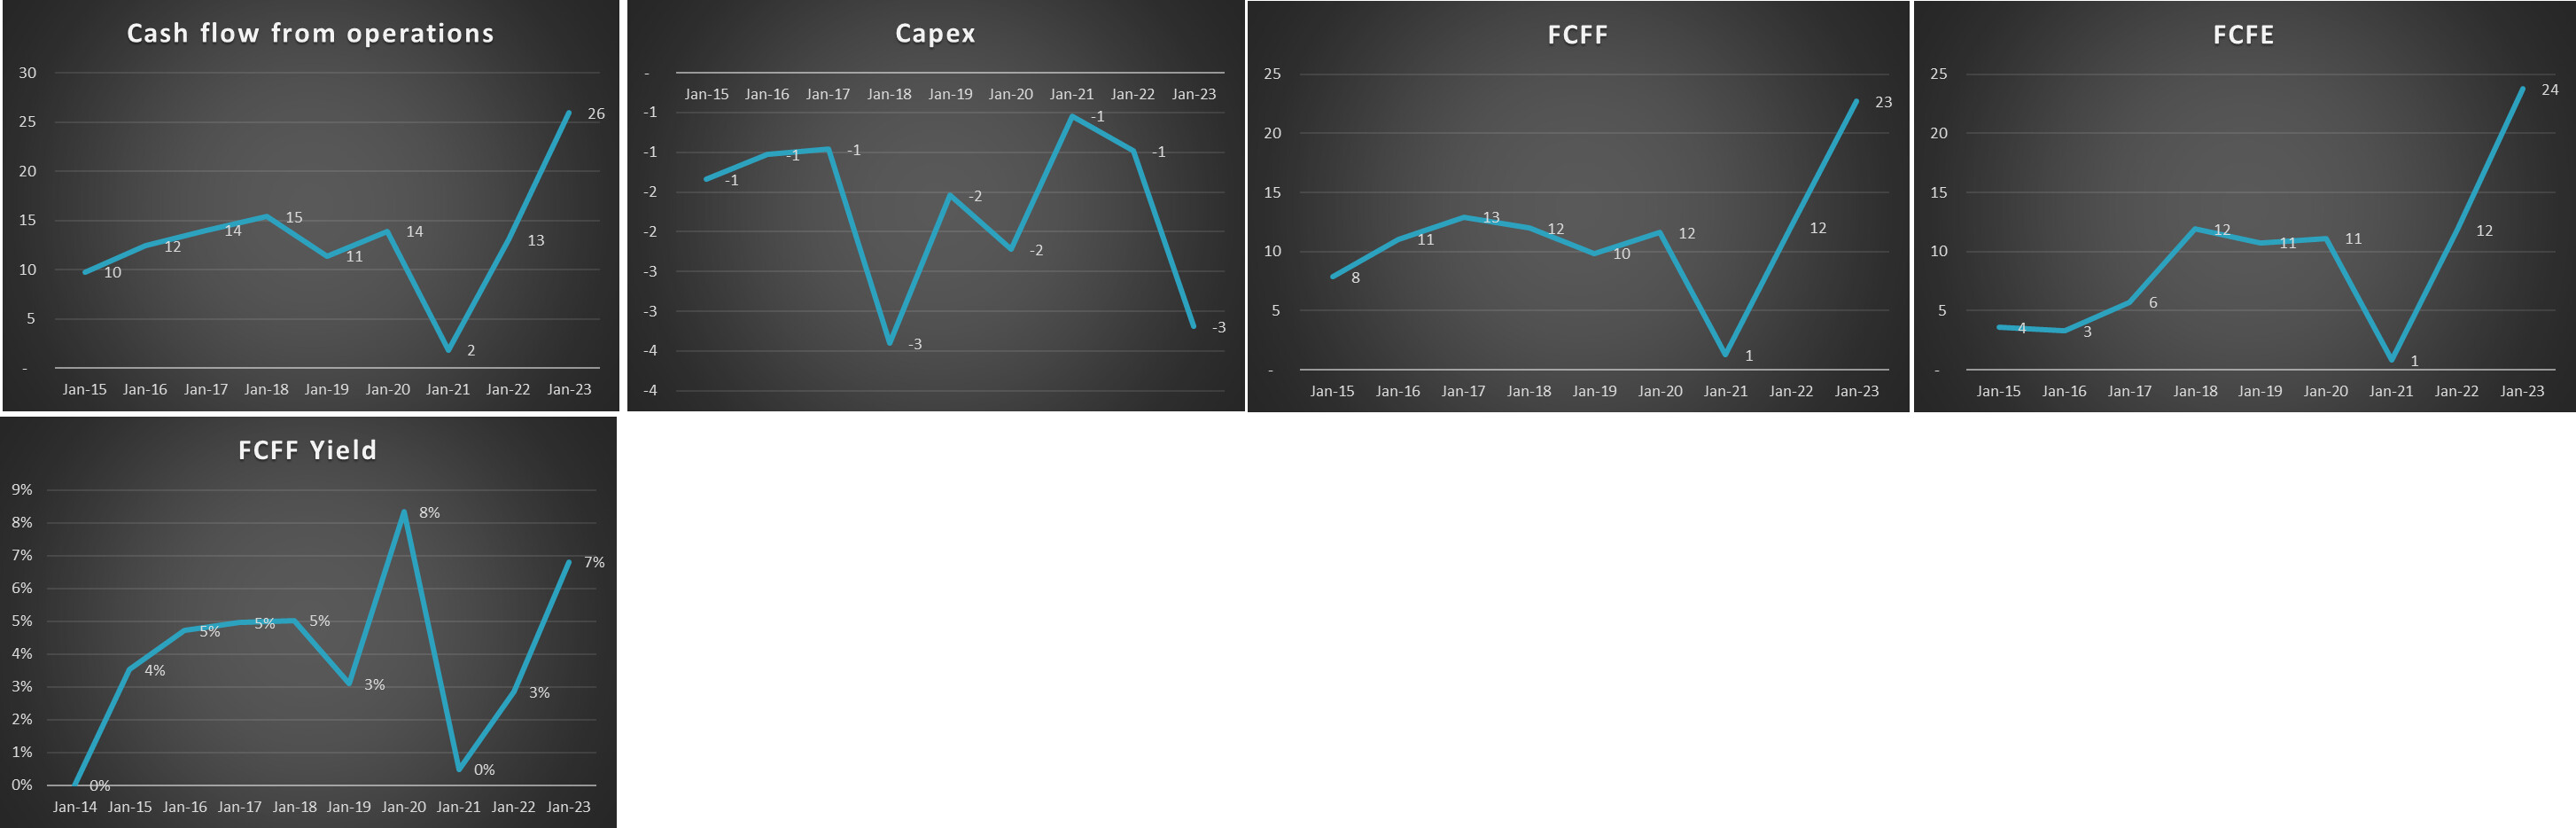
- Cash flow situation
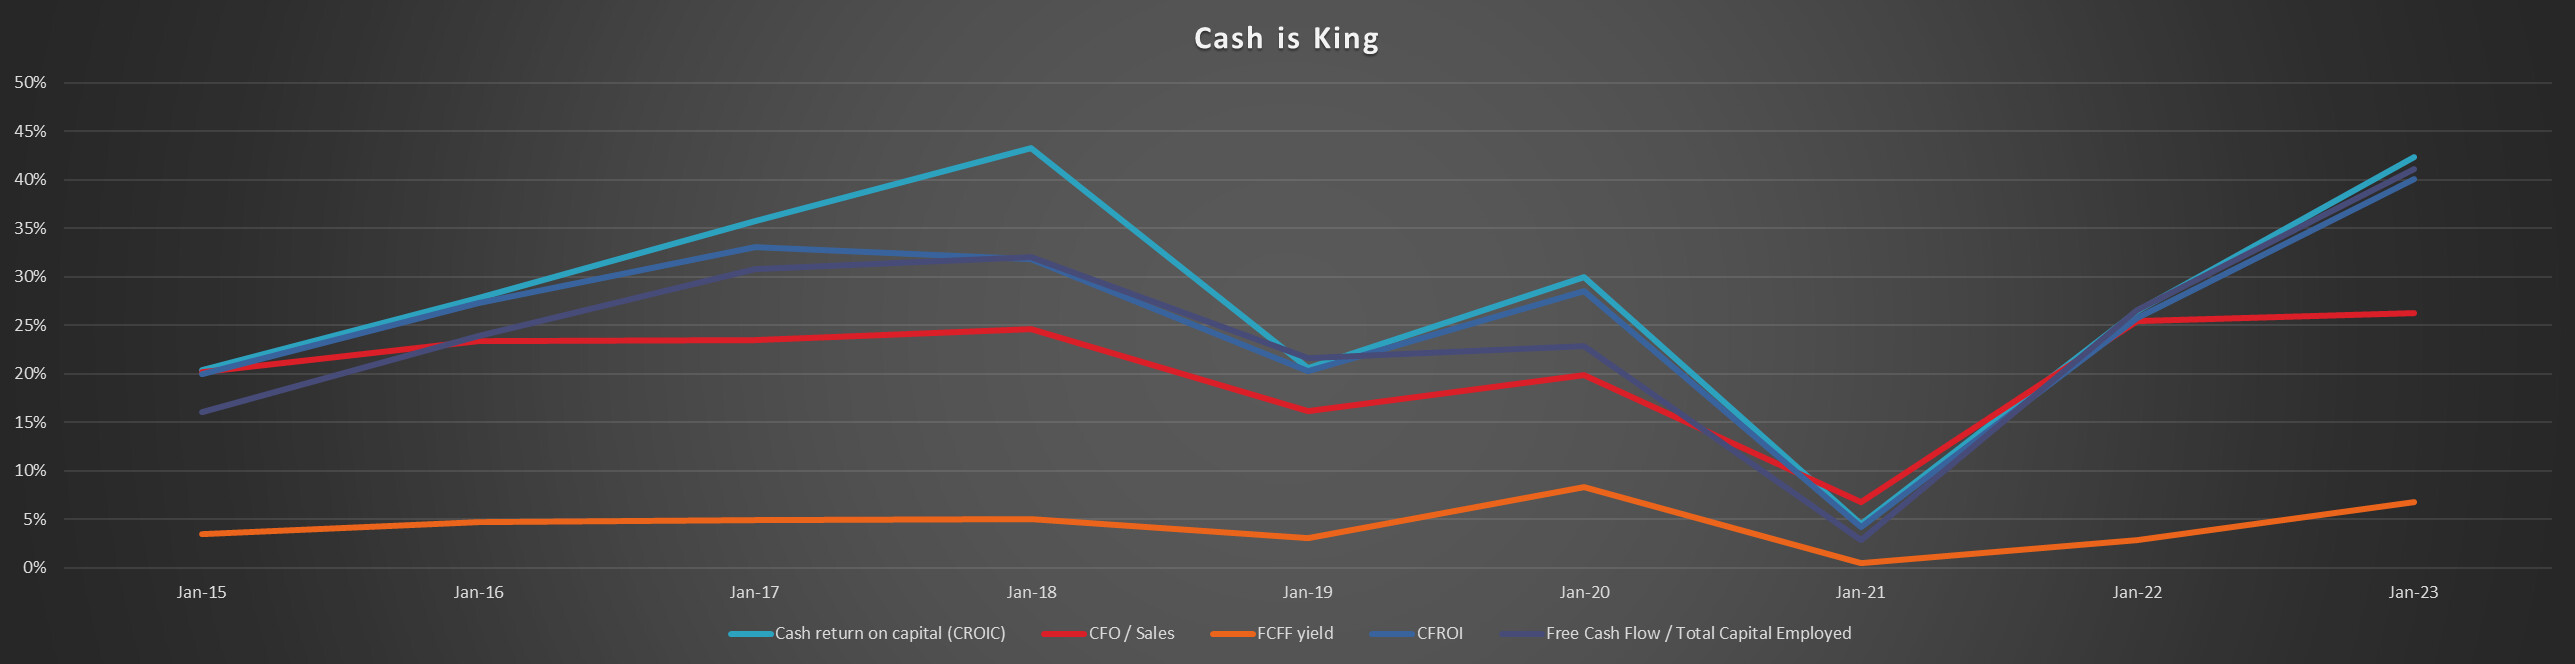
- Cash flow ratios
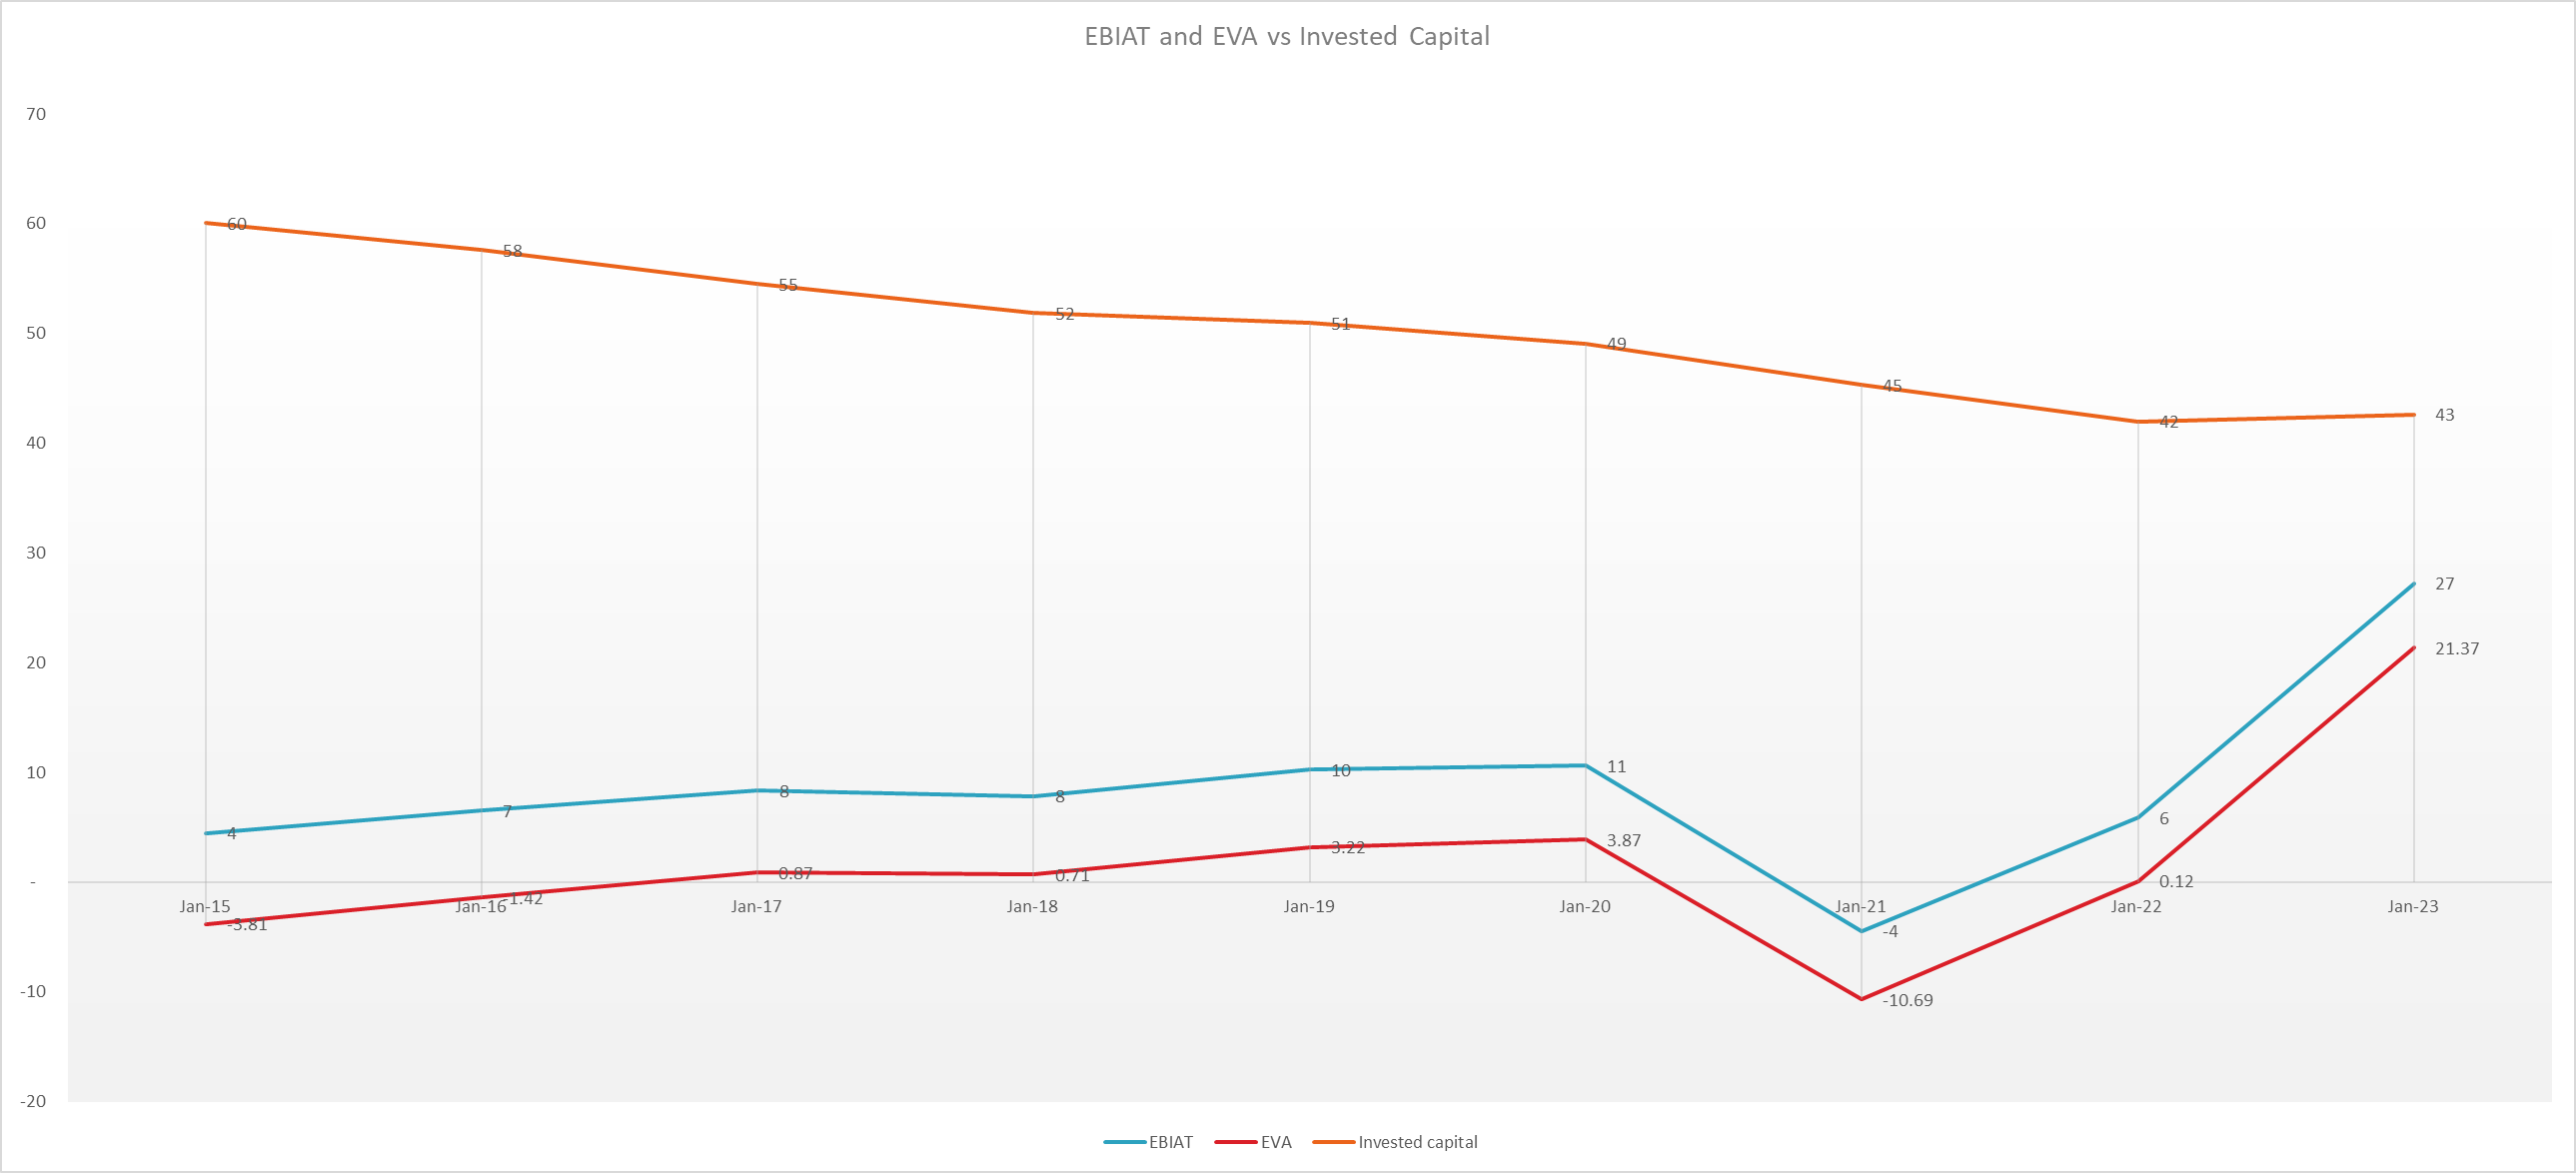
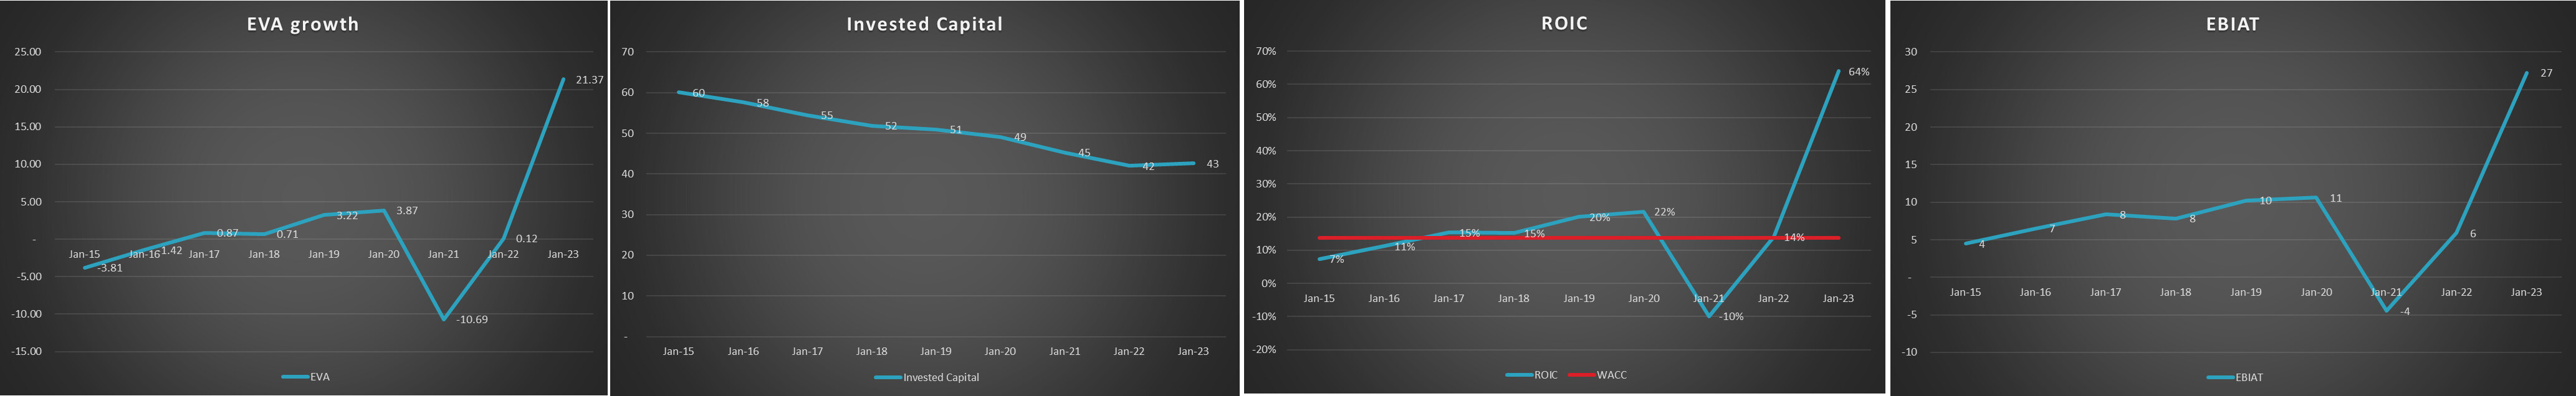
- EBIAT, Invested Capital and EVA
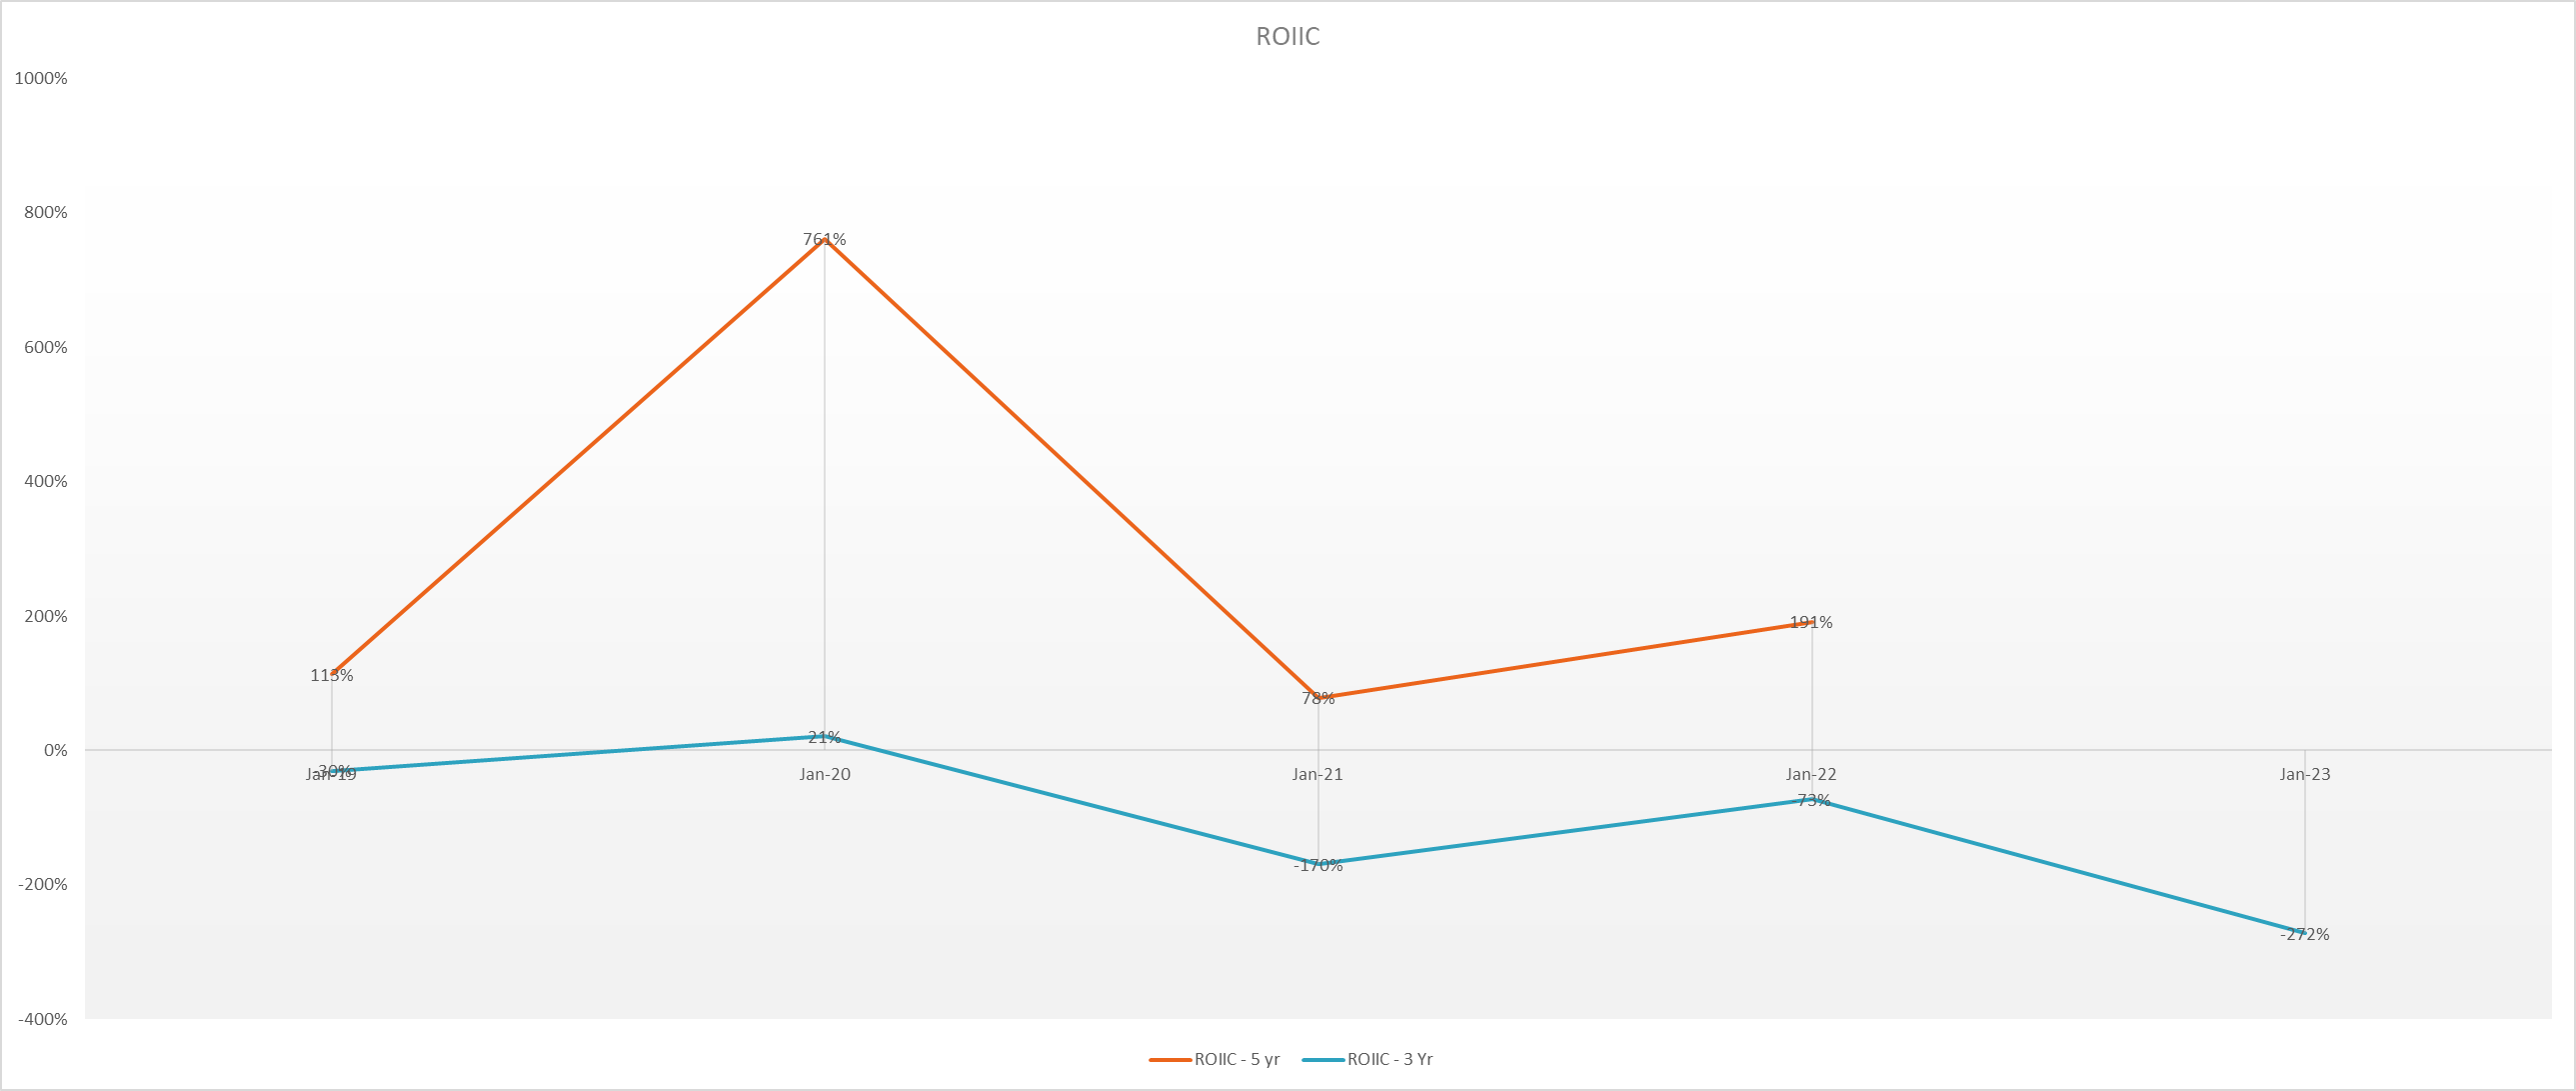
- ROIIC - 3 and 5 years CAGR performance
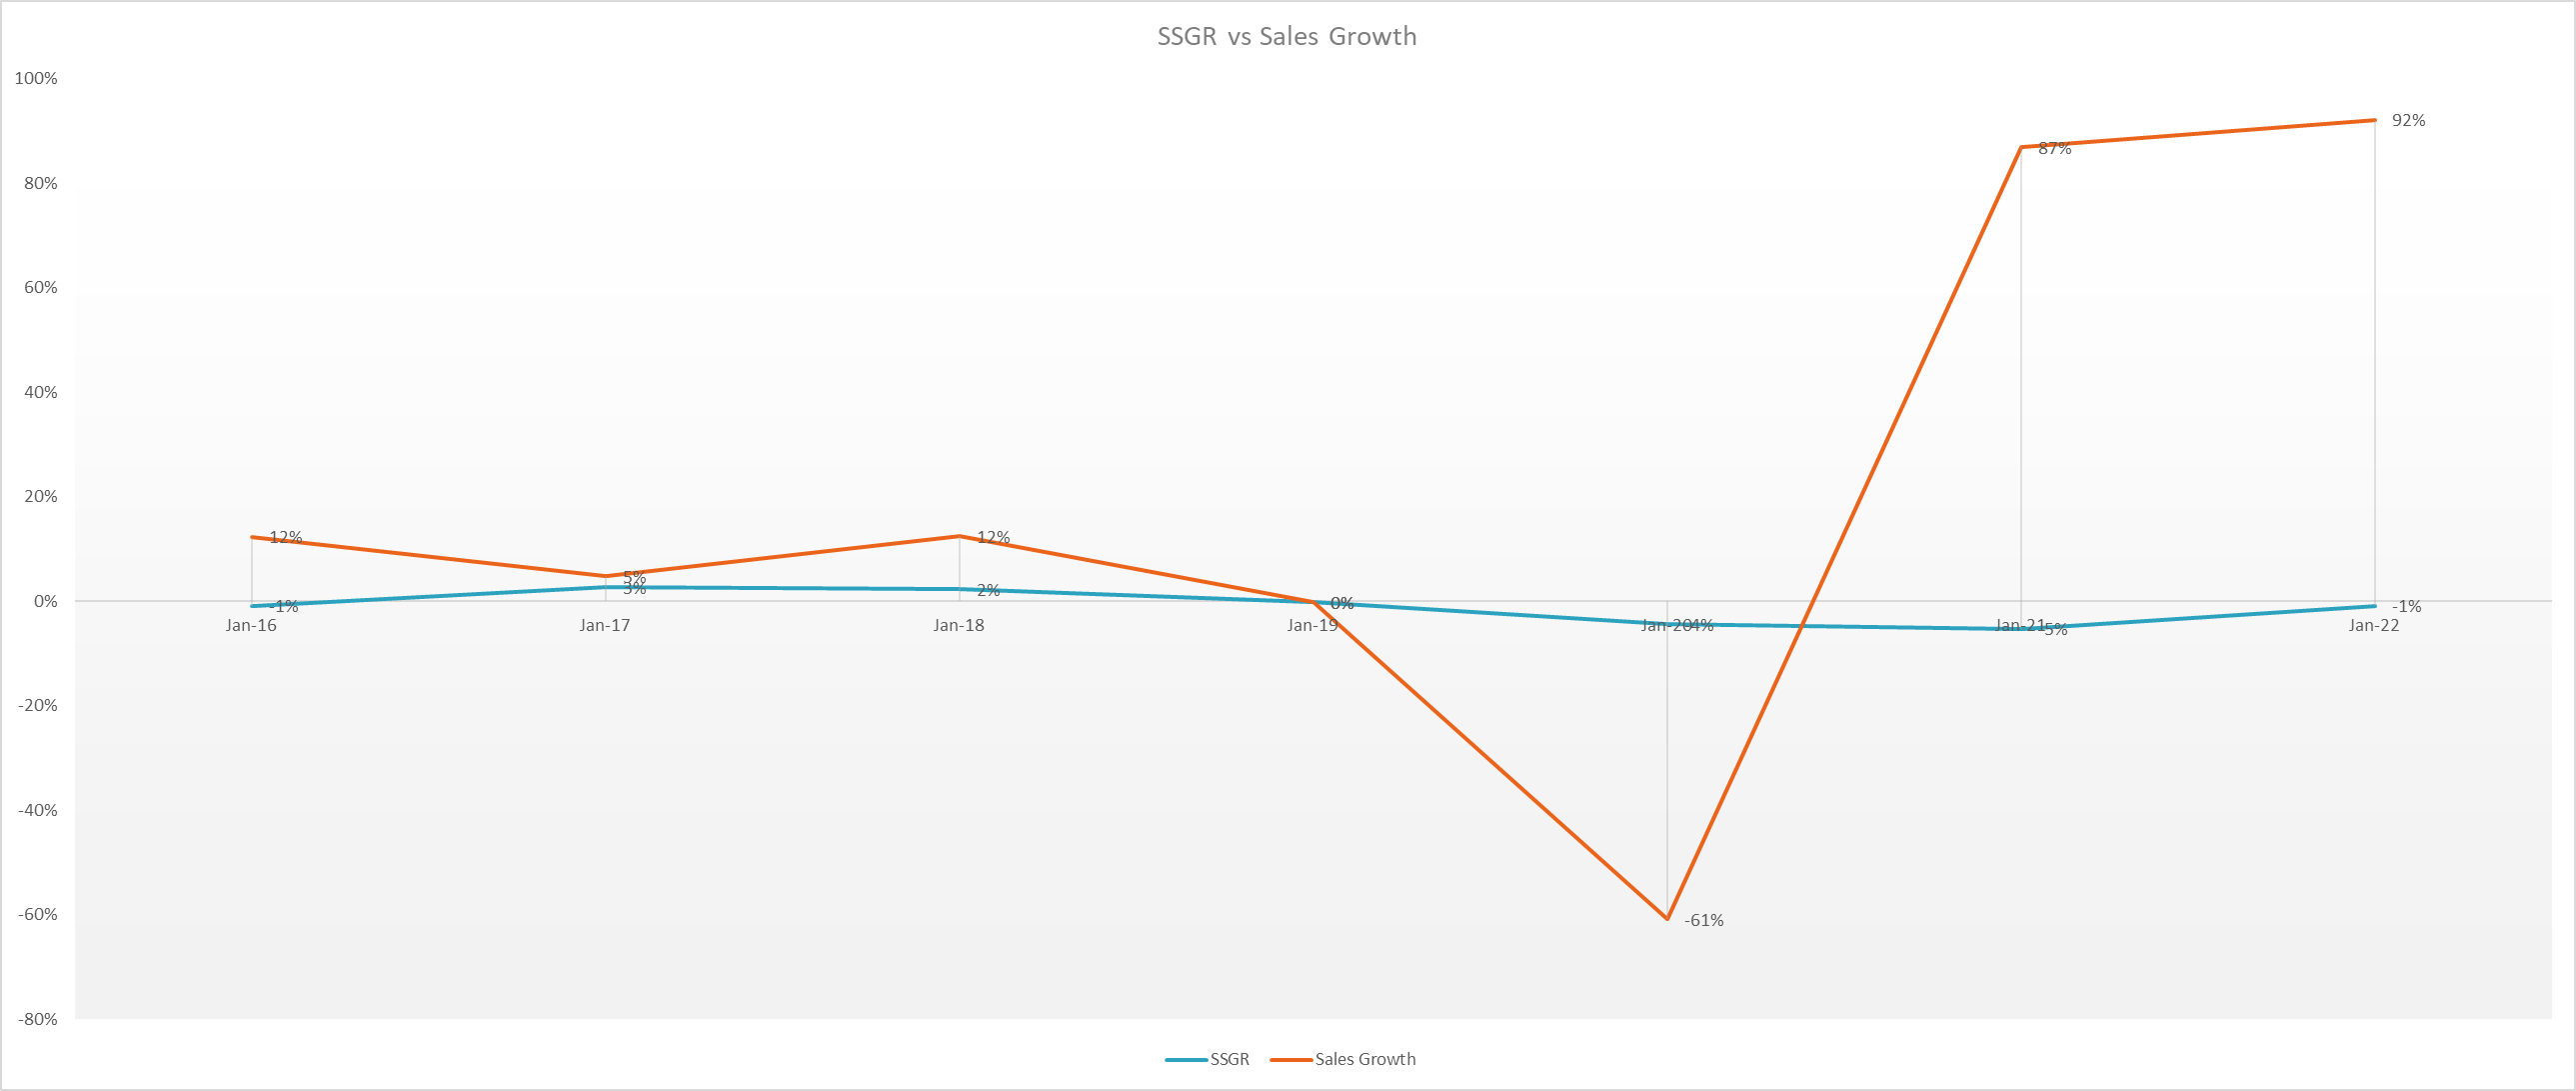
- SSGR vs sales growth
- EVA factors
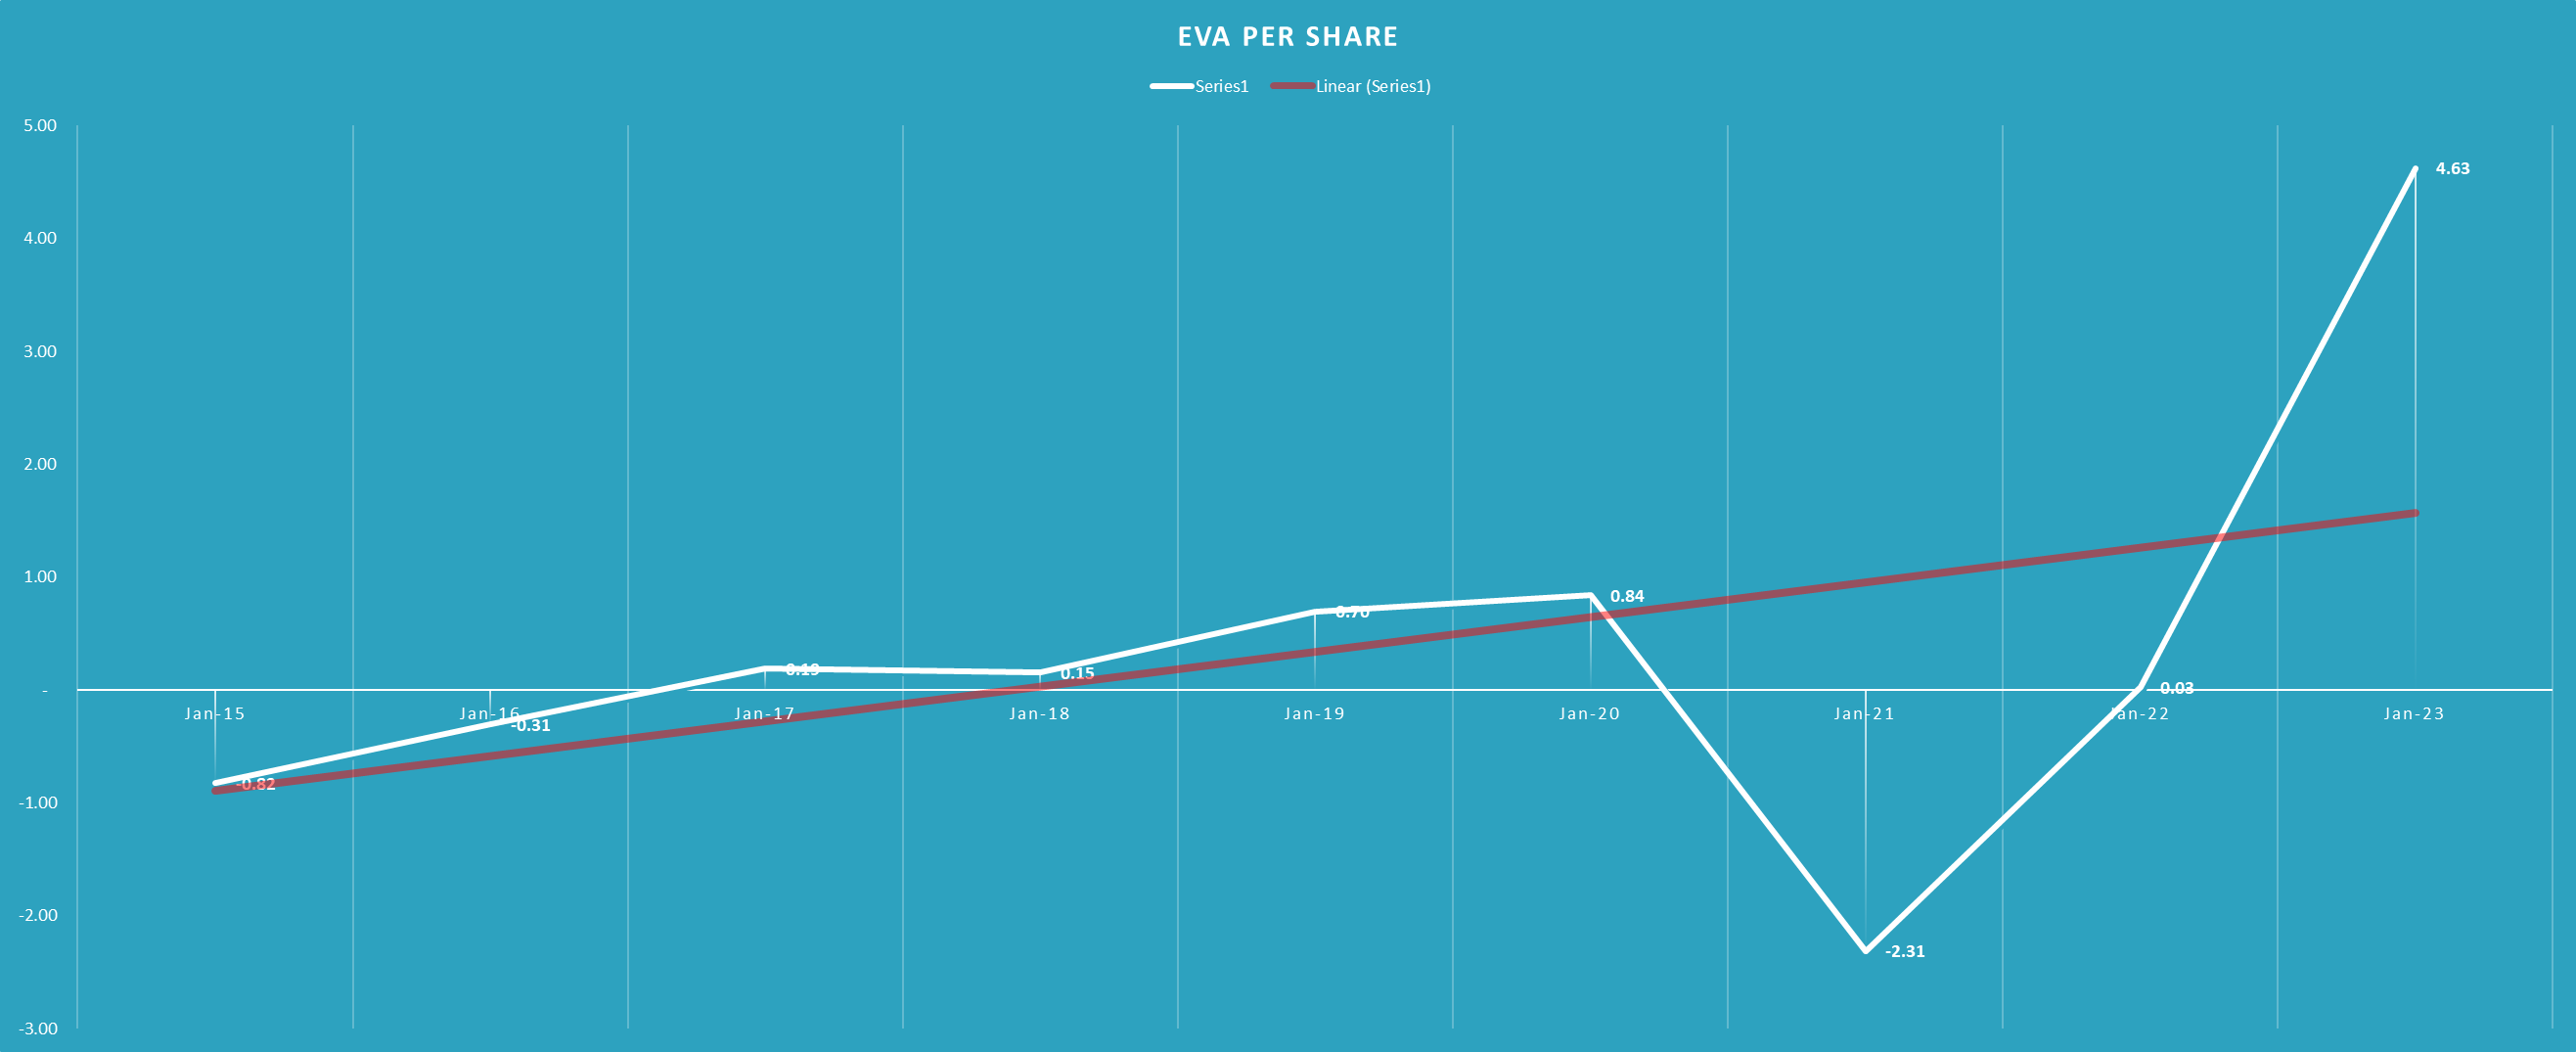
- EVA per share
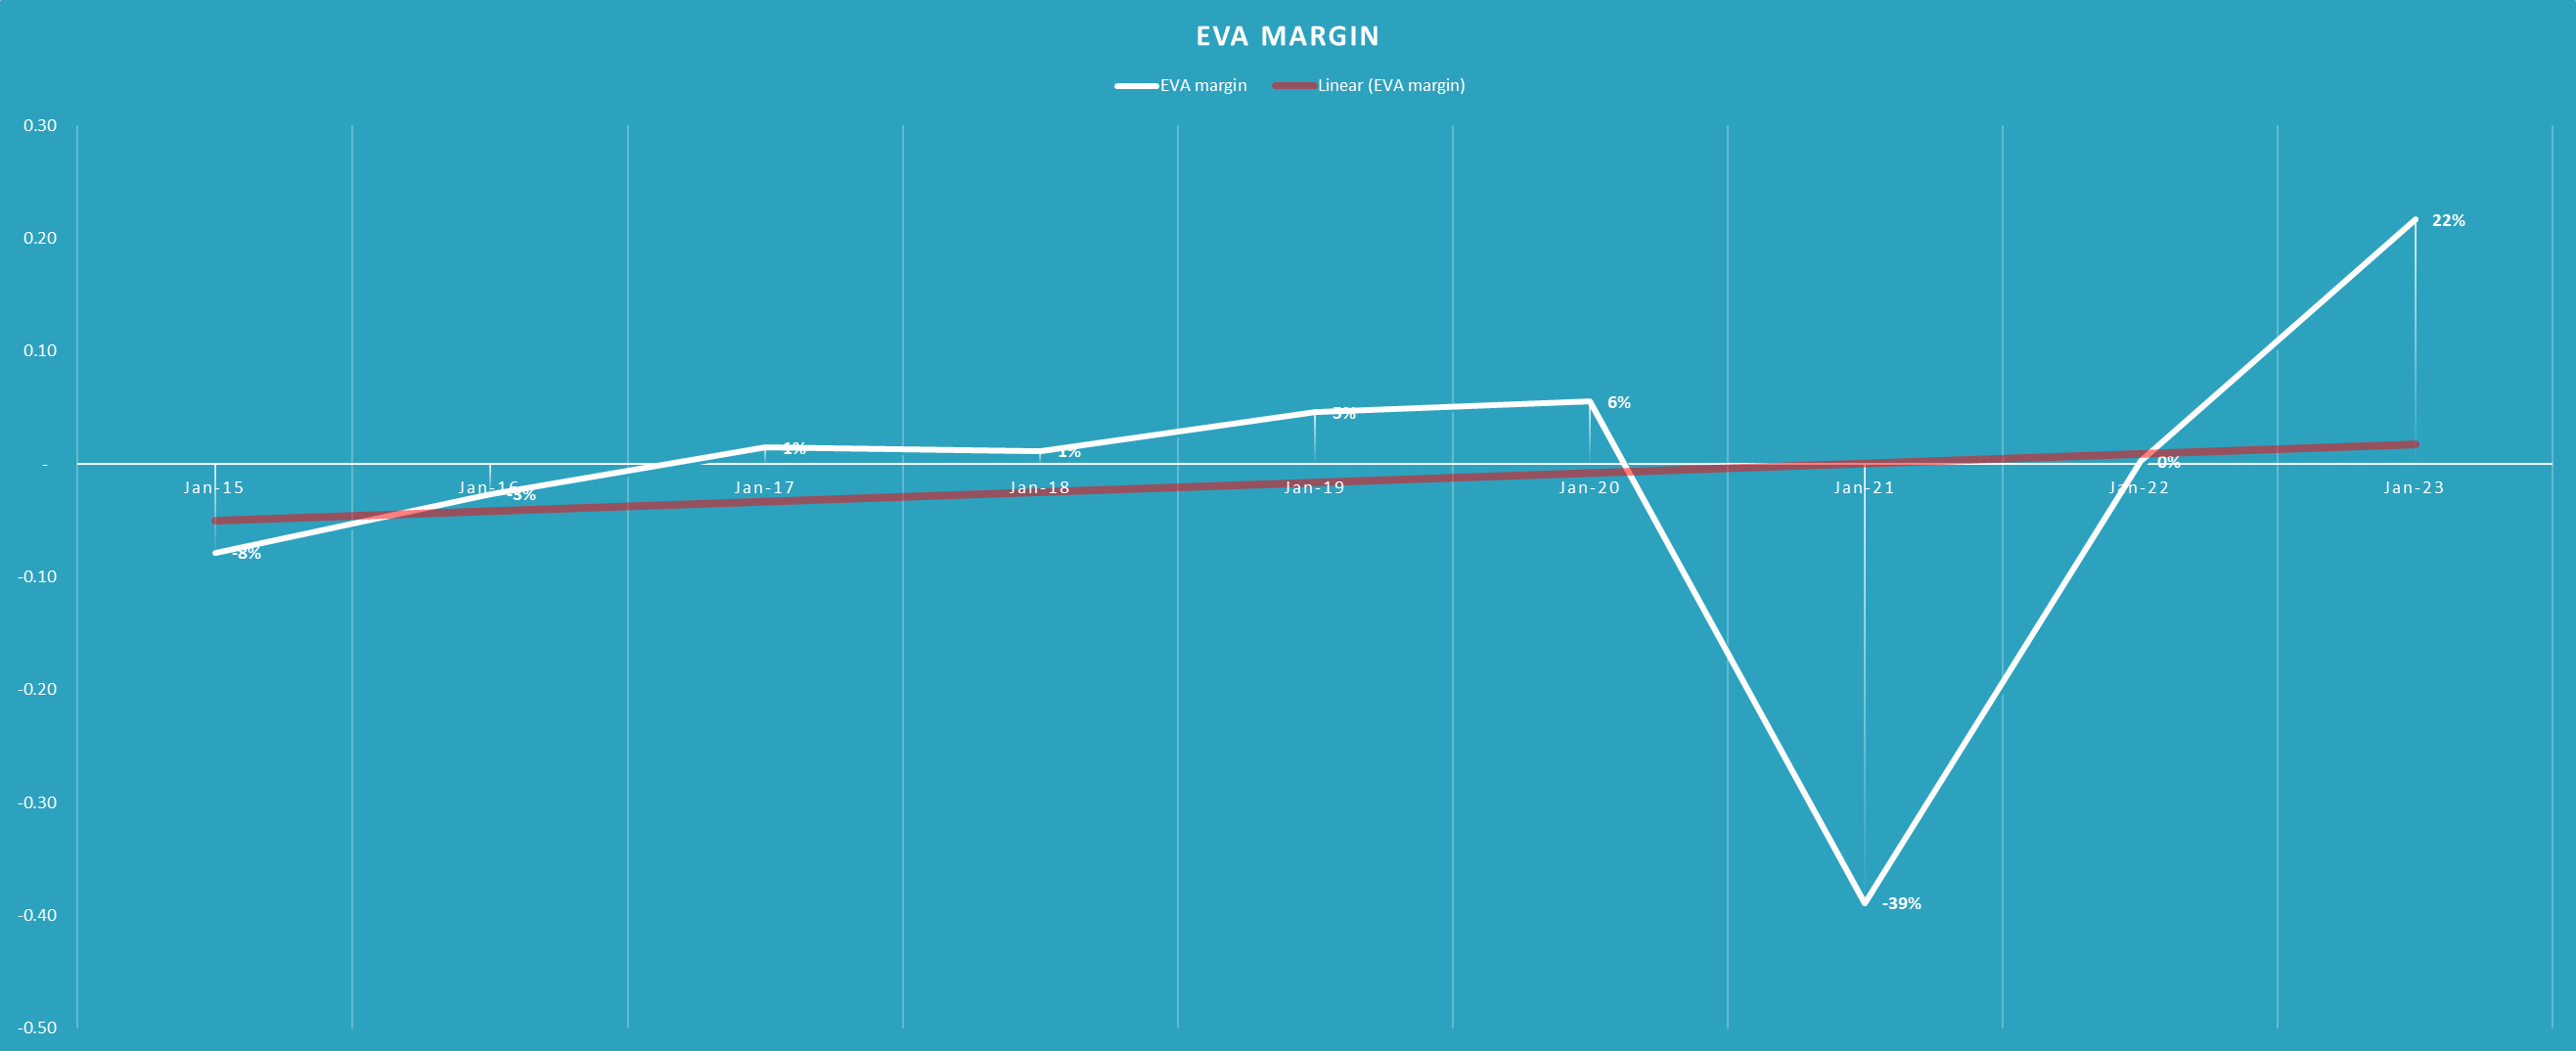
- EVA margin
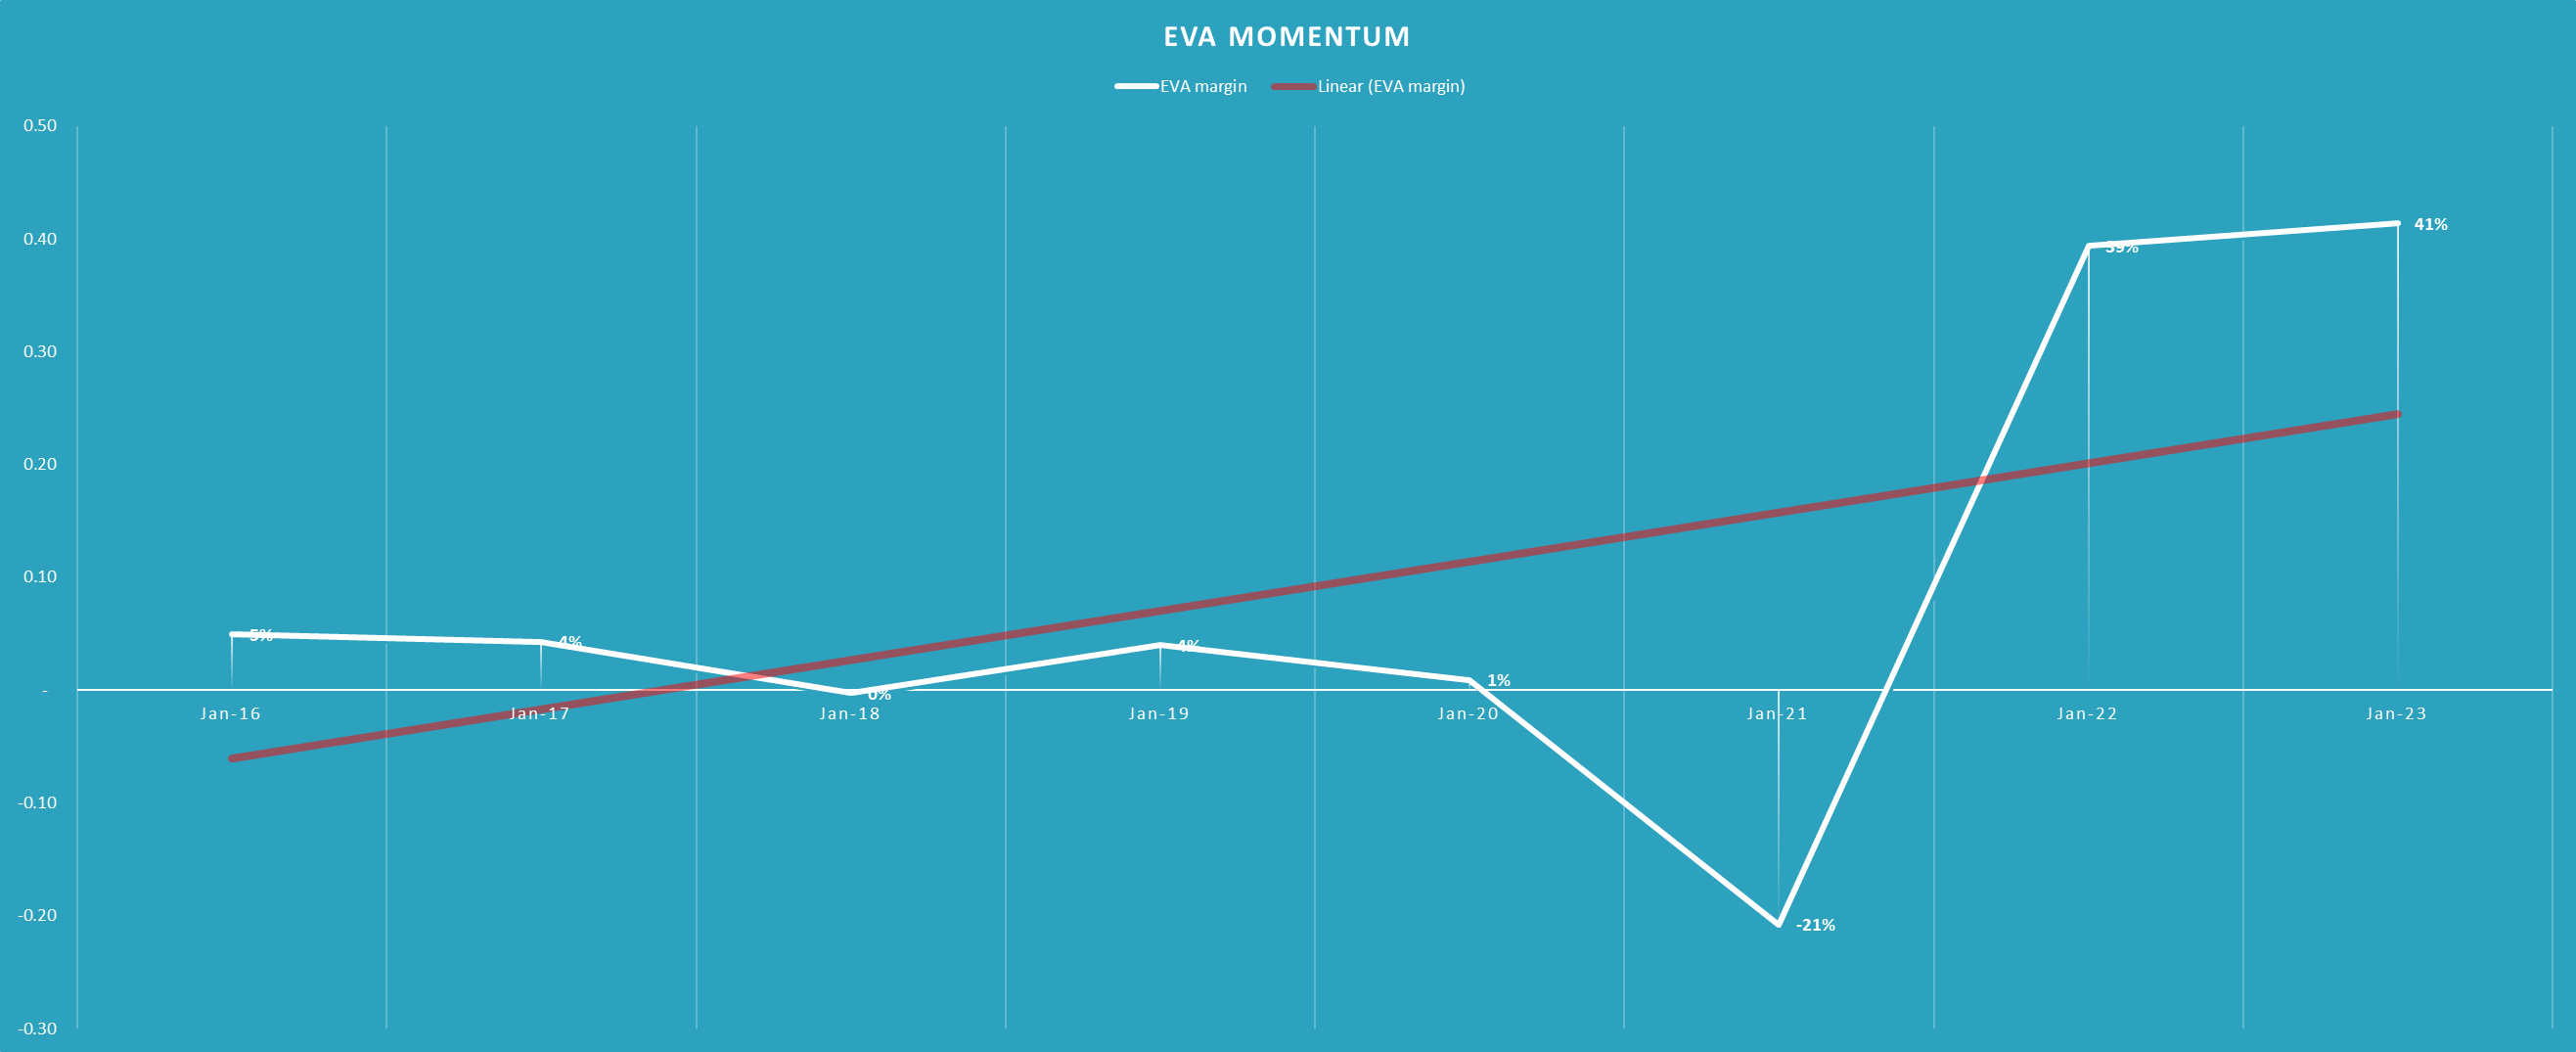
- EVA momentum
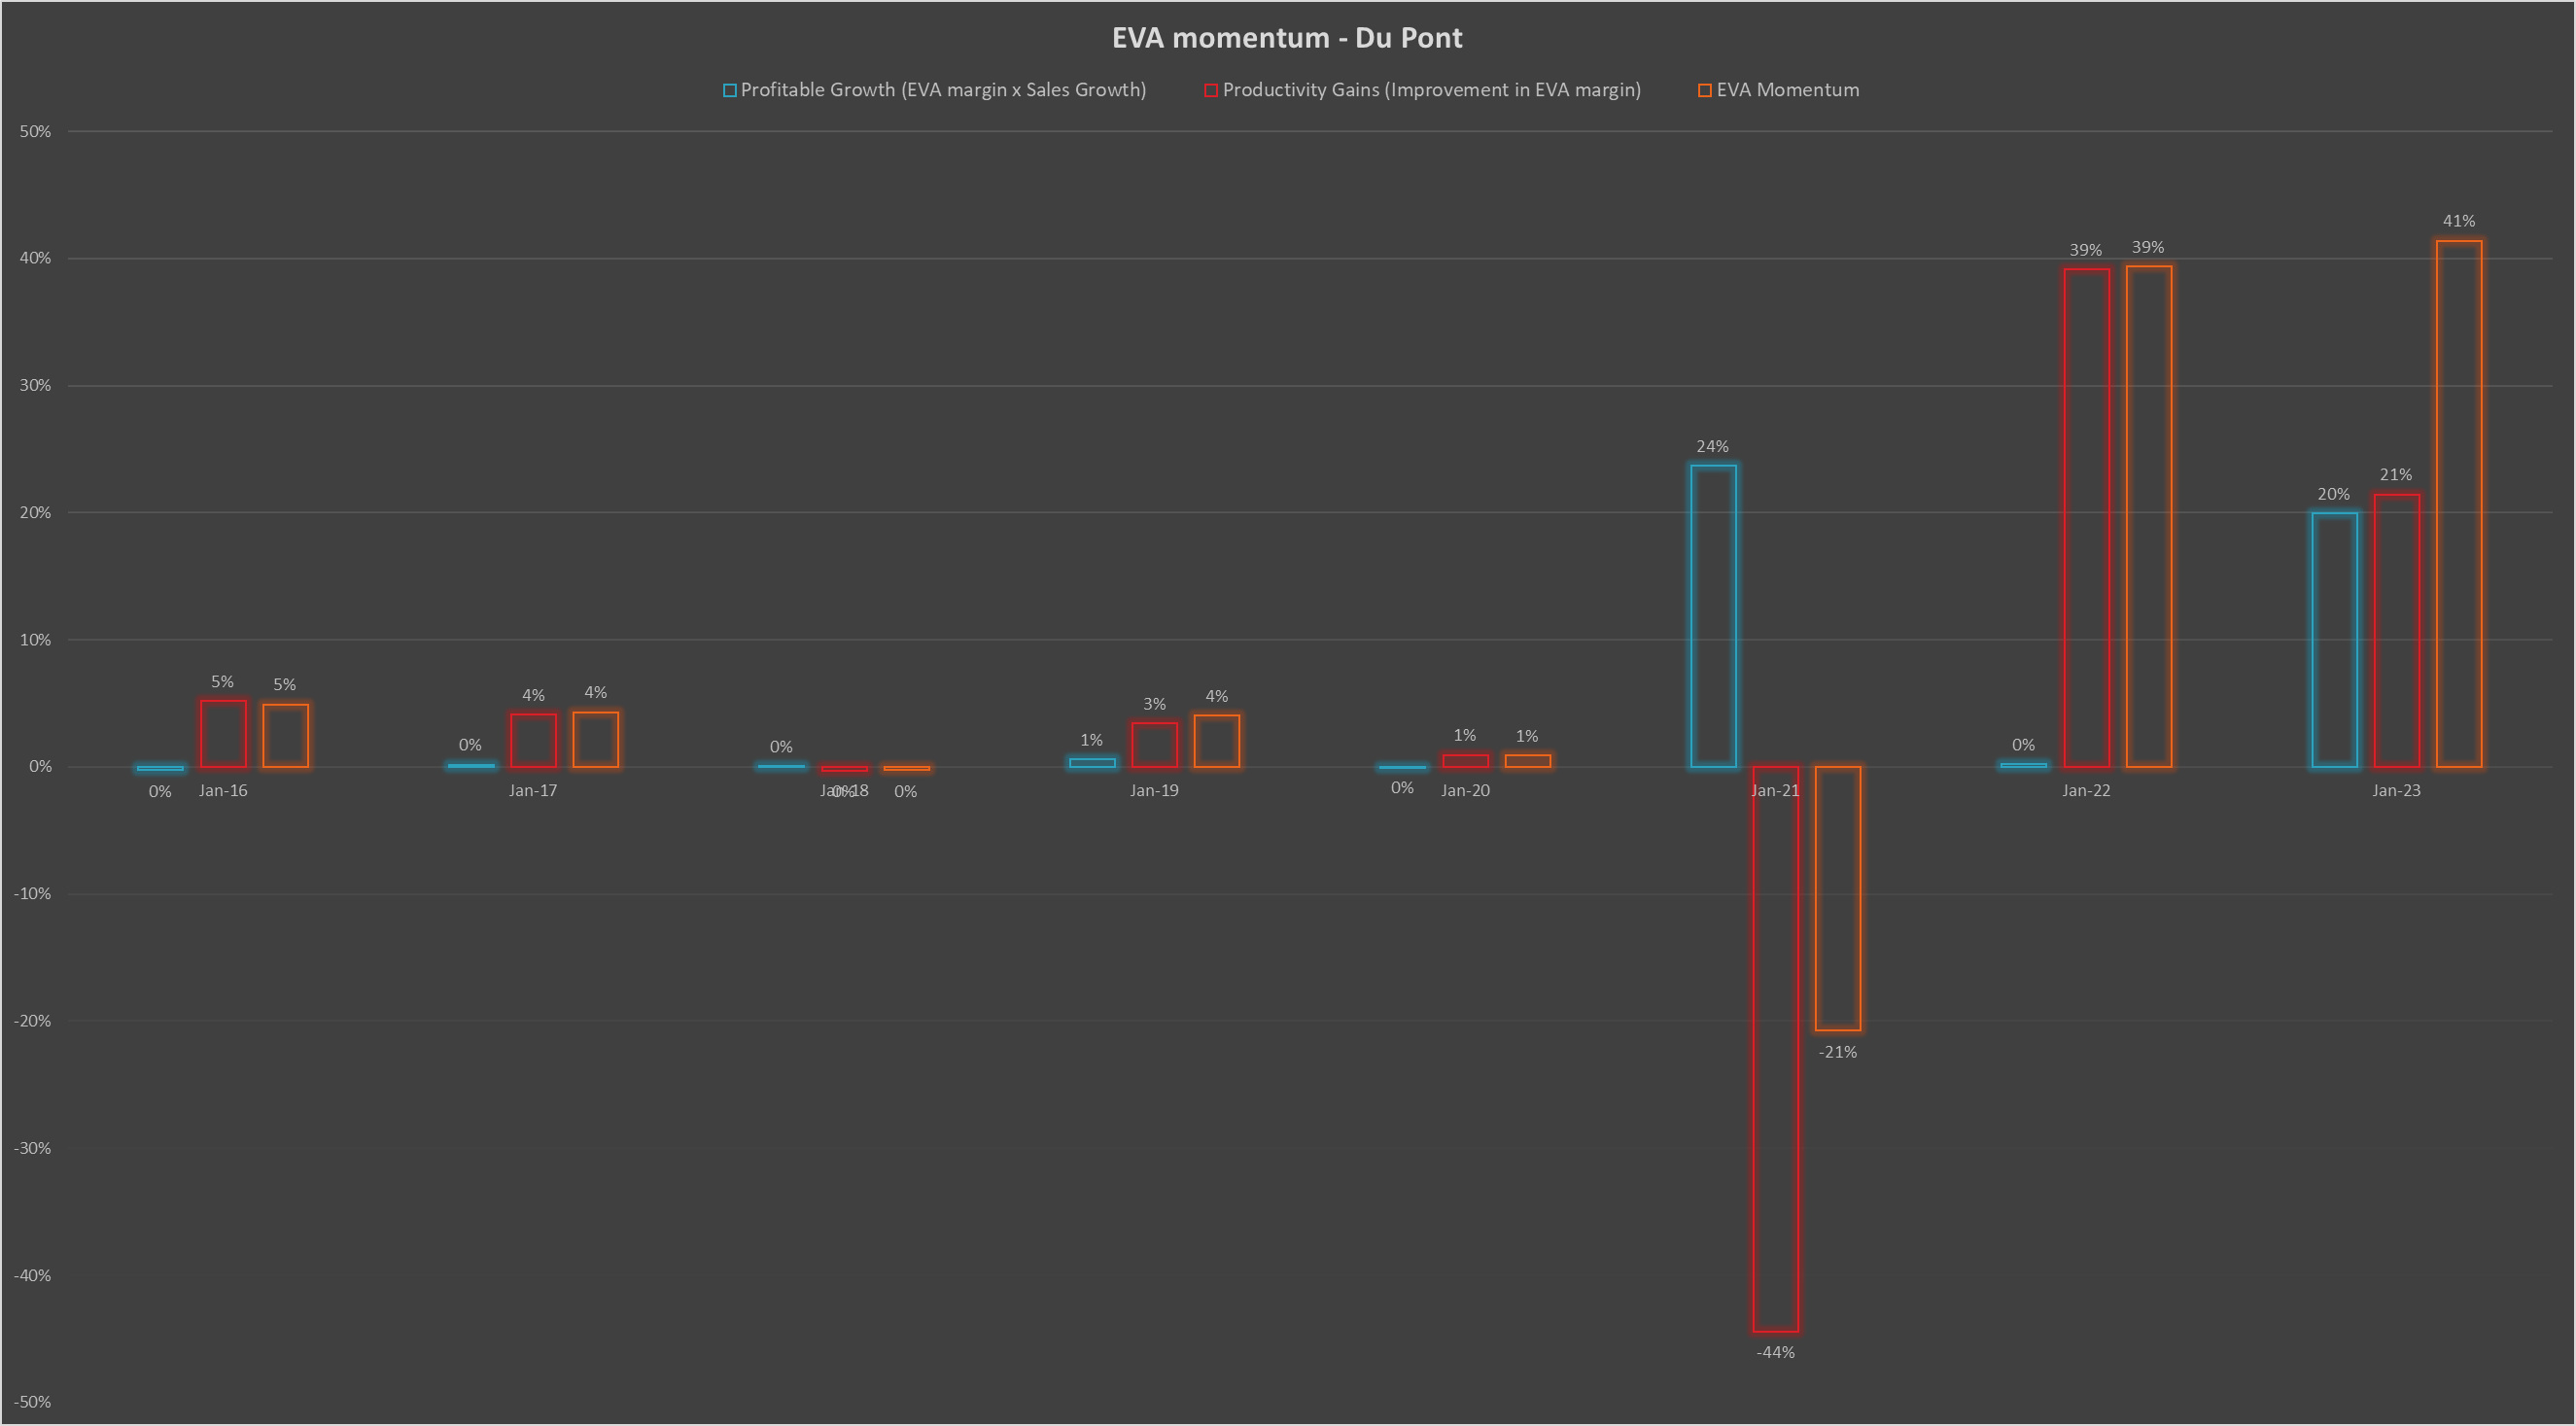
- EVA momentum - du-pont analysis
In summary, we can derive following info from these graphs:
- Sales growth on rise after the COVID impact
- OPM and PAT on rise
- Debt nearly zero
- CFO, FCFF, FCFE and FCFE yield on the rise. Capex also increased which may mean higher sales in future.
- Almost all Cash flow ratios are +ve and on the rise.
- Invested capital falling down which can be a sign of worry. Company is not able to find avenues to put more capital in which can affect its growth in future.
- ROIIC in not in great shape which is a cause of worry
- SSGR higher than sales growth which is a good sign.
- EVA growth and EBIAT growth on the rise after COVID. ROIC greater than WACC which means company is creating value for shareholders.
- EVA margin, EVA per share, EVA momentum all +ve and on the rise which means whatever company is doing, adding a lot of value to shareholders.
After looking at these graphs, I am fairly convinced that it can be a good medium- term opportunity to invest in. Once I am convinced by looking at the graphs, I then use other detailed techniques to evaluate whether the current price is high or cheaper compared to its intrinsic value.
Disc: Not invested; still contemplating. Please do your own research before investing.