Portfolio Composition: A Dual-Strategy Approach
Growth Stocks
This category features fundamentally robust stocks, primarily from the midcap and small cap segments, which exhibit the potential to become future high performers. The selection criteria hinge on several growth indicators, including capital expenditure, positive sector trends, increasing market share, and expanding addressable markets. These stocks are distinguished by their rapid growth rate compared to their industry peers.
Breakout Stocks
The second facet of the portfolio focuses on stocks poised for short-term growth in key financial metrics such as revenue, operating profit margin (OPM), EBITDA, and net profit. These stocks are identified at a breakout point, offering a low-risk entry with a stringent risk management strategy in place, capping the maximum loss per trade to no more than 1% of the total capital.
This strategic blend aims to balance high-growth prospects with calculated short-term gains, optimizing the portfolio for both resilience and performance.
JTL Industries
Growth Ahead
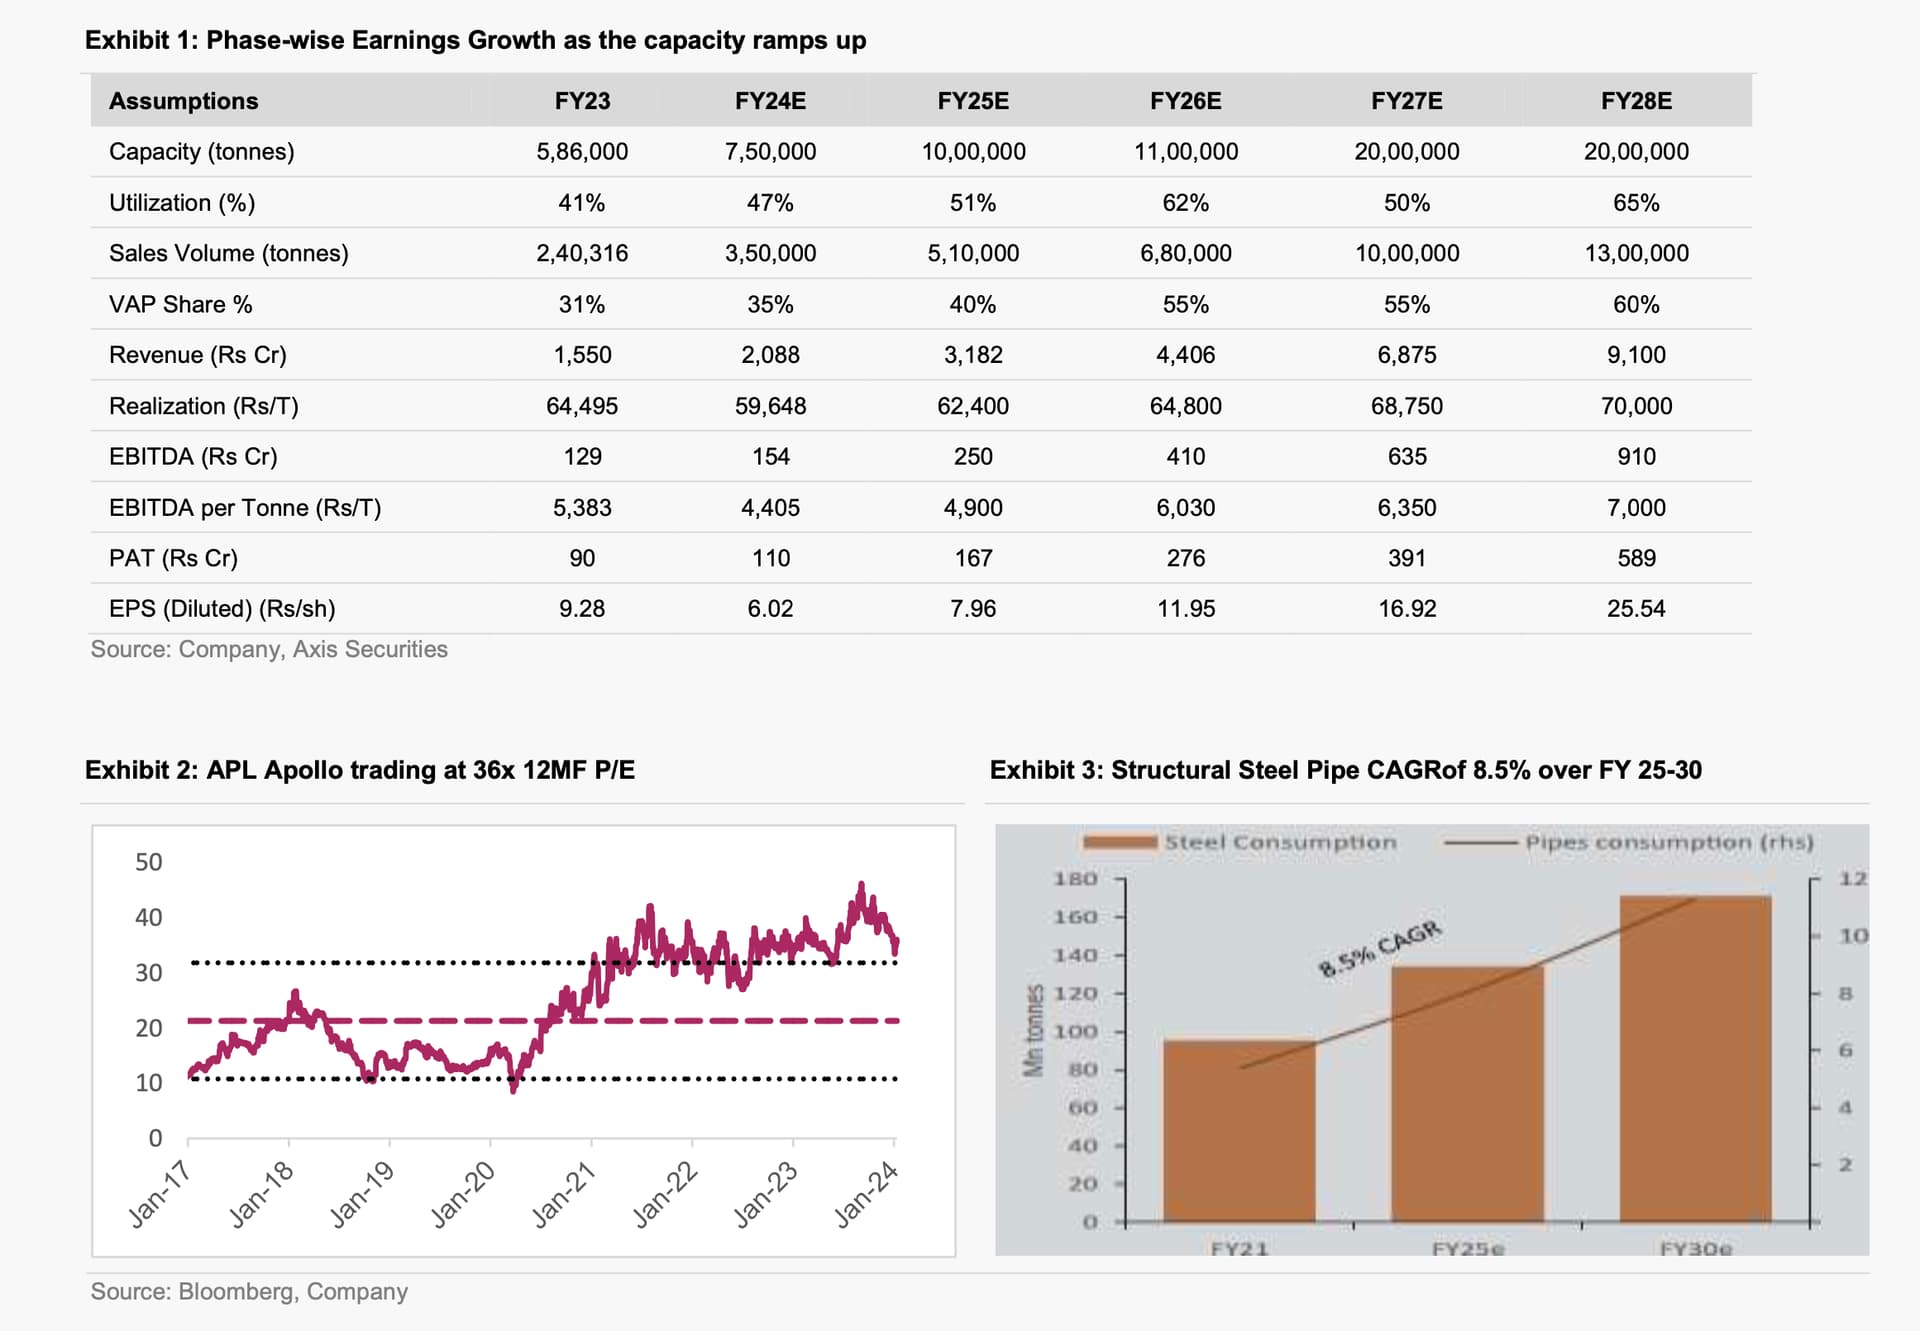
- Company’s announcement in Dec’23 to raise Rs 1,310 Cr to enhance the capacity to 2 MTPA by the end of FY27
- Capacity will reach 2MT by the end of FY27 and full utilization (max ~65% industry standard) on the 2MT capacity will be achieved in FY28
- JTL will enhance its SKUs from 1,000 to 4,000 by FY28 with a focus on VAP (Value-added products). This will translate to ~60% VAP share by FY28 as against 31% as of 9MFY24.
- The newer VAP products will have EBITDA/t of Rs 9,000- 11,000/t, against the general products at Rs 2,000-2,500/t, which will drive the blended EBITDA/t to ~Rs 7,500/t by FY28 (Rs 5,383/t in FY23).
- The expansion plan from 0.56 MTPA to 1 MTPA is on track and will be completed by FY25.
- For the next 1 MT incremental expansion, JTL will focus on enhancing its product profile by adding more DFT lines, introducing color-coated products, and pre-galvanised sheets
Company Outlook & Guidance
- Sector Outlook: Positive
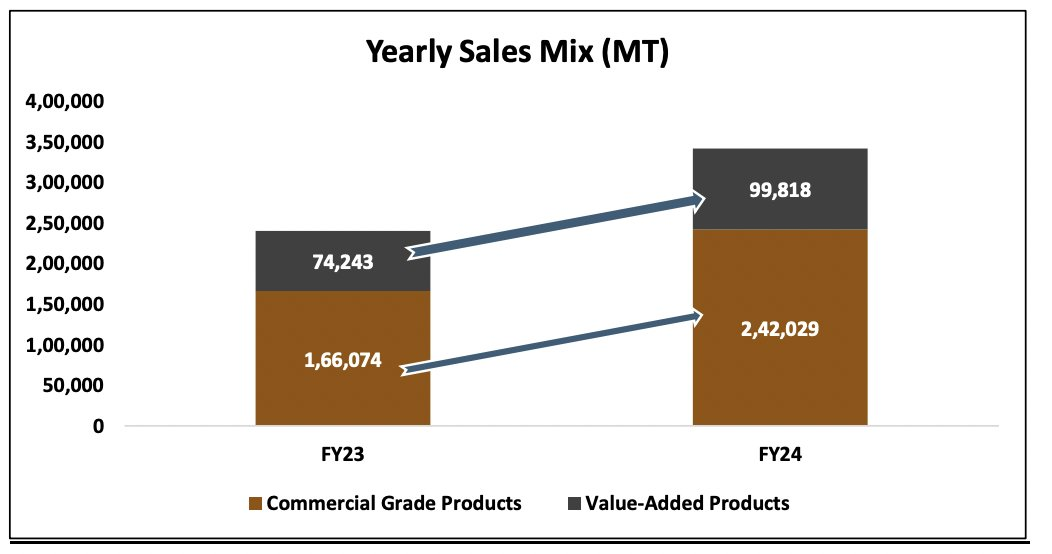
- Post strong Q3FY24 sales volumes, FY24 sales volume to reach ~3.5 Lc tonnes, up 45% YoY, ahead of earlier growth guidance of 30% YoY.
- In Q4FY23, the VAP share could bounce back to 40% (~35% for FY24) from 20% in Q3FY24, as the maintenance of the galvanizing pot is over. 0.56 MT to 1 MT expansion is on track and will be complete before FY25.
- DFT facilities of 2 Lc tonnes out of the total incremental capacity of 4 Lc tonnes will start from Q1FY25.
Concall Highlights Q3FY24
- The company plans to invest Rs 1,200 Cr in its subsidiary company JTL Tubes Limited to set up a Mega Project in the state of Maharashtra at Mangaon. The Capex will be partly incurred from the company’s internal accruals and partly from the proposed issue proceeds (preferential/ QIP).
- In Q3FY24 exports volume stood at 3.6kt, down 19% YoY and 17% QoQ, as the company focused on the domestic market led by strong domestic demand
- JTL currently has 800 dealers pan India out of a total dealer network of 1,000-1,100 dealers, thereby having 80% of dealers catered by it. As more VAP and SKUs share rise in future, more dealers will get on board with the company.
- It currently holds a ~9% market share in the industry and after the onset of the entire 2 MT capacity, its market share will double to 20% by FY28. The market share has moved from 3% in 2019 to 9% in 2023.
- ERW pipes industry is expected to grow at a faster pace than the steel industry at 12-13% in FY24 vs. 10% growth expected in the steel industry.
- Post FY24, the ERW pipes industry is expected to grow by 8-9% for the next couple of years as it replaces traditional long products that were previously used in construction.
Key Risk
- Delay in project execution for the 2 MTPA expansion at the Mangaon Maharashtra plant
- Volatility in the steel prices will drive destocking at the dealer’s end, impacting EBITDA/t.
- Lower-than-estimated demand scenario to hamper the off-take of volumes, impacting our sales volume growth forecasts
Phase Wise Growth at JTL Ahead
- APL Apollo Tubes, which is the sector leader, is currently trading at 36x consensus 12MF P/E, a premium to its long-term average of 21x given the pace of infrastructure growth in the country.
Disclaimer: Not buy or sell recommendations, only for educational purpose
Invested ~ 8% of total capital @ 190
1 Like
Cochin Shipyard
Anticipated Breakout and Financial Growth Trajectory
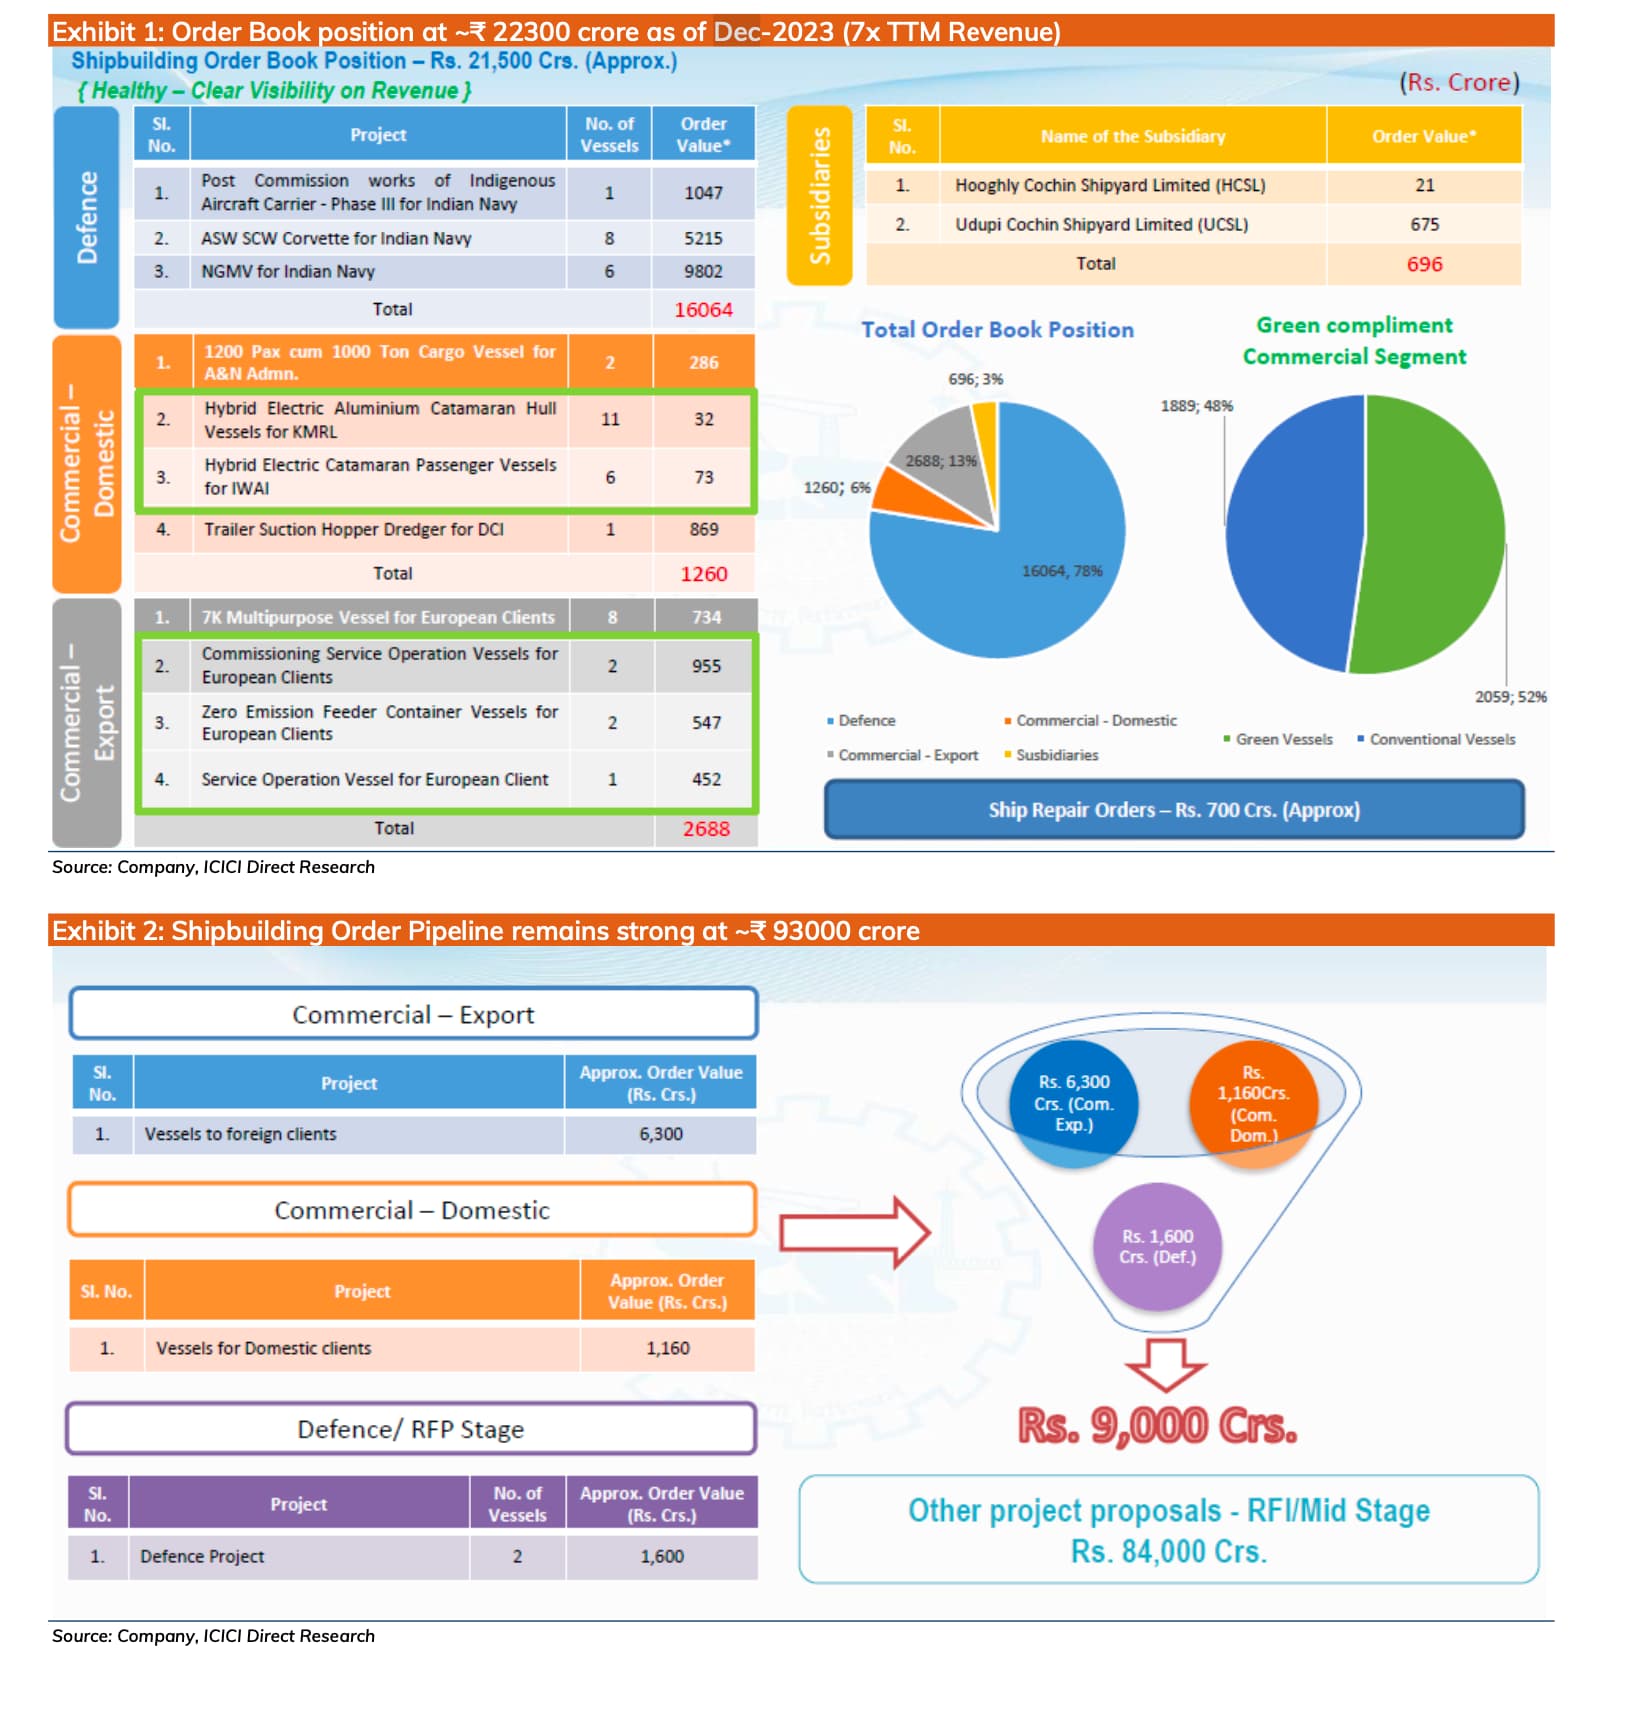
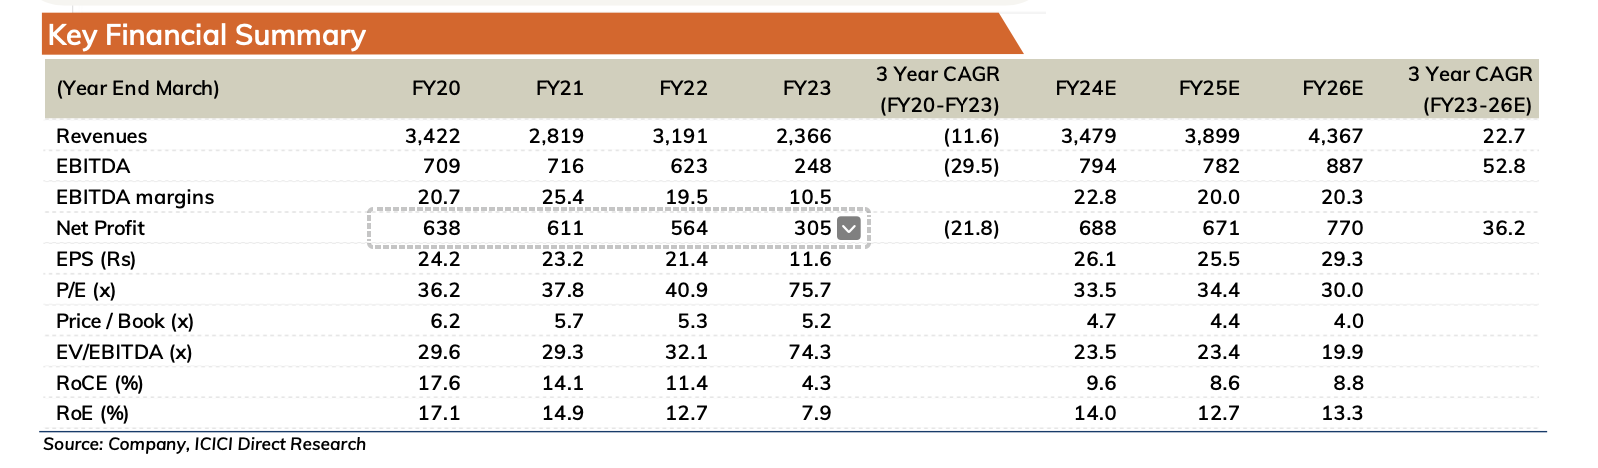
Breakout is expected in near future as stock is currently in a consolidation phase, with its price oscillating between ₹800 and ₹900 with volumes drying up. It exhibits a robust growth trajectory, reflected in the ascending trends of its revenue, operating profit margin (OPM), and net profit. The order book stands impressively at seven times the trailing twelve months (TTM) revenue, signaling strong future earnings potential. Over the next three years, the company is projected to achieve a compound annual growth rate (CAGR) of 22.7% in revenue and an even more impressive 36.2% in net profit, underscoring its promising financial outlook.
Disclaimer: Not buy or sell recommendations, only for educational purpose
Invested ~ 8.5% of total capital @ 890
Building a position in JTL Industries too, with a target of 8-10% of portfolio size. Currently accumulated at 194.70 and makes up 3.57% of my portfolio value. Planning to hold it for the next few years.
1 Like
Check out Zen Technologies as well. It’s in defence tech. 2x sales growth guided for the next FY and 50% CAGR growth for the next 2-3 years. Price in a slightly rising accumulation channel for the last 6+ months. It’s 10% of my portfolio at 953 average price.
1 Like
JTL Industries FY24 Business Update:
The company is clearly winning the battle in the steel tube and pipes category.
JTL Industries grew sales volumes by 42.5% YOY in FY24.
This is a far better show than the likes of APL Apollo that grew sales volumes by 15% YOY and Hi-Tech Pipes that grew sales volumes by 10% YOY.
The CAPEX plans at JTL Industries are well on track as the company is set to improve on its product mix and capture market share.
The only concern with JTL Industries is that the value-added segment grew at a slower pace (up 34% YOY) than overall volume growth (up 42.5% YOY).
The company never had any issues on the fundamental side and has kept performing much better than its peers.
JTL Management had guided to grow volumes by 35-40% CAGR for the next few years so this volume growth number of 42.5% is at par with what the management had guided in the past.
How do we establish if these numbers being reported by management and their commentary is for real? And if they are for real how much of the narrative is sustainable or already in the price?
Their revenue and earning performance before 2020 are nothing to write home about, being flat for 6-8 years. Sudden 10x increase in revenue and PAT, in just 3 years, should lead to even more due diligence. If their business just caught the sectoral tailwind then is this remarkable turnaround in their financial performance sustainable? Can they withstand next downturn cycle which is typical of commodity stocks?
They make the same products as other dozens of listed players. Operating margins are much lower than peer group and they only went up due to higher top line growth. Valuations already look very stretched, compared to industry and peer group average, and that too at the top of bull run. Main promoters have sold quite a lot of shares in the last quarter (good timing before 34% correction).
I have been following steel tube/pipe industry for quite some time and every time sector goes through a bull run, it seems permanent what with exciting order flows and feel good factor all around… But I have realized that only thing permanent with this sector is cyclicality and reversion to mean of stock prices. It’s very important to time entry and exit to make profit and avoid getting stuck in a downcycle for a very long time.
3 Likes
Global diversification is a crucial strategy for investors to potentially reduce risk and enhance long-term returns by spreading investments across different geographic regions and sectors. It helps mitigate the impact of localized economic downturns and benefits from growth opportunities worldwide.
Here is a detailed analysis of the four funds, including their underlying top 10 holdings and a deeper look at risks:
AXIS Greater China Equity Fund of Fund
- Why to Invest: This fund provides specific, concentrated exposure to the fast-growing economies of mainland China, Hong Kong, and Taiwan, offering strong long-term capital appreciation potential and geographical diversification away from domestic markets.
- Returns: The direct growth plan has delivered approximately 47.3% over the last 1 year and 11.5% over the last 3 years (annualized returns as of Jan 2026). Its return since inception in Feb 2021 is around 1.7%.
- Risks: It carries a “Very High” risk classification. The fund is highly susceptible to the specific political risks, regulatory changes, and market volatility inherent in the Greater China region. To mitigate this risk, investors can:
- Maintain a long-term investment horizon (5+ years), as short-term volatility is less likely to affect long-term goals.
- Invest via Systematic Investment Plans (SIPs) to leverage rupee cost averaging and avoid timing the market.
- Allocate a smaller percentage of the overall portfolio to this specific thematic fund.
- Portfolio (Top 10 Underlying Holdings of Schroder International Selection Fund Greater China X Accumulation):
The fund primarily invests 96.40% of its assets in the underlying Schroder International Selection Fund Greater China X Accumulation. The top 10 underlying holdings include companies like Taiwan Semiconductor Manufacturing Co Ltd (TSMC), Tencent Holdings Ltd, and Alibaba Group Holding Ltd. Other holdings may include AIA Group Ltd, Contemporary Amperex Technology Co Ltd, and China Construction Bank Corp. The fund has high exposure to the technology (27.1%), consumer cyclical (20.2%), and communication (14.1%) sectors.
HSBC Global Emerging Market Fund
- Why to Invest: This fund offers a broad, diversified approach to emerging markets worldwide, including countries like China, Taiwan, India, Korea, and South Africa, providing access to a wide range of growth opportunities managed by a global platform.
- Returns: Trailing returns as of Jan 2026 are approximately 49.10% (1 year) and 18.65% (3 years) for the direct plan. The return since its inception in March 2008 is around 5.75% annualized.
- Risks: Classified as “Very High” risk due to potential liquidity constraints, currency fluctuations, and political instability of various emerging markets. Mitigation strategies include:
- Maintaining diversification across asset classes (e.g., balancing with debt or gold funds) within your overall portfolio to manage risk.
- Regularly monitoring and rebalancing your portfolio (e.g., quarterly or semi-annually) to maintain your desired risk level.
- Staying informed about the economic and political indicators of the underlying countries.
- Portfolio (Top 10 Underlying Holdings of HSBC Global Investment Funds - Global Emerging Markets Equity S1D):
The fund primarily invests 99.26% in the underlying HSBC Global Investments Funds - Global Emerging Markets Equity S1D. The top 10 holdings feature companies such as Taiwan Semiconductor Manufacturing Co Ltd (TSMC), Tencent Holdings Ltd, Samsung Electronics Co Ltd, and Alibaba Group Holding Ltd. Other significant holdings often include major Indian companies like Reliance Industries Ltd, ICICI Bank Ltd, and Infosys Ltd. The fund has high exposure to technology (25.9%) and financial services (25.6%) sectors.
Edelweiss US Technology Equity Fund of Fund
- Why to Invest: Ideal for investors seeking exposure to the dominant US technology sector, which includes major global innovators (e.g., Nvidia, Microsoft, Amazon), and has a history of strong returns driven by technological advancements.
- Returns: The direct growth plan has delivered approximately 24.0% over the last 1 year and 38.4% over the last 3 years (annualized returns as of Jan 2026). Its return since inception (March 2020) is around 23.8% annualized.
- Risks: It carries a “Very High” risk rating as it is a concentrated, sector-specific investment, highly sensitive to US regulatory changes, interest rate policies, and industry-specific downturns. Mitigation strategies include:
- Using a core-satellite approach, where this fund is a smaller ‘satellite’ position within a broader, more stable ‘core’ portfolio.
- Limiting exposure to this single sector and diversifying across others like healthcare or utilities which may be less correlated with technology stocks.
- Portfolio (Top 10 Underlying Holdings of JPMorgan Funds - US Technology Fund I A):
The fund invests 96.29% of its assets in the underlying JPMorgan Funds - US Technology Fund I A. The top 10 underlying holdings include major tech companies like Microsoft Corp (11.0%), Apple Inc (9.6%), and Nvidia Corp (9.2%). Other significant holdings are Alphabet Inc, Amazon.com Inc, Broadcom Inc, and Meta Platforms Inc. The fund has a significant allocation to the technology (59%) and communication services (19%) sectors.
Sundaram Global Brand Theme Equity Active Fund of Fund
- Why to Invest: This fund focuses on well-known, established global brands (like Google, Microsoft, Amazon, Visa, LVMH) known for their durable competitive advantages and pricing power, offering resilience across economic cycles and good multi-country exposure.
- Returns: The direct plan has delivered approximately 17.56% over the last 1 year and 19.57% over the last 3 years (annualized returns as of Jan 2026). The total return since inception in August 2007 is around 9.7%.
- Risks: It has a “Very High” risk profile due to exposure to global market volatility, currency risks, and potential higher expense ratios. Mitigation strategies include:
- Ensuring a clear alignment with a long-term investment horizon (10+ years) to weather market cycles and reduce the impact of short-term volatility.
- Using this fund as part of a diversified geographical allocation to avoid over-reliance on US or Indian markets alone.
- Portfolio (Top 10 Underlying Holdings of Sundaram Global Brand Master):
The fund invests 97.55% of its assets in the underlying Sundaram Global Brand master fund. Key holdings in the top 10 include Microsoft Corp (7.9%), Alphabet Inc Class A (7.6%), and Amazon.com Inc (6.8%). Other top companies are Visa Inc, Mastercard Inc, Procter & Gamble Co, PepsiCo Inc, and Coca-Cola Co. The fund focuses heavily on technology (35%) and consumer cyclical (21.2%) sectors.
So, should we consider MON100 etf for global exposure?