**My Notes on Cement Industry - **
1. Industry Overview and Demand Dynamics
Cyclical Demand Drivers: Cement demand is closely tied to housing and infrastructure developments. During economic expansions or increased infrastructure spending, cement demand rises, whereas it contracts during downturns.
Price Competition: Cement is a commodity product with low customer stickiness, leading to limited pricing power for manufacturers. Companies often rely on volume growth and cost efficiency to drive profitability.
2. Cost Structure Analysis
Power & Fuel (35%): Coal and other fuels represent the largest cost factor. The volatility of these inputs directly impacts profitability, with potential savings from alternative energy sources (green energy or Waste Heat Recovery Systems, WHRS) boosting margins.
Transportation/Freight (25%): With transportation costs comprising a large portion, reducing lead distances and optimizing logistics can significantly impact margins. Notably, the industry practice is to produce clinkers near limestone mines and transport them to grinding units near consumption centers, reducing transportation costs on raw materials but increasing it for clinkers.
Raw Materials (15%): Limestone, which is highly regulated with royalty and lease costs, creates barriers to entry due to government-controlled mining rights.
Labor and Other Costs: Combined, these costs form a sizable portion, though less variable than fuel and transportation.
3. Investment Considerations and Competitive Analysis
Investors should prioritize companies that exhibit:
Low-Cost Production: Firms with strategic access to limestone (reducing raw material transport costs) or other location-based advantages.
Operational Efficiency: Plants using the latest technology for energy and fuel efficiency typically enjoy a cost advantage, especially in a high-volume business.
Financial Strength: Cement’s cyclical nature means cash reserves and low debt-to-equity ratios are vital for weathering downturns. A debt level of 1.5x EBITDA/Ton is a critical threshold for sustainability.
Economies of Scale: Larger players generally have more bargaining power in raw material sourcing and logistics.
High Profitability: Firms consistently achieving a 1,000/ton EBITDA, either through sales price growth or cost reduction, demonstrate strong management and operational resilience.
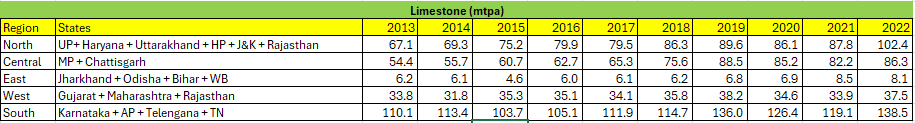
4. Regional Market Insights
North: Strong pricing and utilization rates make this a preferred market for established players.
West: Slower growth with lower pricing power due to a high base from prior growth periods.
Central: Ultratech-led consolidation has created a growth-friendly environment with reduced competition.
East: Recent expansion by top players makes the market competitive but with good growth potential.
South: Fragmented and oversupplied due to abundant limestone, leading to intense price competition and unattractive margins.
5. Key Metrics and Valuation Benchmarks
Unit Economics:
Retail price per ton: ~7,000 INR.
Realization by company: ~5,500 INR.
EBITDA per ton: 1,200 INR is considered a decent benchmark.
Capex Requirements: Building capacity costs around 8,800 INR/ton.
EBITDA Sensitivities:
5% reduction in lead distance: 4% increase in EBITDA.
10% reduction in petcoke price: 6% increase in EBITDA.
These sensitivities highlight how small changes in logistics, fuel prices, or efficiency can impact profitability.
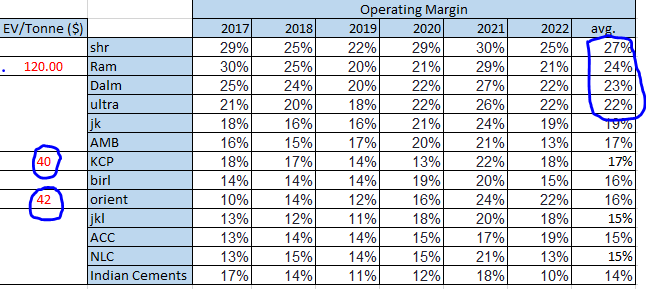
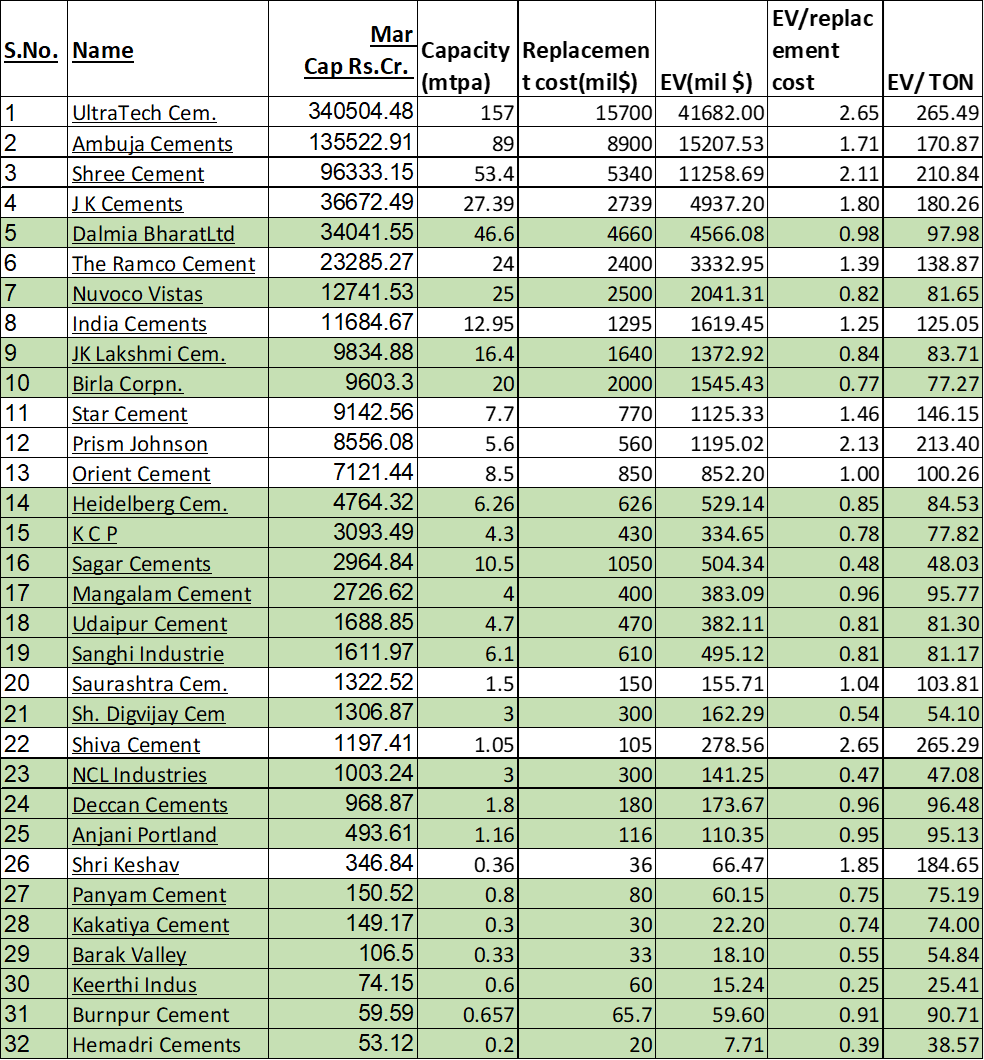
Valuation (EV/Ton):
Large companies: $120–$140 per ton.
Small and mid-sized companies: ~$100 per ton.
6. Summary and Recommendation
Strategic Geographic Advantage: North and Central regions are currently the most attractive markets.
Cost Leadership: Companies with lower logistics, fuel, and labor costs are better positioned for sustained profitability.
Balance Sheet Strength: Firms with low debt-to-equity ratios and a debt level not exceeding 1.5x EBITDA/Ton are preferable.
Large-Scale Operations: Companies benefiting from economies of scale, with EV/Ton near $120–$140 (if large) or ~$100 (if smaller), are generally valued attractively in this capital-intensive industry.
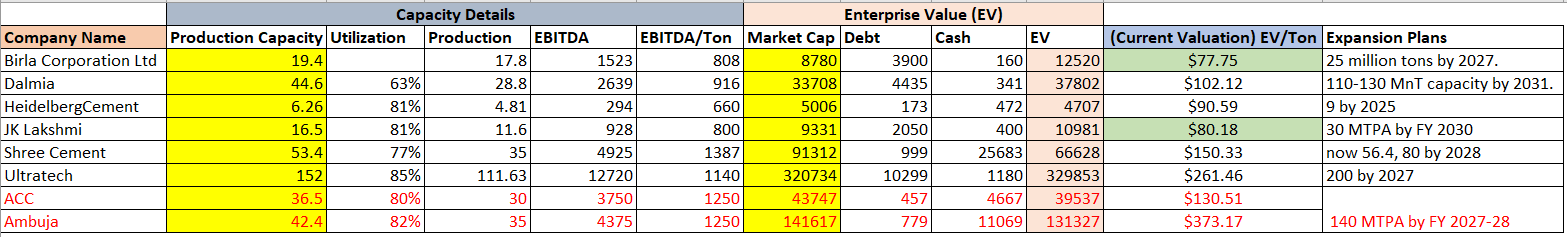
** I have completed the exercise below using data from the 2024 annual report. ACC and Ambuja have approximate values since, post-Adani takeover, we do not have the split for ACC and Ambuja. **
From the information below, can we infer that Birla Corp and JK Lakshmi appear fairly valued for now w.r.t their efficiencies, while other companies are overvalued with an EV/Ton greater than $85.