Please find herewith attached a presentation I made at Goa 2017 meet.
COMBINING TECHNICALS WITH FUNDAMENTALS.pptx (932.7 KB)
Please find herewith attached a presentation I made at Goa 2017 meet.
COMBINING TECHNICALS WITH FUNDAMENTALS.pptx (932.7 KB)
Sir. Some commentary (audio or text) with it will help to understand it more. If possible request you to please provide.
hi
The explanations are put up in the slide itself. For more details on the various patterns discussed u can google the name e.g cup and handle. There you will get all the details of the pattern which u can try to correlate with the various charts shown in presentation.
Most of the stuff is self explanatory. Most of the patterns discussed are visible to the practiced eye. So once u familiarise yourself with the pattern it would be easy to spot the patterns as they unfold on different charts.
I will keep updating this thread with other classical patterns as well as the patterns discussed above happening in current situations in various stocks as and when I find them.
Thank you. Further updates would be great to help us learn.
Ah Great…rational analysis…combining fundamental analysis with technical analysis…my favourite topic…buying the right stock at the right price and at right time…
Thanks a lot hitesh ji. Is there any way any one can attend this meet? get membership or something?
To attend this meet, you need to contribute in the forum. If your contribution is helpful, your intent is good and if you turn out to be among the top contributor, you will be invited for the meet. If any of the previous top contributor does not contribute next year then he may not get the invite. So it is based on merits of your contribution, intent and discipline in the valuepickr forum. None of the top contributors has a guaranteed seat in the meet including admin & moderators.
Thanks Hitesh Bhai. Me too follow the same 
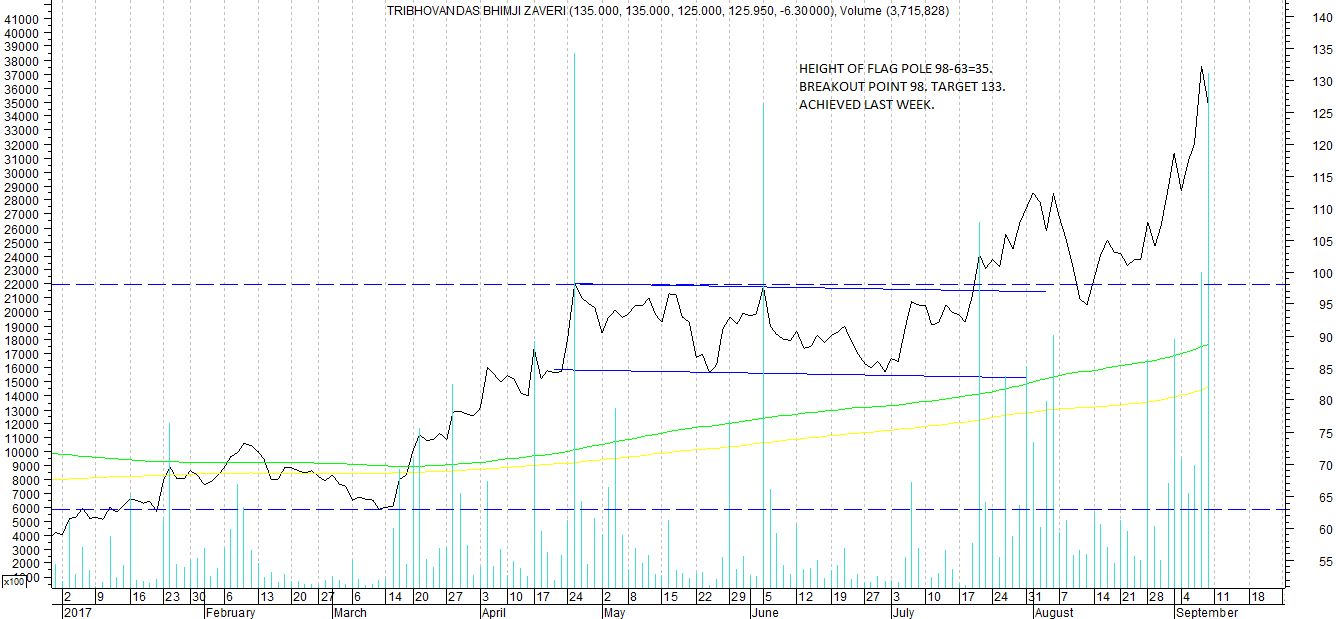
TBZ chart attached with comments on the chart. (disc: invested) Technical targets achieved. Few fundamental buy calls on the company have begun now. The sector seems to be in an uptrend with sector leaders like Titan and PC Jewellers showing strength.
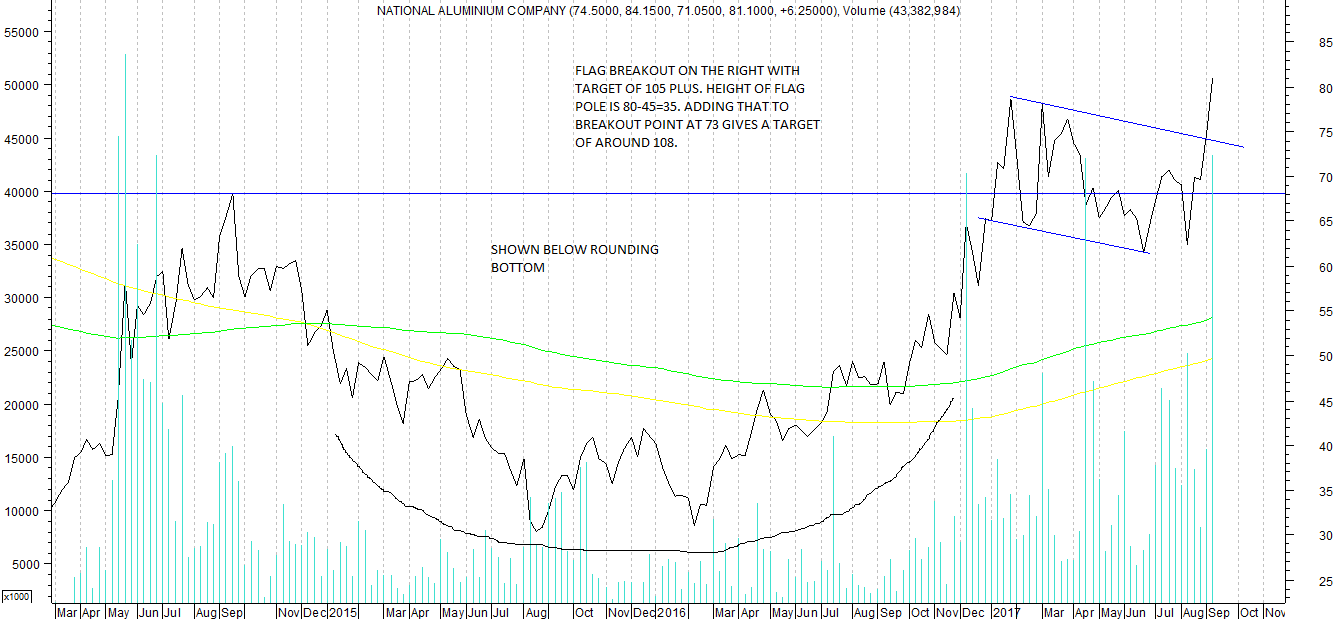
NATIONAL ALUMINIUM CHART attached. disc; invested. The global aluminium prices esp on LME have broken multi year highs which signals strength.
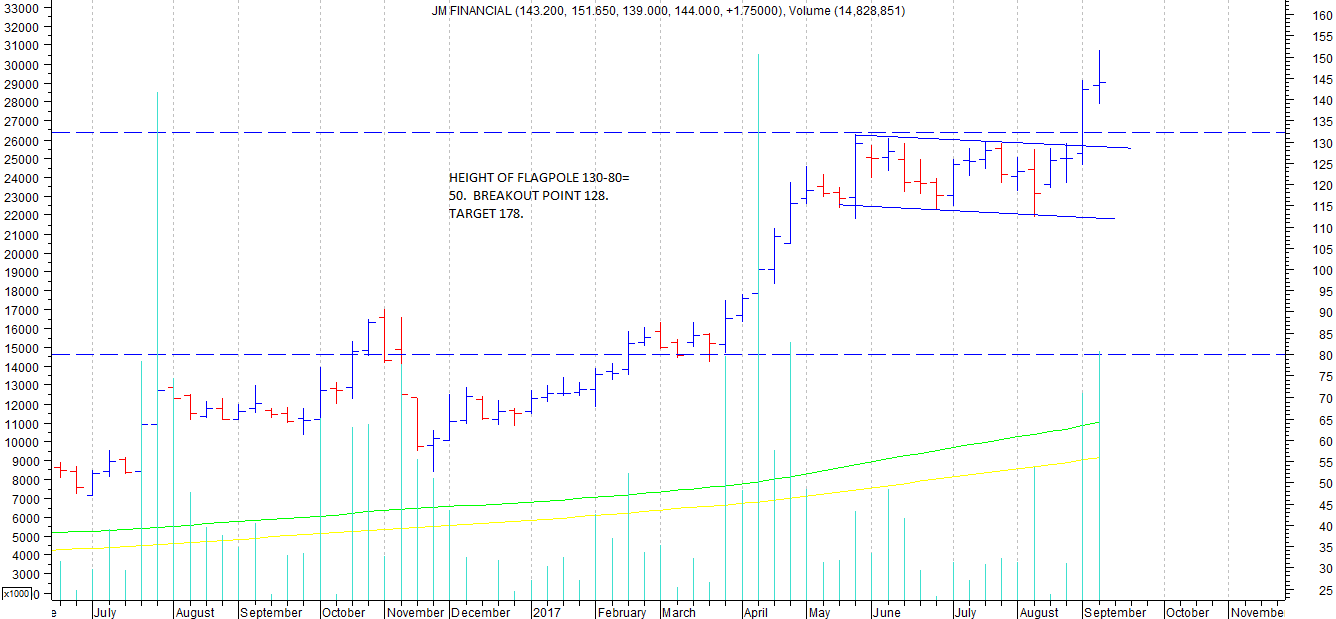
JM Financials.
Attached chart shows a classical flag on weekly chart with the requisite volumes parameters too. During flag formation, volumes dip and on breakout they expand. Fundamentally the company has been showing good traction in the businesses it is involved in as reflected in quarterly nos. disc: invested at cmp of around 145.
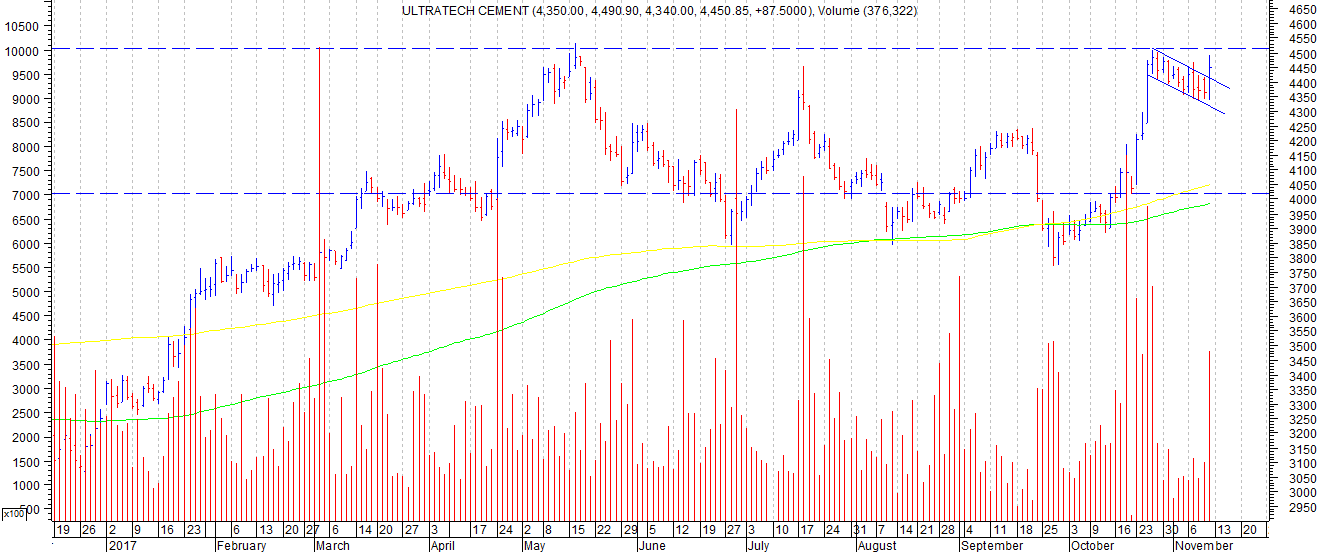
Attached herewith is daily chart of Ultratech Cement.
The chart shows a flag pattern breakout with increase in volumes today as compared to low volumes during the formation of flag. Height of flagpole is 500 as shown in dotted lines . Breakout point is 4450 and target comes to 4950.
disc: invested based on technical picture at around current levels.
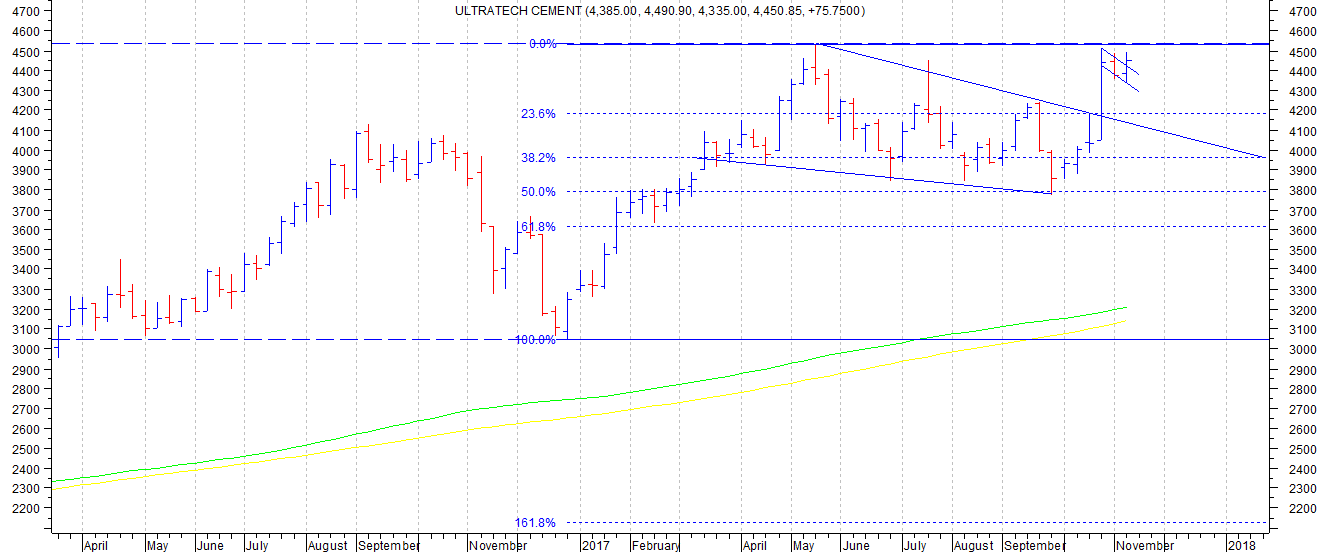
As a follow up to Ultratech daily chart, the weekly chart of the company also shows interesting pattern of flag and pennant breakout.
Post the rise from Dec 2016, from lower dotted line, stock rose to hit a high of 4533 in May 2017 and then went into an intermediate correction in the form of a triangle/pennant. As shown in the chart by retracement levels, stock formed a bottom at 3773 at around 50% retracement level to the whole preceding upmove and started moving up, and broke out of the consolidation in Oct 2017, and since then is sideways.
Here on weekly chart the height of flag pole is from 3000 to 4500 which is 1500 rs. And breakout point was around 4150. Target of this pattern breakout could be 4150 plus 1500 = 5650.
Sir,
Generally what time frame do you consider for such a pattern? and also what should be ideal stop loss for such case.
thanks in advance.
regds,
Sujeet
sujeet,
Usually time frame depends upon the time frame of charts on which the pattern is visible. e.g In case of daily pattern post breakout usually targets are achieved within few days maybe 10-15 days or so. In case of daily chart of Ultratech cement the stop loss would be the low posted in the flag before the breakout happened.
Hitesh sir what u make of Hawkins nos
Sir,
Seems like breakout was false & buying momentum is not strong to hold and scale the breakout point.
Do you have any further readings on the same/
regards,
Sujeet
Yes the breakout in ultratech was a false breakout and in the short term the stop loss has been triggered.
Stock price today broke the 4300 levels and we need to see how it behaves if markets were to rebound.
@hitesh2710
Sir
What is your view on National Aluminium now? Are you still invested in the stock? I hope that you are tracking it. I need your opinion before investing in it. Thanks.
Hi Hitesh sir
Which software/tool do u use for technical analysis
Thanks a lot
Mahesh