What is CRO ?
Clinical Research Organizations where they do Drug development process. Simply Outsourcing of drug development for Pharma, biotech and all other research entities who wants to develop drugs.
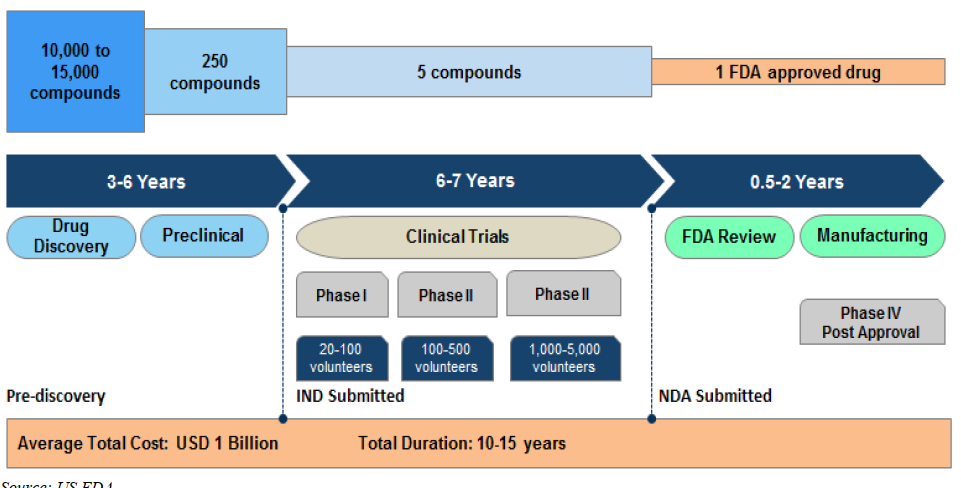
Process in US FDA: Drug Development Life Cycle: Timeline for New Drug Approvals as per US FDA
Each Phase: What they do? Life Cycle of Drug Development
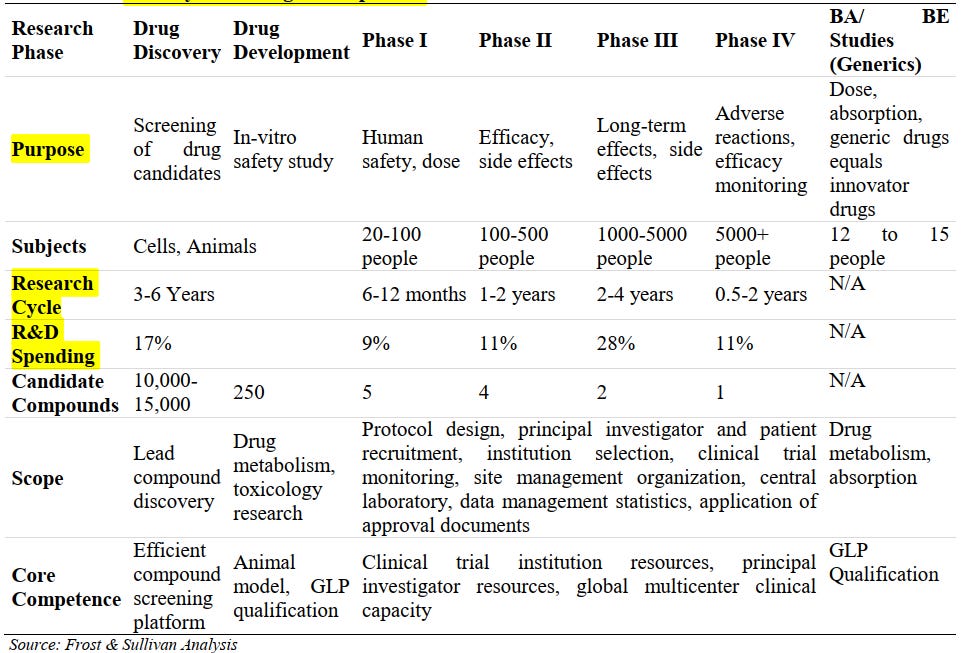
This is very complex process to do… Mainly R&D spends will entirely be waste if nothings comes out.
What is Bio availability?
- The proportion of a drug or other substance which enters the circulation when introduced into the body and so is able to have an active effect.
What is Bioequivalence?
- Bioequivalence is the biochemical similarity of two (or more) drugs that share the same active ingredient(s) and desired outcome(s) for patients.
What is Biosimilars?
- A biosimilar (also known as follow-on biologic or subsequent entry biologic) is a biologic medical product that is almost an identical copy of an original product that is manufactured by a different company.
Biosimilars are officially approved versions of original “innovator” products and can be manufactured when the original product’s patent expires.
Reference to the innovator product is an integral component of the approval.
Global Clinical Research Organization (CRO) Market Overview
- CROs are a key constituent of the drug development process, providing a range of services to pharmaceutical, biotechnology, and medical device companies, as well as governments, academic institutions, and other research entities. These services can encompass all phases of the drug development lifecycle, from compound selection, discovery, preclinical (pre-human in-vitro and in-vivo) research, clinical (in-human) testing, as well as post-approval functions such as commercialization, safety assessment, monitoring, and consulting, among other services. Overall, CROs help pharmaceutical companies manage the drug development process, and given CROs’ global scale and therapeutic expertise, they are often able to do so more cost effectively and with a shorter time-to-market than in-house research and development departments at pharmaceutical companies.
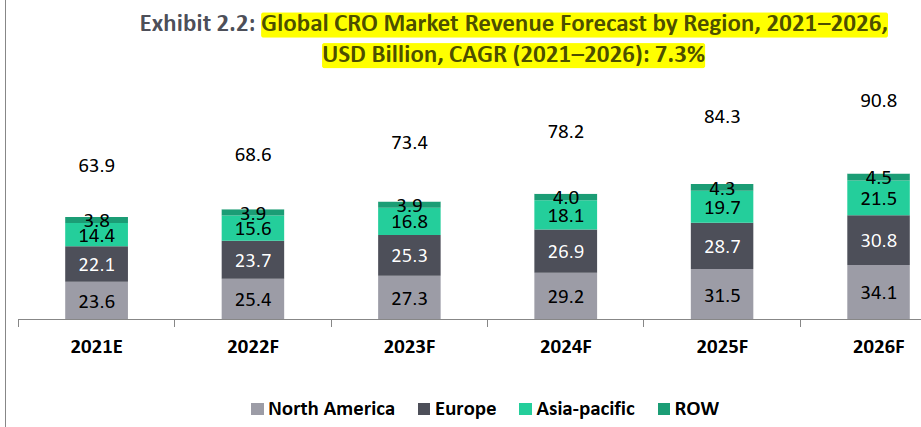
- The global CRO market is projected to reach USD 90.8 Bn by 2026 from USD 63.9 Bn in 2021. With more than 1,000 competitors and an ever changing market landscape, the global CRO industry is expected to witness a CAGR of about 7.3% between 2021 and 2026 .
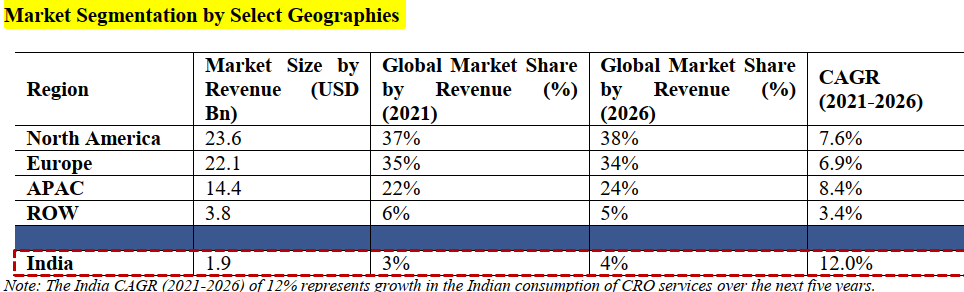
Indian CRO market captures about 3% of the global market share by value , estimated at USD 2 Bn in 2021 and is expected to be the fastest growing market with a CAGR of about 12% from 2021 to 2026:

CRO Market Segmentation by Sub-Segments

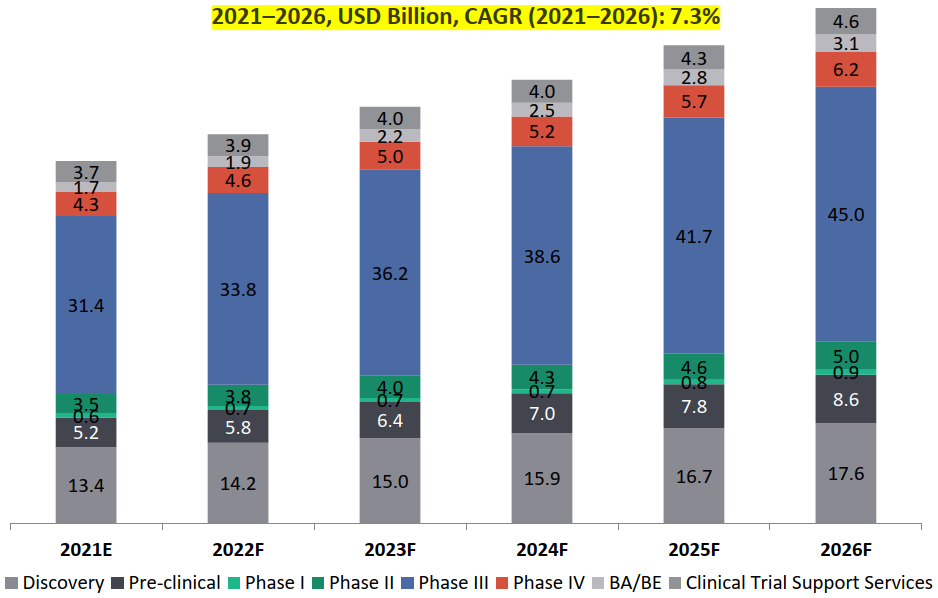
Global CRO Market: Revenue Forecast by Sub-segments
Global Market for BA/ BE Studies, 2021- 2026, USD Billion
- Drug discovery and preclinical research segment is expected to witness 7% growth over the next five years (2021-2026) . This is driven by increased outsourcing of early-stage activities by small-to-mid segment pharmaceutical companies.
- North America and Europe are the key dominating segments for discovery and preclinical research, with more than 50% of the market for early-stage drug development, as most of big CRO participants function in these regions, followed by APAC.
The sub-segment, with highest revenue generating potential in the CRO industry is the clinical trials segment which accounts for the largest share (62%) in 2021 .
Phase III segment is set to dominate the clinical trial landscape for CROs:
- Phase III trials segment accounts for the maximum share of the global CRO market (49% market share in 2021) and is expected to grow by about 7.5% over the next five years to reach to about USD 45 Bn by 2026.
- BA/ BE segment expected to witness the highest growth rate of about 13%: The clinical trial support services segment is estimated to capture about 9% of the total market share in 2021 with BA/ BE studies contributing to 30% of USD 5.4 Bn of the clinical trial support services market in 2021. Though BA/ BE segment captures only about 3% of the total market share , this segment is expected to witness the highest growth rate of about 12.6% between 2021 and 2026.
Trends Expected in Pharmaceutical R&D Spends
- Global pharmaceutical R&D spending is expected to increase at a CAGR of 3.6% between 2021 and 2026.
- Average cost to develop one drug and commercialize in the market has increased by 10.2% from USD 1.18 Bn in 2010 to USD 1.3 Bn in 2020.
- The R&D spending was estimated to be around USD 195 Bn in 2021 and it is estimated to grow to about USD 233 Bn by 2026 at a CAGR of about 3.6%.
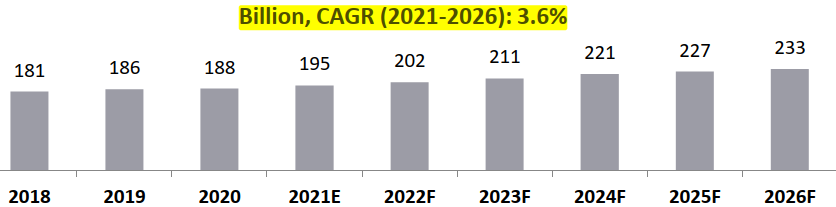
Global Pharmaceutical R&D Spending, 2018-2026, USD.
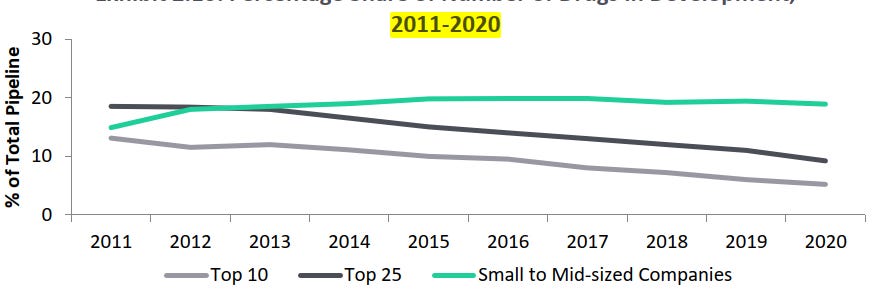
R&D spend by small and mid-sized pharmaceutical companies in terms of proportion of number of drugs in development is positively increasing than the large pharmaceutical companies:
- Large sized pharmaceutical companies (top 10 and top 25 companies).
- This trend is expected to continue for the next five years (2021-2026)
- Small and mid-sized firms with less than 10 products - (3% growth from 2011 to 2020)

R&D spend by top 20 and other large players form the largest segment of the pie (7%) by 2026 ; however, small and mid-sized pharmaceutical companies will drive the spending at a CAGR of 6.1%:
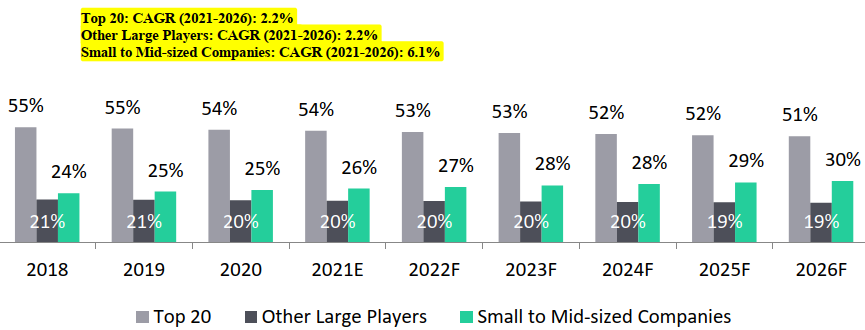
R&D Spend by Type of Companies, 2018-2026F
The overall R&D spend of the top twenty players is expected to increase at 2.2% CAGR from USD 98 Bn in 2017 to USD 119.2 Bn in 2026;
- while, the overall spend of the small and mid-sized players is expected to grow at about 6.4% during the same period.
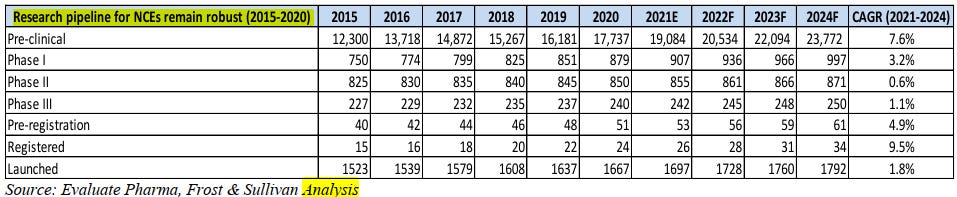
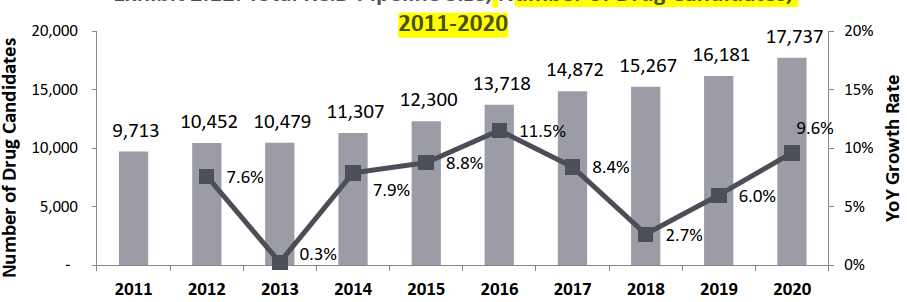
- Number of molecules in R&D stage is on the rise : There are more than 17,000 molecules currently in preclinical development, which is attributed to the constant effort of discovering new drug candidates.
- In the year 2020, 17,737 molecules were in R&D stage of development. Not only has the overall size of the pipeline increased to 17,737 drugs, but the growth rate has also shot up, to 9.62% in 2020 as compared to the growth rates of 5.99% in 2019 and 2.66% in 2018. As compared to the trend over the last three years (2017-2019), the growth rate in the number of drugs in R&D were 8.41% (2017), 2.66% (2018) and 5.99% (2019), which averages out at 5.69%, making 2019 growth rate slightly above the three-year mean.
Number of Drug Candidates, 2011-2020
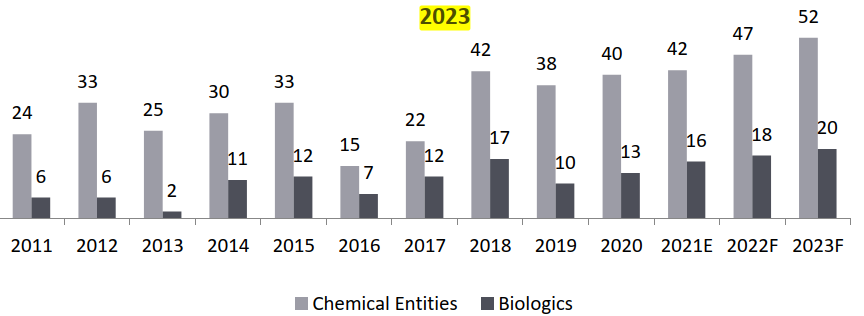
Consistent effort and spend towards development of NCEs - New chemical Entity

Biologic drugs to lead the next wave of US FDA approvals the number of biologics expected to be approved in the next 3 years is expected to grow by about 10% over the next three years.
The Outsourced CRO Industry and the Driving Tailwinds
Because of the need for GLP laboratory, pharmacological toxicology testing has a high barrier, and thus a higher outsourcing rate.
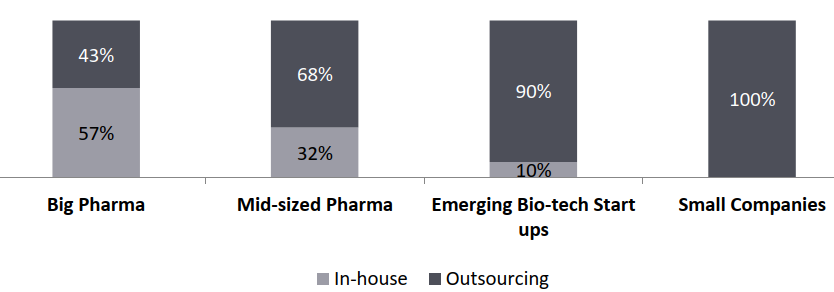
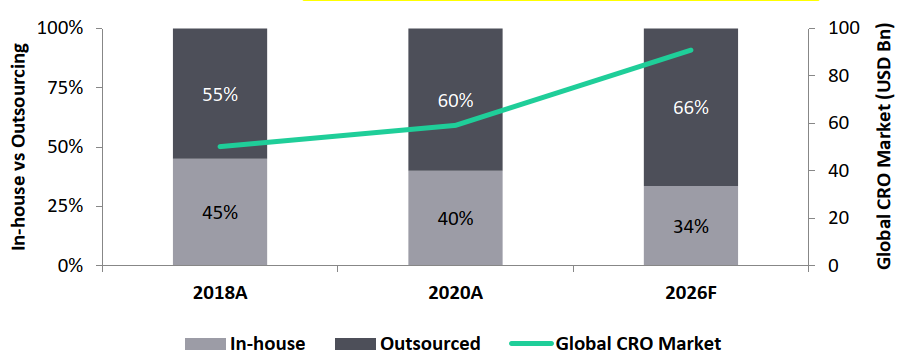
- Mid-sized, emerging bio-tech and small pharmaceutical companies (together constitutes 74% of pharmaceutical R&D spend in 2020) drive outsourcing: Currently, big pharmaceutical companies outsource around 40-45% of their activities to CROs, and this number is expected to grow to about 60% by 2028.
- The increased R&D budget and willingness to spend in the next 5 years is a significant opportunity for CRO companies.
- This will lead to significant increase in outsourcing percentage of BA/ BE studies and this could benefit companies like Veeda, Vimta, Lambda, etc. who have focus in BA/ BE segment.

Pharma R&D Outsourcing, By Type of Company, 2021
Rising costs of therapeutic development and pressure on pharmaceutical margins leading to increasing outsourcing: Only five out of every 10,000-15,000 experimental compounds that enter preclinical trials advance to human testing.
R&D Costs (USD Mn) per Approved New Drug Increased by 14X Since 1970
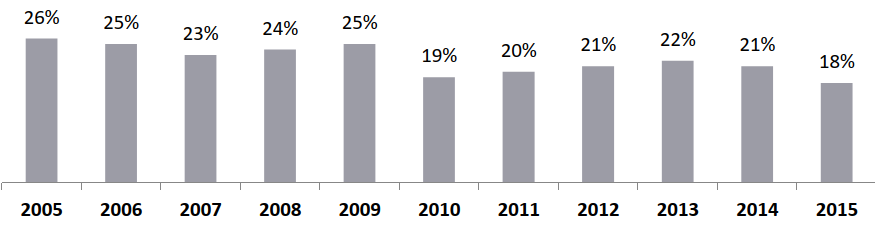
Pharmaceutical Industry Margins, 2005 – 2015
Complexity of the drug discovery and preclinical research increases outsourcing opportunities for CROs: Discovering and developing a new therapeutic can take 10-15 years, on average, with costs often exceeding USD 1 Bn.
Improving the efficiency of new drug research: The CRO business model can save an average of 20 to 30 weeks of the drug development time , thereby indirectly increasing the revenue of pharmaceutical companies
If you like it subscribe and Continue…
Subscribed
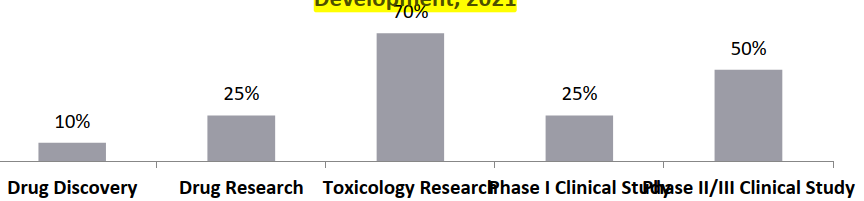
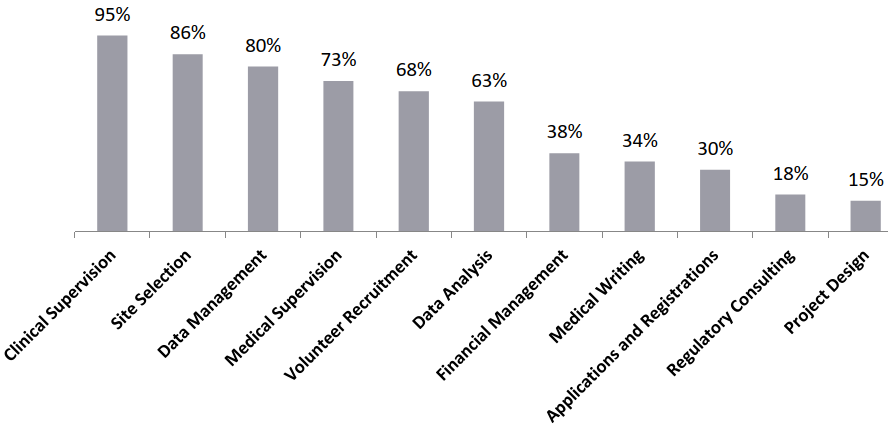
Higher outsourcing in the preclinical and generic drug space (due to higher complexity and pricing pressure): The outsourcing rate in the drug discovery stage is lower (around 18%); while, the outsourcing rate in the clinical trials phase is higher, between 25 and 50%, and the highest outsourcing is observed in the toxicology research stage (about 70%) due to increasing complexity and pricing pressures. Within the clinical trials, highest outsourcing (~78%) is observed in data analysis, volunteer recruitment, medical supervision, data management, site selection and clinical supervision segments.

Outsourcing Ratio of Each Stage of New Drug Development, 2021

Proportion of Outsourcing in Clinical Trials, By Segments, 2021
Outsourced portion of the discovery and preclinical activities captured by the CROs is expected to grow at 7% CAGR from 2021 to 2026: Discovery studies market is estimated to be USD 13.4 Bn, with 25% penetration rate, while preclinical development market is estimated to be USD 5 Bn in 2021, and 30% penetration rate.
Rising number of patent loss drive the generic drug industry thereby creating an opportunity for the CRO industry:
- Around 56 drugs lost their patents between 2020 and 2022 and around 107 drugs are losing their patents from 2023 to 2025. In 2021, expected losses of US exclusivity include Roche’s macular degeneration blockbuster drug, Lucentis. Other top drugs to lose patent include Bystolic, Vascepa, Northera, Narcan, Brovana, Sutent, Saphris, Amitiza and Feraheme.

Global CRO Market, Penetration Rate, 2018–2026
- Whilst the CRO market is expected to reach USD 90.8 Bn by 2026, outsourcing penetration is expected to increase to 66% by 2026, driving the overall growth of the Indian CRO market.
Global CRO Outsourced Market by Revenue, 2021-2026

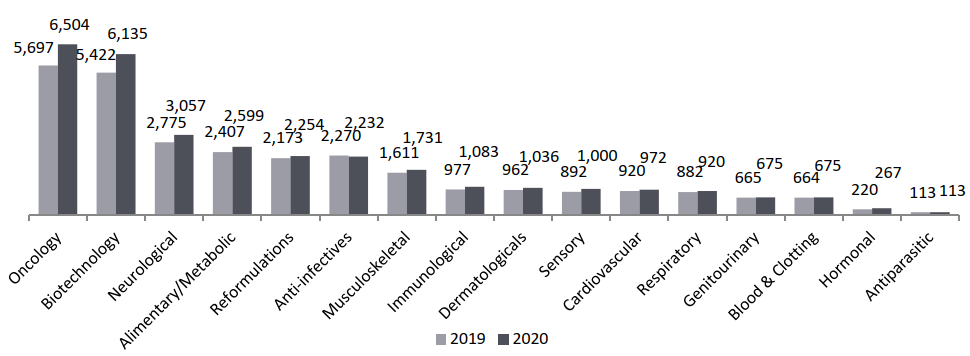
Global R&D Pipeline by Therapy Areas, Drug Count, (2020)
With 6,504 drugs in R&D, cancer drugs capture 36.7% of the total share, and the total oncology therapy area has grown by 14.2%, outpacing the overall level of pipeline expansion.
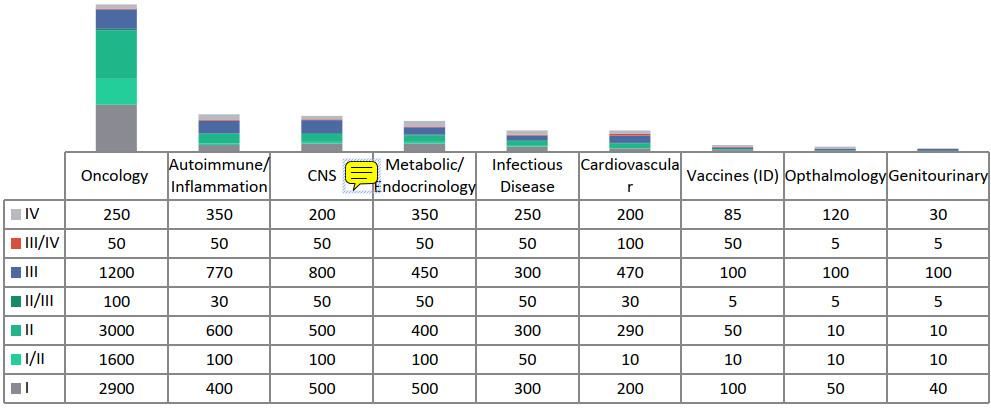
Number of active trials by phase of development, 2020

Global CRO Market (2021) = USD 63.9 Bn
Worldwide Sales at Risk from Patent Expiration (2019-2024): Patent loss of key biologics paves way for biosimilar industry and hence higher opportunity for BA/ BE Studies:

Worldwide Sales At Risk from Patent Expiration, USD
Global Clinical Trials Market Overview
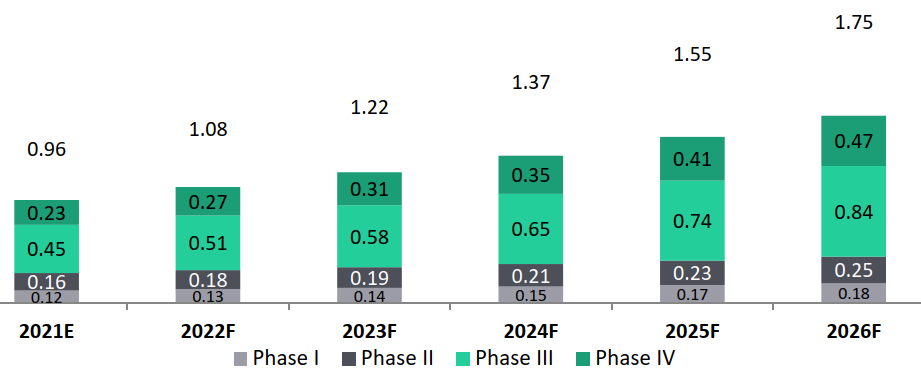
- Indian clinical trials market to surpass Global clinical trials growth rate (13% versus 8%): The global clinical trials market is estimated to grow from USD 39.8 billion in 2021 to USD 57 billion in 2026 with a CAGR of 7.5%. While, the Indian clinical trials market is estimated at USD 0.96 Bn in 2021 and is expected to grow by about 12.7% to reach USD 1.75 Bn by 2026.
- Phase III trials hold the largest market share in the Global clinical trials industry (79%). phase III trials are the most expensive ones and involves a large number of patients and a longer period of enrollment. The median cost for a single phase III trial is around USD 18 Mn.
- In the Indian clinical trials market, phase III trials captures about 46% market share, phase IV trials with 24% share and phase II trials with 17% share.
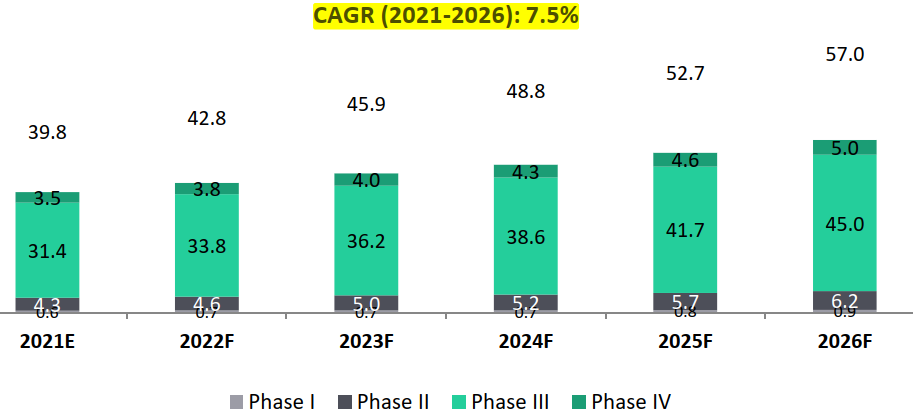
Global Clinical Trials Market, 2021-2026, USD Bn
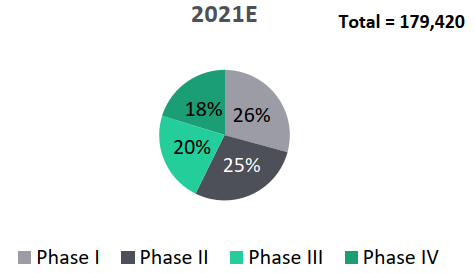
Segmentation of Global Segmentation of India Clinical Trials
Clinical Trials by Phase, By Volume by Phase, By Volume

India Clinical Trials Market, 2021-2026, USD Bn CAGR (2021-2026): 12.7%

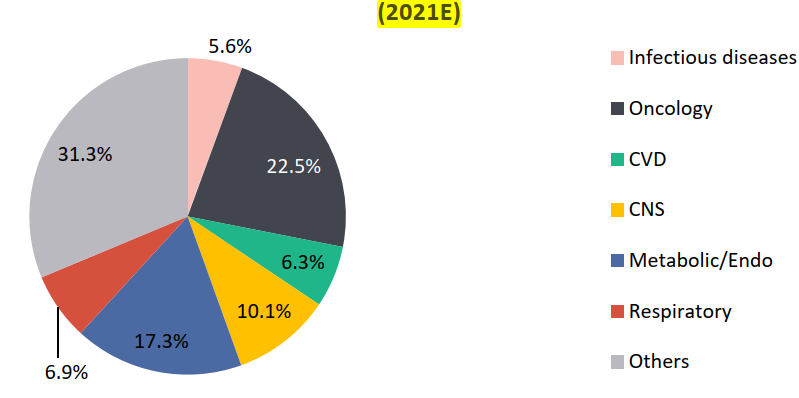
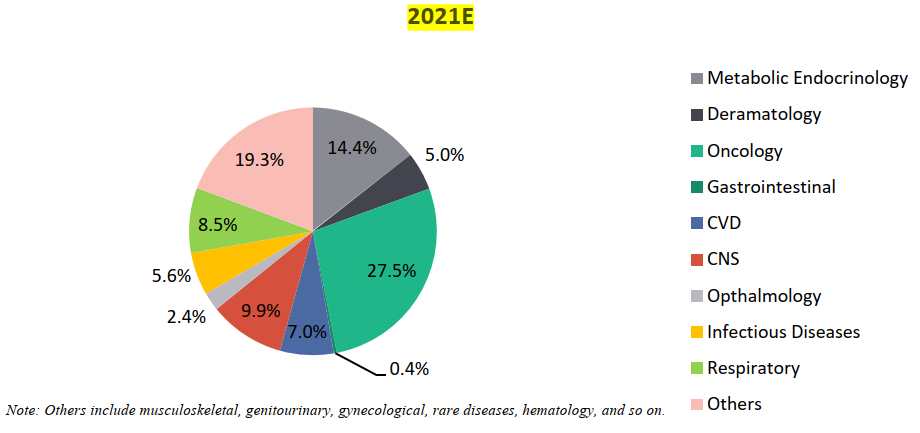
Segmentation of Clinical Trials by Therapy Area, By Volume
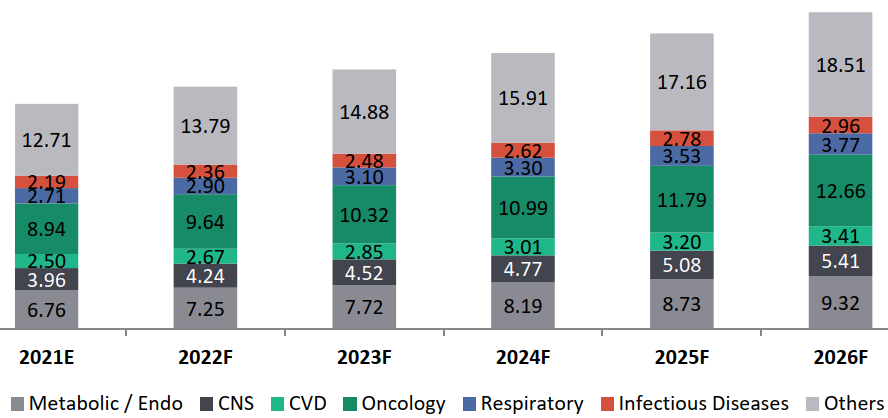
Global Clinical Trials Revenue Forecast by Therapy Areas, 2021-2026, USD Bn, CAGR (2021-2026): 7.1%
Opportunities in the Clinical CRO Market
North America:
- North America (NA), the home for some of the leaders of the CRO Industry, is the most dominant market with a high adoption potential for technologies, such as AI and machine learning, therefore, creating greater opportunities for digitization in the CRO industry.
- Companies such as IQVIA and Parexel are among the two big CROs with in-house digital solutions for clinical research.
- Niche Therapeutic Focus: The region is witnessing the rise of niche CRO participants with focus on specific therapeutic areas, pertaining not just to oncology but also rare diseases, ophthalmology, etc
Europe:
- Europe is set to surpass the North American CRO industry with the highest clinical trial volume in the next five years.
- Eastern and Western Europe: With more than 15,000 trials in Europe alone, the region is already breaking tradition by emerging as the leading location for clinical research. Countries such as Lithuania, Romania, and Poland provide a huge cost advantage of 45% to 50% or more compared to the US, thereby, making the region highly profitable for outsourcing.
- Advanced Clinical and Non-clinical Infrastructure: The presence of bigger industry participants, such as Covance, IQVIA, and Icon plc, allow for a well-established infrastructure of central laboratories, therefore, contributing to a higher share in the clinical CRO market.
APAC:
Asia-Pacific CRO market at a strong 10.9% growth: the emergence of numerous regional and local participants alongside global CRO participants, is expected to boost the Asia-Pacific CRO market at a strong 10.9% growth.
Specific Therapeutic Focus: Asia-Pacific has very high cases of cancer such as breast and lung cancer, alongside diabetes and other metabolic conditions. Therefore, oncology and metabolic diseases trials have the highest volume compared to other therapy areas, thus, capturing the highest CRO market share in the region.
Global Preclinical and Discovery Services Overview
Discovery and Preclinical CRO Services Market: Global Revenue Forecast, 2021-2026, USD Bn, CAGR (2021-2026): 10.4%
Across critical non-clinical activities, Chemistry Manufacturing and Controls (CMC) account for the highest cost share of 45% to 50%, followed by toxicology studies capturing more than 20% of the non-clinical study budgets. Additionally, data management, which is crucial to these studies, further accounts for 10% to 12% of the study costs.
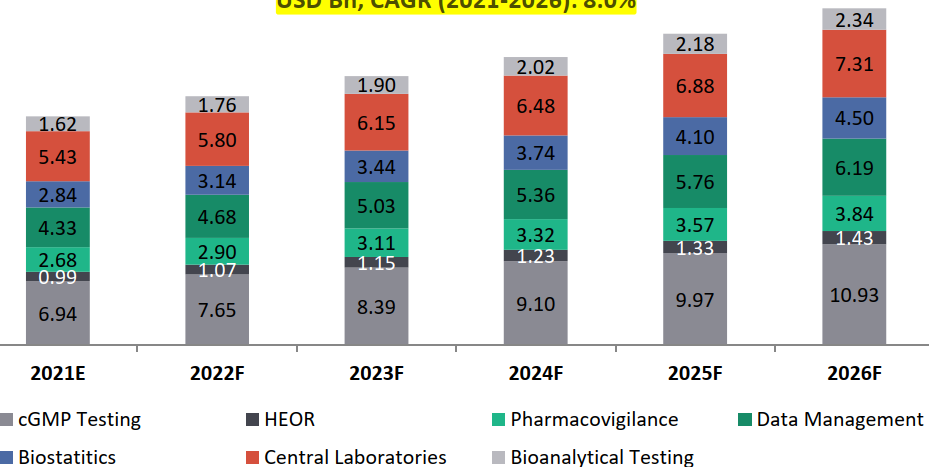
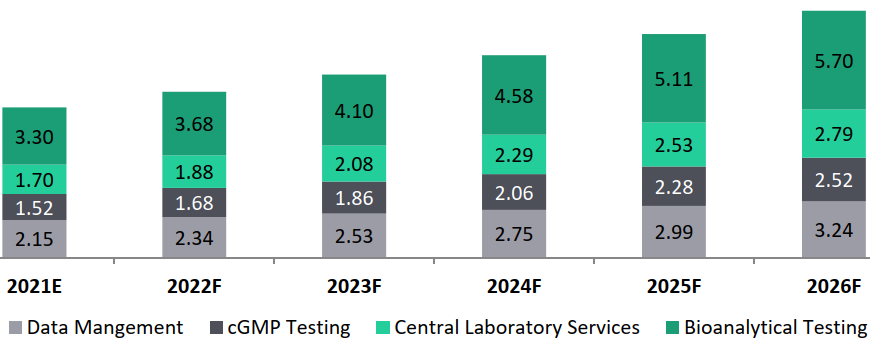
Global Clinical CRO Services Market Estimates, 2021-2026, USD Bn, CAGR (2021-2026): 8.0%
Global Bioavailability (BA)/ Bio-equivalence (BE) Market Overview
- India is one of the top five manufacturers of bulk drugs in the world and ranks amongst the top 20 pharmaceutical exporters in the world. Every fifth application for marketing a generic drug in the US, the world’s largest pharmaceutical market, is filed by an Indian company; thereby creating a great opportunity for Indian CROs in the BA/ BE segment.
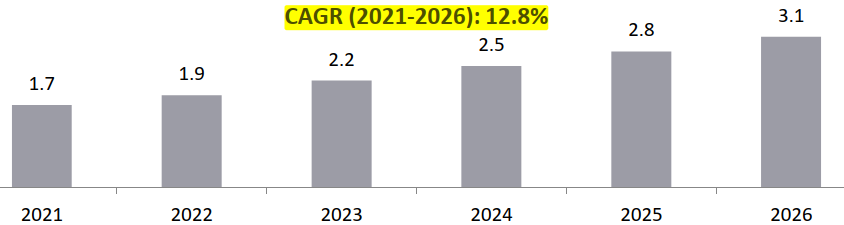
- The BA/ BE market in India is expected on a higher growth trajectory as compared to the global trends (13.4% vs. 12.6%): The global BA/ BE market is estimated to grow from USD 1.7 Bn in 2021 to USD 3.1 Bn by 2026 at a CAGR of about 12.6%. The BA/ BE market in India is estimated to grow from USD 0.4 Bn in 2021 to USD 0.8 Bn by 2026 with a CAGR of 13.4%
- India accounts for 20% of global generic drug exports and captures 70% of the global generic drug market share by revenue.
- BA/ BE studies expected to be made mandatory for all the approved drugs in India further driving the market growth: Though the pandemic has temporarily hampered the growth of the BA/ BE studies market, this segment is expected to see a double digit growth amidst the growth factors stated above as well as BA/ BE studies expected to be made mandatory for all the approved drugs in India as the Indian government is evaluating steps to promote generic versions of all medicines as a cost-containment strategy.
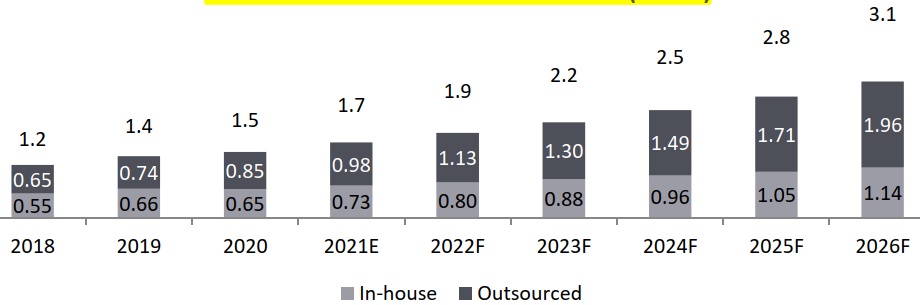
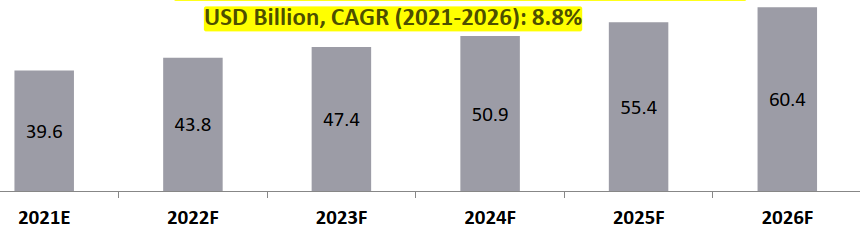
- BA/ BE Market, 2021-2026, USD Bn
- Global: CAGR 2021-2026 (12.6%)
- Outsourced Business CAGR 2021-2026 (14.8%)
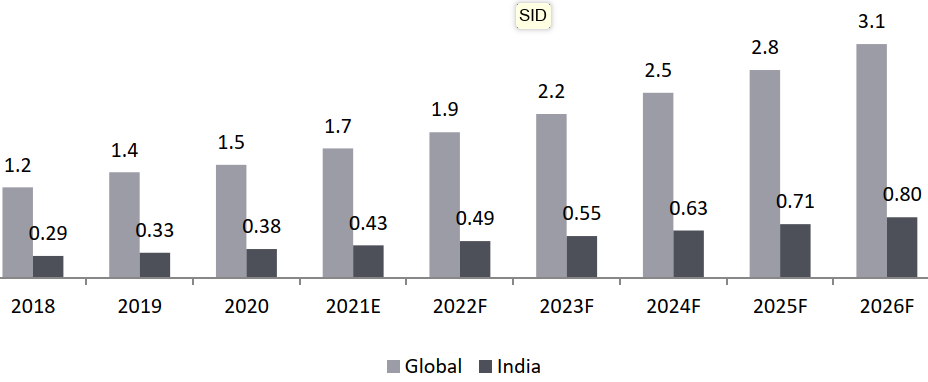
BA/ BE Market, 2021-2026, USD Bn Global: CAGR 2021-2026 (12.6%) India: CAGR 2021-2026 (13.4%)
Global Overview of Biosimilars Market:
Biosimilars Segment: Market Estimates (2021E-2026F)
The global biosimilars market is expected to witness its highest year-on-year growth rate during the forecast period of about 17.3% between 2021 and 2026.
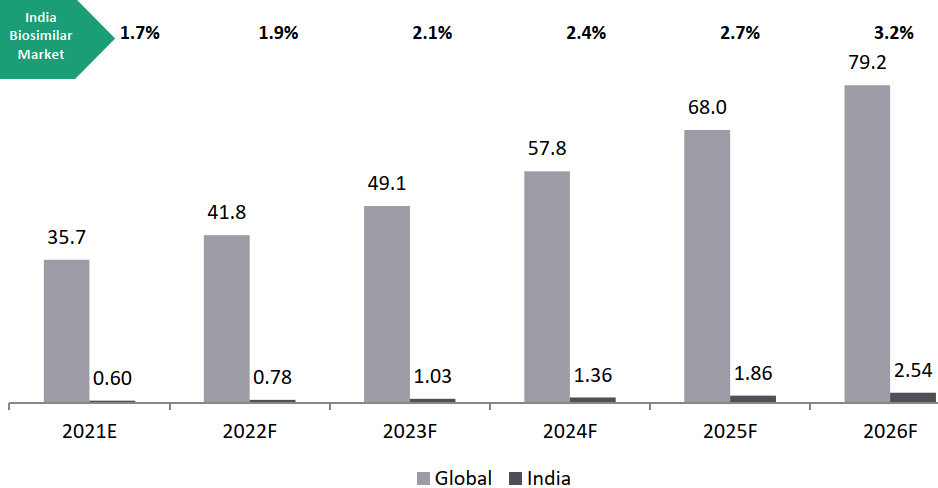
Biosimilars Market Estimates, 2021-2026, USD Bn, Global CAGR 2021-2026: 17.3% and India CAGR 2021-2026: 33.5%
Global Overview of Preclinical Research Market
- Preclinical research segment captures about 8% of the total global CRO market and is expected to witness 10.3% growth over the next five years (2021-2026). This is driven by increased outsourcing of early-stage activities by small-to-mid segment pharmaceutical companies. North America and Europe are the key dominating segments for discovery and preclinical research, with more than 50% of the market for early-stage drug development, as most of big CRO participants function in these regions, followed by APAC.
- Rising patent cliffs leads to increased outsourcing in this segment: The preclinical market is expected to show an robust double-digit growth of 10.3% between 2021 and 2026.
Global Market Overview of Specialized Services in the CRO Industry
(Inhalation, Suppositories, Glucose Clamps, Patch Studies, Medical Reports, Pharmacokinetics, Pharmacovigilance, Pharmaceuticals only)
The Indian CRO market for specialized services is estimated at USD 0.91 Bn in 2021 and is expected to grow at about 12.5% in the next five years to reach to about USD 1.65 Bn. Indian CRO players like Veeda are also developing capabilities and focusing on these specialized categories.
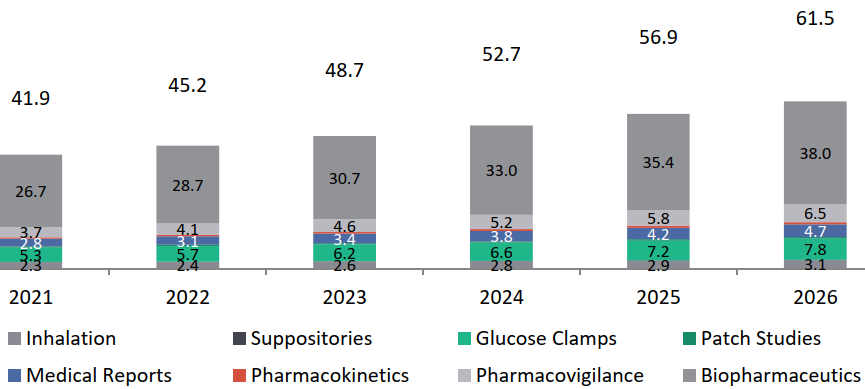
Specialized Services Global Market for CROs, USD Bn, 2021-2026, Global CAGR 2021-2026: 8%
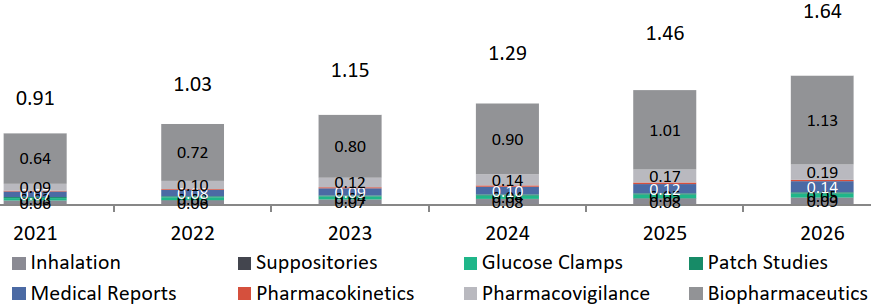
Indian Specialized Services Market for CROs, USD Bn, 2021-2026, India CAGR 2021-2026: 12.5%.
Indian Players in CRO Business
- Vimta
- Veeda
- Lambda and many more…