I was always amazed at how Prof. Aswath Damodaran could find methods to Value anything that moves (Kidding, of course). One of those moments came a few months back, when I saw and read the way he came with an innovative method to Value the S&P 500 Index based on a sort of Dividend Discount Model: Valuing the S&P 500
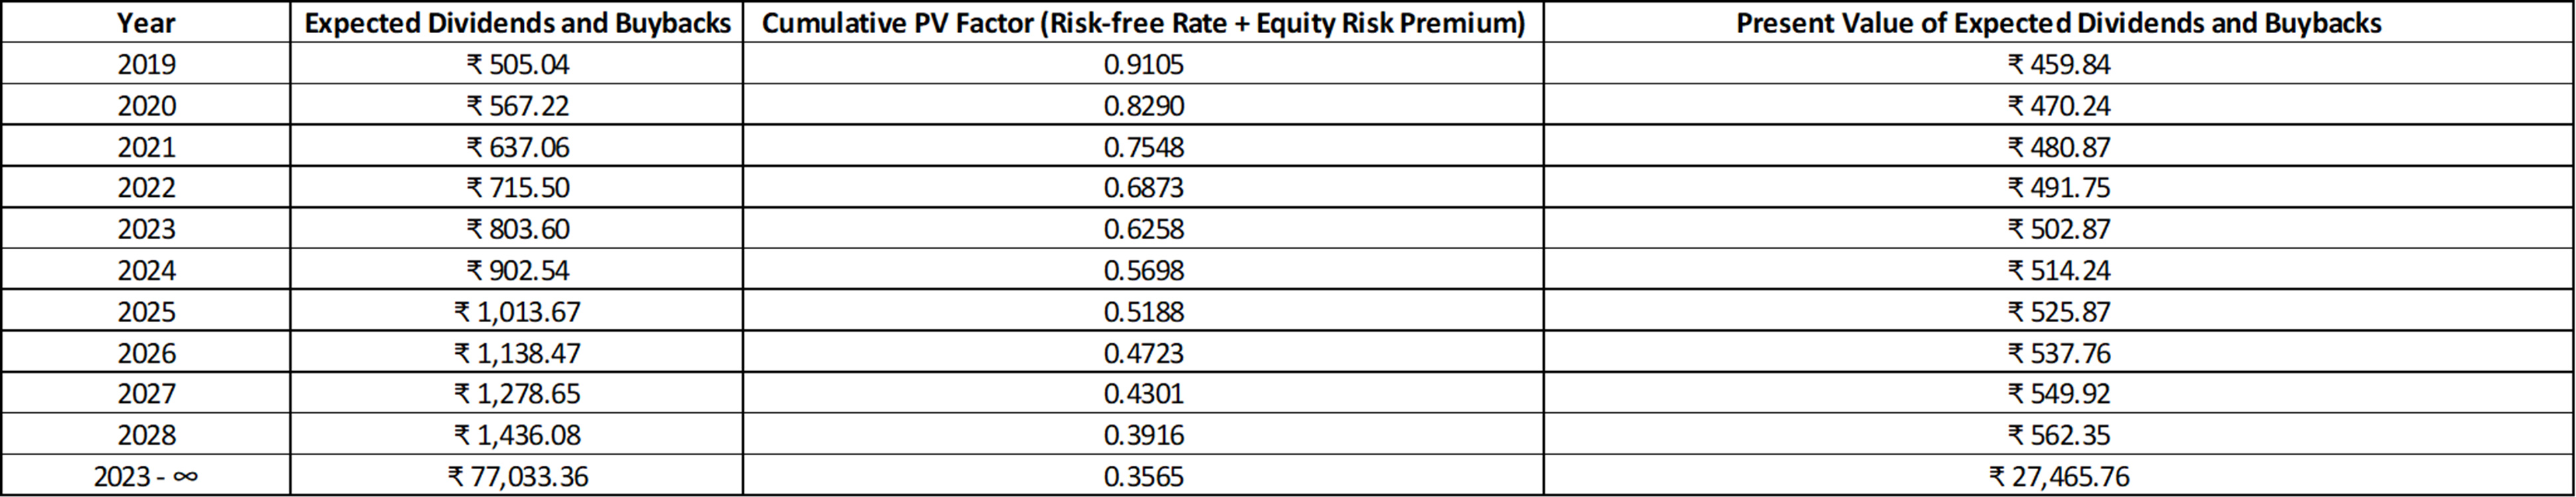
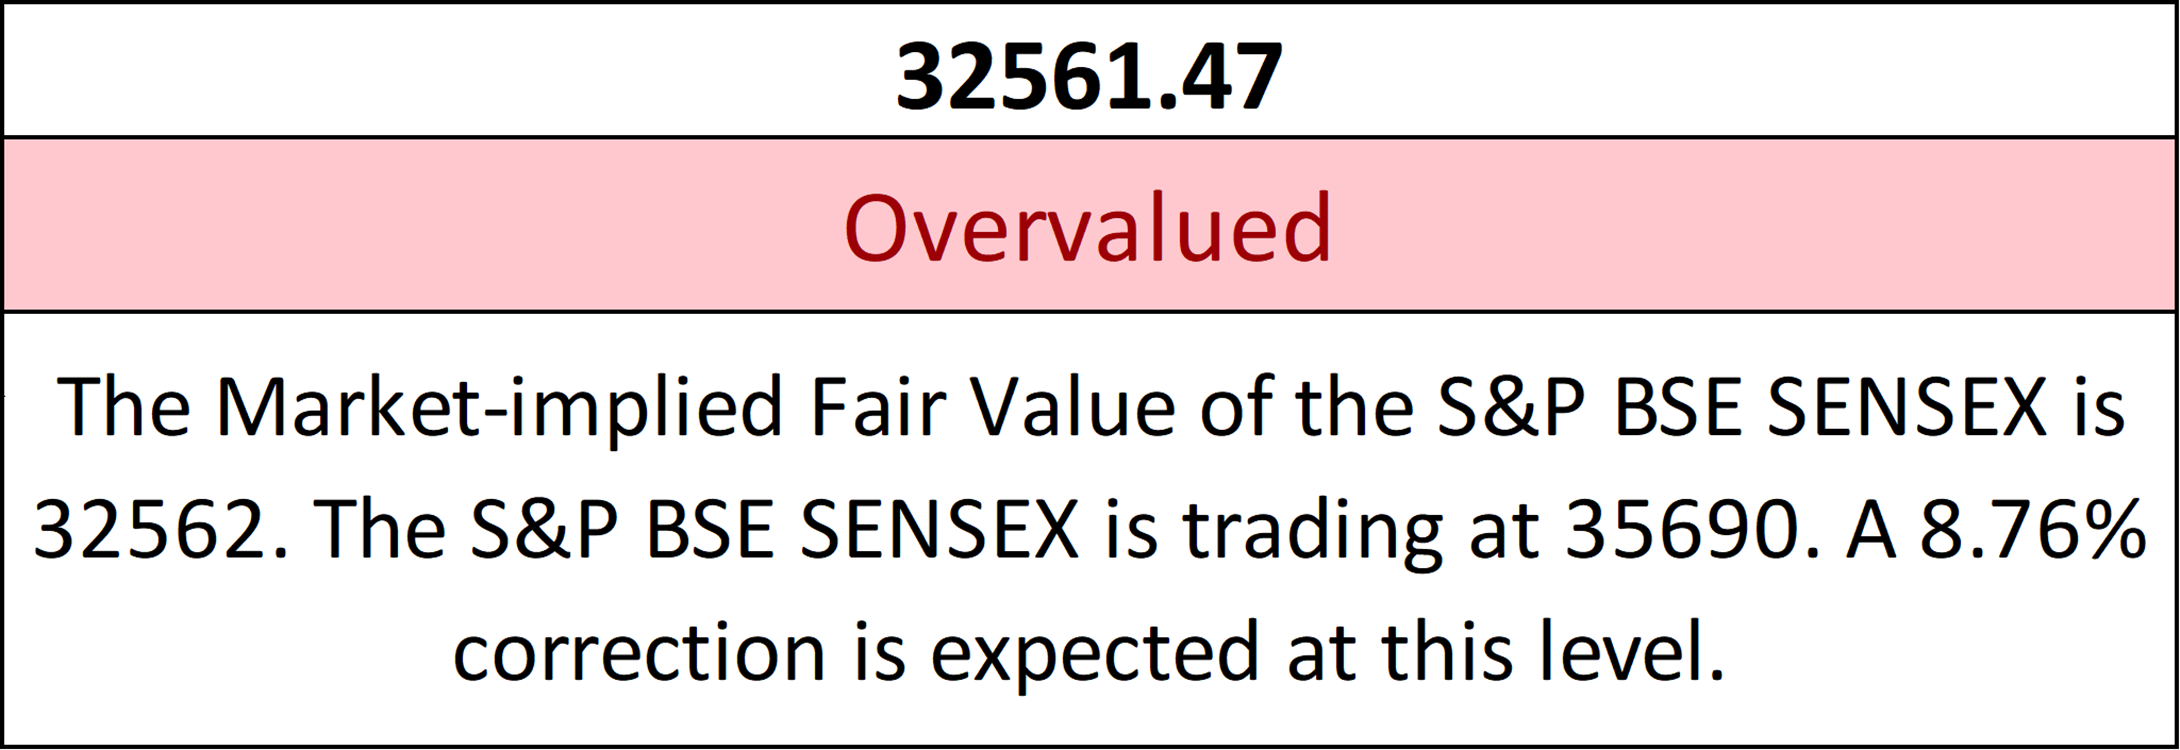
After many months of idle admiration, here’s my naive attempt at replicating that model. I have tried to find the Market-implied Fair Value of the S&P BSE SENSEX using market metrics like Dividend Yield, Risk-free Rate and Equity Risk Premia. All comments and criticisms are solicited.
The Model (You can download the file via File → Download As)
I also made a blog post on the same:
What with debates raging on about whether the broad market indices are overvalued are not, I thought this would be the perfect time to do this. I hope this sparks some interesting conversations.
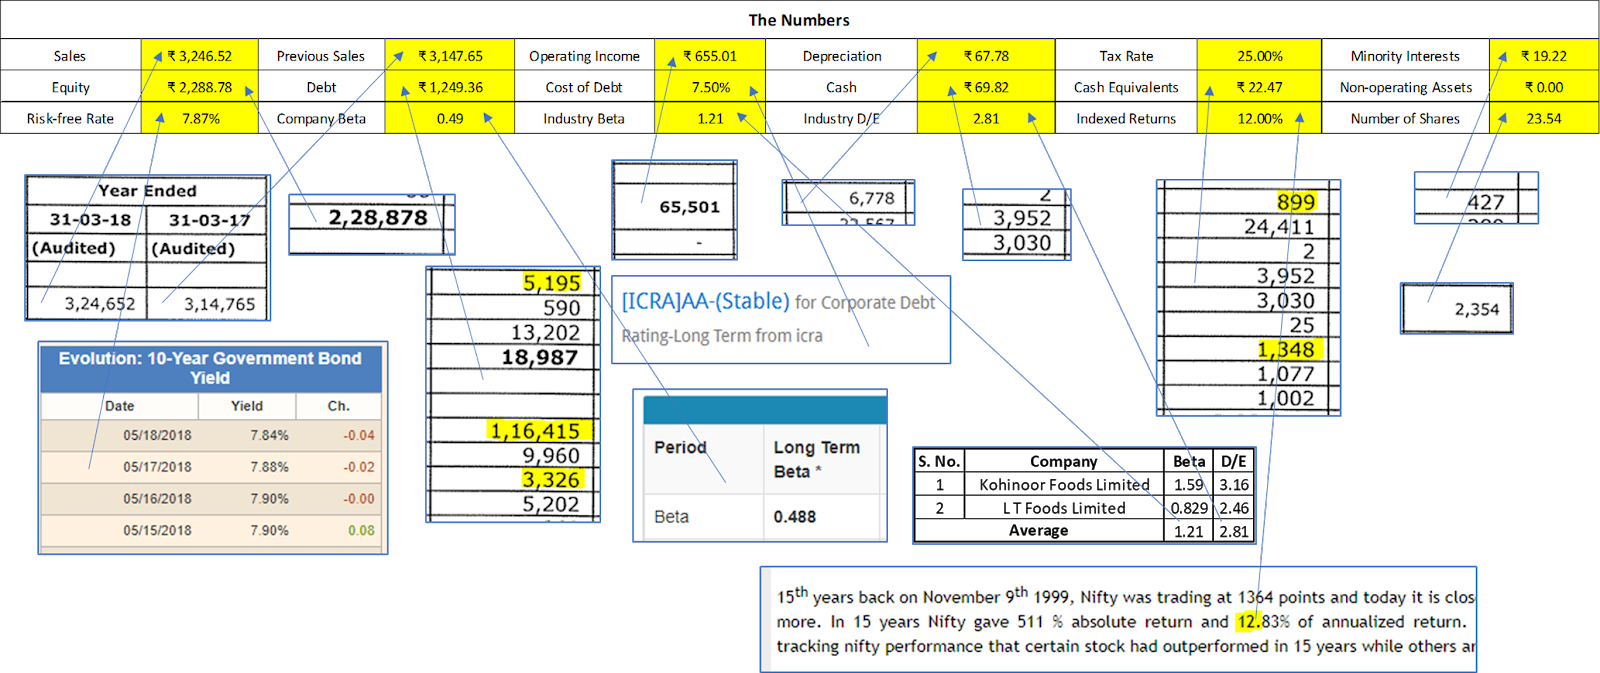
Sales
Previous Sales
Operating Income
Depreciation
Minority Interests (Actual Minority Interests of 4.27 multiplied by 4.5, the Basmati Rice industry’s average P/B Ratio)
Equity
Debt
Cash
Cash Equivalents
Number of Shares
Tax Rate (Assumed at 25%, the Corporate Tax Rate in India)
Indexed Returns (Long-term CAGR of NIFTY chosen over the short-term CAGR which is too high at 25%+)
If you still have doubts regarding a specific figure, please reach out to me,