I am a big fan of the Graham Formula and have been working on modifying it for use in the current times. For those of you who are not familiar with it, the formula is -
Price = EPS*(8.5 +2G) where
8.5 - Price of a stock with zero growth
2 - Premium on Growth
G - Growth rate for the next 7-10 years
In essence, it is multiplying the EPS by PE where the PE is
PE - 8.5 + 2G
So the 2 variables that should be altered are the 2 and the 8.5.
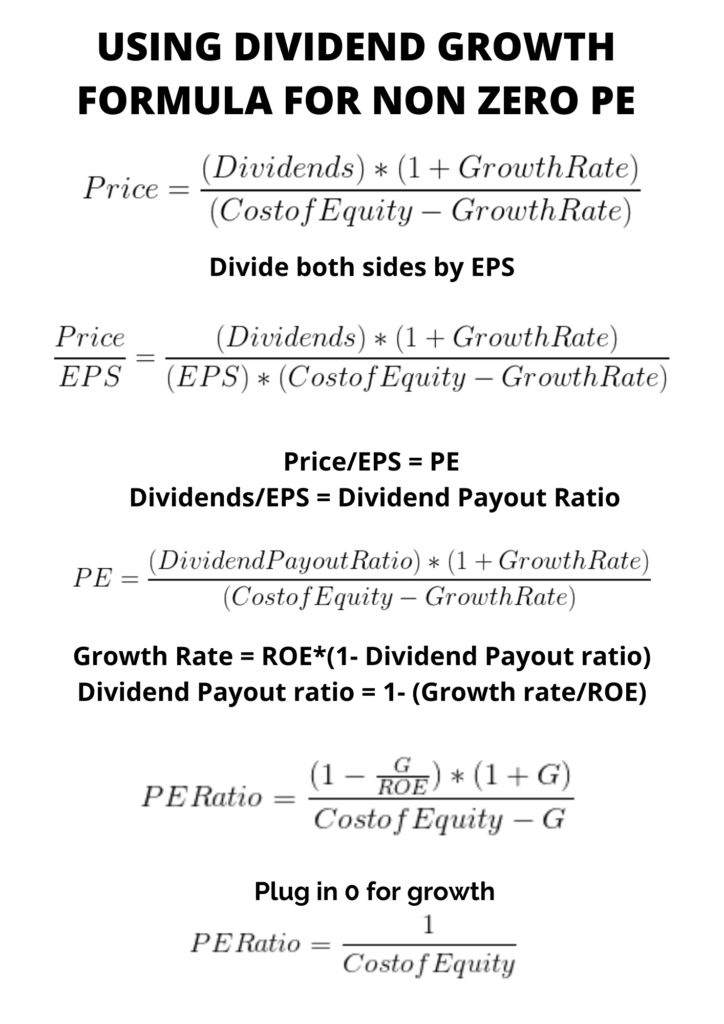
As for the 8.5, it basically translates to 1/Discount Rate. The image below shows how I get there.
That makes the formula
Price = EPS*((1/Discount Rate) + (Growth Premium * Growth Rate))
The Growth Premium is what is tough to calculate. Its a premium on growth. If we look at historical data for Nifty anywhere between 1.7 - 2 makes sense. Furthermore with QE asset inflation is to be expected which should keep the premium in that range for the Indian market as a whole.
However certain sectors operate at higher premiums. (Consumer durables for instance) . One option is to divide Nifty by Sector PE ratios. Nifty is assumed to be running at a premium of 2.
So for example, if Nifty is trading at 20 and Consumer durables at 40 that is a premium of 2 (40/20) on top of the regular premium. Now one could just make the premium 4(2*2) for consumer durables but this would not work as now you are factoring growth twice. (There is a reason why the Consumer durables is trading at a higher PE)
I am still thinking of how to make it better and hence was curious if anyone has looked into this and uses it to price stocks as an addition to a DCF. I have an article on the same.
Thank you in advance and sorry if I made some mistake while posting this. This is my first post here.
This is an excellent post, it is the first time I am coming across such a formula as I haven’t read any book of Benjamin Graham except for the first few chapters of Intelligent Investor. As such, can you throw some light on why Graham took the number to be 2 as premium ? Secondly, why you want to alter this number ?
Thanks for the reply. It is mentioned in one of the revised editions of Intelligent Investor if I am not wrong.
So If we look at the US Market (S&P 500) over the decade the average PE is around 21. At the same time the discount rate for the US market is roughly say 8%. Could be more or less but as a very rough estimate take 8%. That gives us a non growth PE ratio of (1/8% ) that is 12.5.
So now, in the last decade the US market has delivered close to 8% annualized. (rough estimate again have not altered it to the exact return as of now).
However if we then apply and solve it back for the growth premium
This is lower compared to the Graham premium of 2 for the US market.
Now of course if not for the crash we can see that the PE ratio has been increasing over the years, which would give a larger premium.
The Indian market if we do the same gives us somewhere close to 1.7 -2. According to me with time the premiums do change simply because more money is being pumped into fewer stocks which leads to asset inflation.(not an expert of course)
This though is for indexes and certain stocks just warrant a higher premium due to their growth or other factors. For all those reasons I think the premium should be calculated again.
However I have not come across any “right way to do it”. 2 all said and done is still a decent estimate, especially for the Indian market.
This is very interesting formula. Can you please tell us what the growth rate means. Is it company’s growth or index growth. I feel it should be company’s growth. In that case, which growth like revenue /PAT. Please help
Thanks for explaining those calculations. Did Graham also calculated this growth premium the way you mentioned ?
This is definitely interesting, however the fundamental problem I am having with this apporach is the dependence of growth premium on market sentiments. If we are calculating this based on how market is valuing an index or a sector, then it will paint a very misleading picture. The sectors at fancy today may not be fancied tomorrow.
However, I think it can be a useful tool to determine current exit pe.
Graham did not mention how unfortunately and you are very right. This is more pricing than valuation. I find it useful as a screen at times but of course, any method to better calculate a growth premium for a stock will be really useful.
I’m assuming everything will go back to normal in 2 years. So what I’m doing is I’m calculating EPS of the companies I want from FY18 and calculating their fair value back then. Buyingthem when they are at a discount to this fair value as a margin of safety and then buying more on dips if any. Working out pretty well. I’m just assuming I’m in the year 2018 and I’m finding bargains this way
That being said I’m just using the basic formula ie eps*(8.5+ 2g). For example… take the travel industry…not expecting it to reach normal levels for 2 years. So I’m taking the EPS of these companies from 2 years ago. For eg. the EPS of VIP was around 8 in FY18. Assuming 12 to 15 percent growth historically it’s fair value comes to between rs. 275 to 324. I then take the average ie 300 in this case as the fair value. And buy the stock using a margin of safety of 20% to 30%(bought today at 239). The weird thing is it’s almost like the market is using this calculation since most shares bottomed out at their FY2018 - 30 percent calculation. Maybe just a weird coincidence but I like following this method. There’s no rule book for times like these so Im creating my own for my own sanity
I agree. I use 7.14 (1/14%) rather than the 8.5 cause I think Indian companies are still riskier. Adjusting the EPS right now is a good fix. I too have been using EPS from a year or two back, similar to what you mention. (or just reduce it by 15% or more, depending on company)
The 2 works for most companies and sectors. Its just certain ones, especially consumer durables where I think it makes everything seem overpriced, unless ofcourse you are inputting something like 20 for growth.
Yup. I change growth based on segment … the good thing is we can look backwards and see the growth companies actually achieved from FY18 to Q3 FY20. I then take the growth from FY15 to FY18 and average it with the post FY18 growth. So the growth rate is more stock specific than industry specific. Makes more sense to do it this way. If I change to 7.14 I fear I’ve missed out on all the bargains since that would put everything near march end bottoms … so sticking to 8.5 for now
The Graham Ratio is a good rule of thumb. But it has some obvious flaws:
It ignores Length of High Growth Period (or) Length of Competitive Advantage Period (i.e. Period in which the company can earn Returns on Capital above the Cost of Capital)
It ignores Redundant Assets (Assets which are long since written off the Books or those that don’t contribute to the P&L. For instance, Land).
P/E or anything involving Accounting Earnings are poor proxies. Free Cash Flow should be used instead (Here, I guess you can substitute P/E by P/FCF).
Risk of Default. If a company had High Debt, the Interest payments will reduce the Earnings/Cashflows, but it still doesn’t include the Risk of Default which is captured by the Market Yield or Cost of Debt. I generally ignore Interest Payments from my FCF Calculations. Then I convert Book Debt into Market Debt using the Cost of Debt and deduct it from the final Value (Ex: A company may be paying 8% interest on existing Book Debt, but if their Yields are 10% in the market - their Risk of Default has increased and so I should account for it by marking up the Book Debt amount. I will mark it down if Yield has reduced to 6%).
If we do enter into a Great depression like phase (which I hope is not the case), this thread will lead VP for the next couple years. Benjamin Graham developed most of his theories during the great depression and his techniques might be most useful in an elongated depression.
If we dividing it into high growth and normal growth and then terminal value then FCFF or FCFE is the way to go as long as the assumptions in the DCF are decent.
Agreed
Most definitely but even in FCFF or FCFE you rely on basic accounting earnings. Sure you can capitalize leases and R&D like Aswath Damodaran shows us in his book and get a somewhat better estimate but there is no way one can avoid accounting earnings all together.
This is probably the only part I disagree with. This can be captured in the discount rate or WACC.(somewhat) Since the zero growth PE is (1/ Discount Rate) as long as you calculate the discount rate correctly you are incorporating some sort of risk.
I think you can look at Interest Coverage ratios to get a decent idea about a cost of debt.
All in all I agree. Nothing beats a good DCF, if one spends the time on it but I do think that the Graham Formula modified can be really useful.