[Tool Launch] Free Chrome Extension: Transform Screener.in Data Into Professional Charts Instantly (Zero Data Collection)

Hi @Swadesh9819, thanks for trying it out!

You’re right — the panel currently doesn’t support drag or full-screen mode. Here’s what’s available in the current version:

Width Toggle (v2.2.0 — coming soon): The next update (currently in review) adds a width toggle button in the panel header. It switches between Normal (1100px) and Wide (1400px) mode,
giving you ~300px extra space. Your preference is saved automatically.

Minimize/Restore: Click the minimize button (top-right of the panel) to collapse it, and click the floating button again to restore it.

Drag and full-screen are great suggestions — I’ll add them to the feature list for a future update. In the meantime, the wide mode in v2.2.0 should help quite a bit, especially for the
Charts and Valuation tabs where more width really matters.

Thanks for the feedback!

1 Like

@vavazzodu Great catch, thanks for reporting this! You’re absolutely right — the newer tabs (Quick Analysis, Calculated Ratios, Price Analysis) are missing the visible scrollbar. The
content does scroll if you use your mouse wheel or trackpad, but unlike the Charts tab which has the thick blue scrollbar, the newer tabs were using the browser’s default thin/invisible
scrollbar.

I’ve already fixed this — the next update will have a consistent visible blue scrollbar across all tabs. Appreciate the feedback!

2 Likes

Thanks for the reply. I am not able to scroll via mouse; also, when I try to scroll, it is scrolling the background screener page, not the Finmagine tool window. Can you confirm if it is working via the mouse wheel or the mouse pad

1 Like

@vavazzodu Great catch, and thanks for the detailed follow-up! You’re right — the mouse wheel was scrolling the background Screener page instead of the Finmagine panel. This was a
confirmed bug.

Root cause: The scroll-forwarding logic was only wired to the Charts tab. When you were on Quick Analysis, Calculated Ratios, or Price Analysis, wheel events weren’t being captured by the
extension, so they fell through to the Screener.in page behind it.

The fix (coming in the next update):

  1. Visible scrollbars — all analysis tabs now show a styled blue scrollbar (matching the Charts tab)
  2. Mouse wheel scrolling — wheel events are now properly captured and routed to whichever tab is active
  3. Both trackpad and mouse wheel work across all 5 tabs

This fix is ready locally and will ship in the next version (v2.3.0) once the current v2.2.0 update clears Chrome Web Store review.

In the meantime, the workaround is to use the scrollbar directly (click and drag) or use keyboard navigation (Tab/Arrow keys) within the panel.

Appreciate you reporting this — it’s exactly the kind of feedback that makes the tool better for everyone!

Scrolling is not working, and I don’t see the option of valuation tab

Hi @karanshah137, thanks for reporting this!

Valuation Tab: You’re currently on v2.1.0 — the Valuation tab is part of v2.2.0 which has been submitted to the Chrome Web Store and is currently under review. Once approved, Chrome will
auto-update the extension and you’ll see the new Valuation tab (with PE, EV/EBITDA, Price/Book, Mkt Cap/Sales multiples, sector-aware verdicts, PEG Ratio, and NIFTY 50 benchmark
comparison). No action needed on your end — it will just appear!

Scrolling: This is a confirmed bug that has already been fixed in the next update. The fix ensures mouse wheel scrolling works smoothly across all tabs (Quick Analysis, Calculated Ratios,
Price Analysis, and the upcoming Valuation tab), not just the Charts tab. This fix will ship shortly after v2.2.0 is approved.

Appreciate your patience — both issues are addressed and on the way to you soon!

2 Likes

Global/US Stocks Breakthrough

All Five Tabs now work for Global/US Stocks! Charts, Quick Analysis, Calculated Ratios, Price Analysis, and Valuation are now fully supported for Global/US-listed stocks via stockanalysis.com — with 5 years of financial data (free tier).

Global/US stocks also get bonus insights: Altman Z-Score, Piotroski F-Score, Analyst Consensus, ROIC-WACC spread, and Institutional/Insider ownership data.

Just visit any stock on stockanalysis.com (e.g., stockanalysis.com/stocks/aapl/) and click “Visualize with Finmagine.”

Availability: v2.2.0 (Valuation Tab for Screener.in) is currently under review by Google. Once approved, I’ll submit v2.3.0 with US stock support + other improvements. Chrome Web Store
reviews typically take about a week.

2 Likes

Finmagine Chart Builder v2.2.0 Live + v2.3.0 (US Stocks) Submitted + New AI Advisor Extension

Quick update for those using the Finmagine Chart Builder on Screener.in:

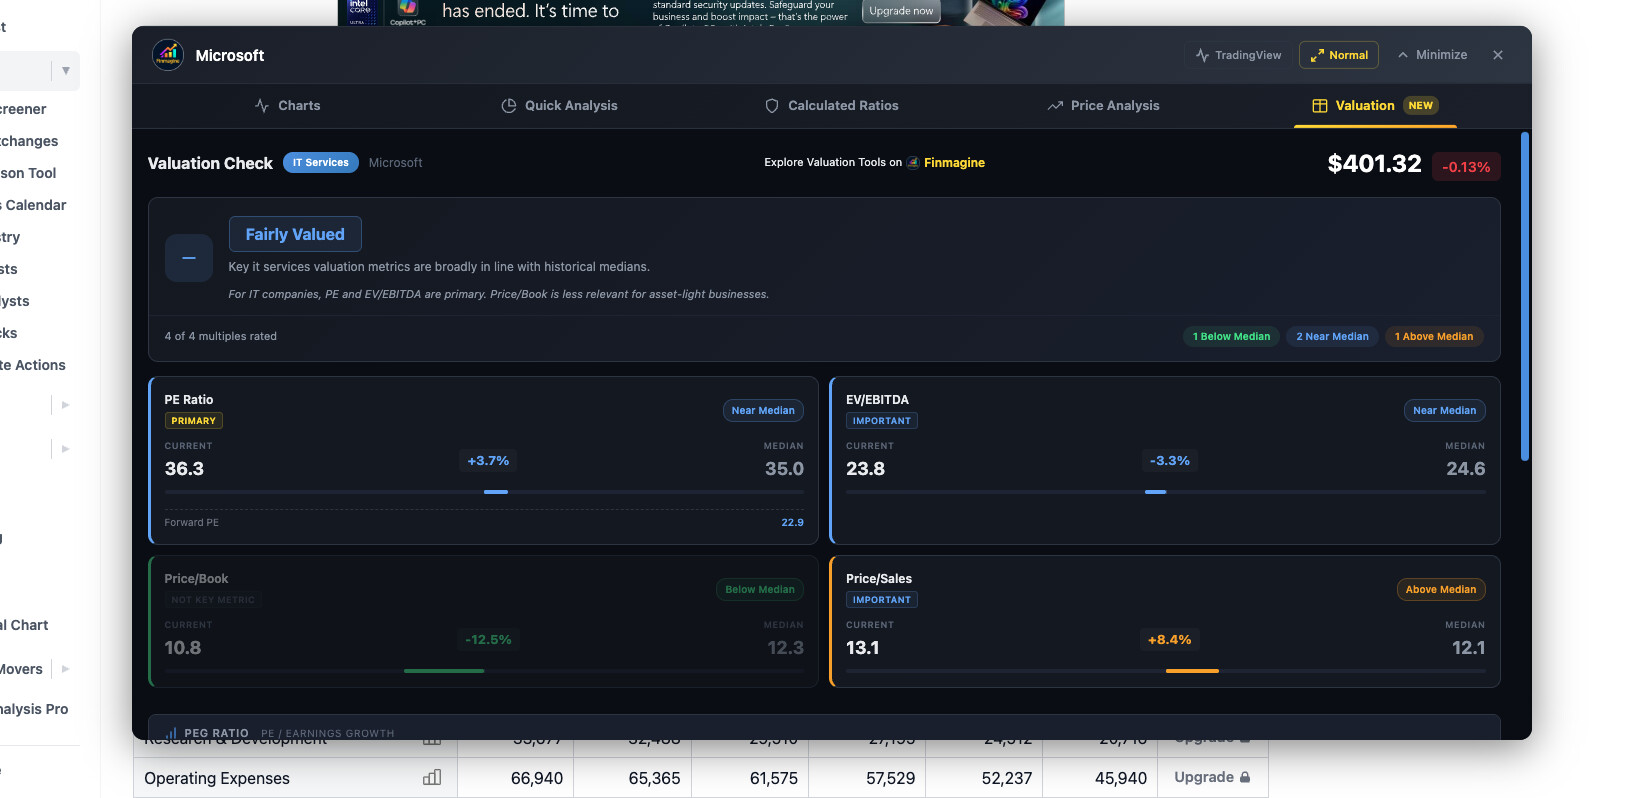
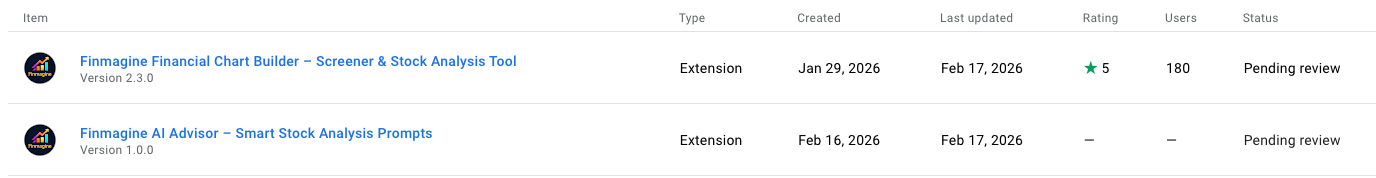
v2.2.0 is now published (180 users, 5.0 rating). The headline feature is the Valuation Tab — a sector-aware valuation framework that:

  • Pulls 4 historical multiples (PE, EV/EBITDA, P/B, Mkt Cap/Sales) using Screener.in’s chart API
  • Compares current values against 5-year medians
  • Applies sector-specific weightings (Banks: P/B primary, PE ignored. Metals: EV/EBITDA primary. IT: PE primary. 19 sector groups total)
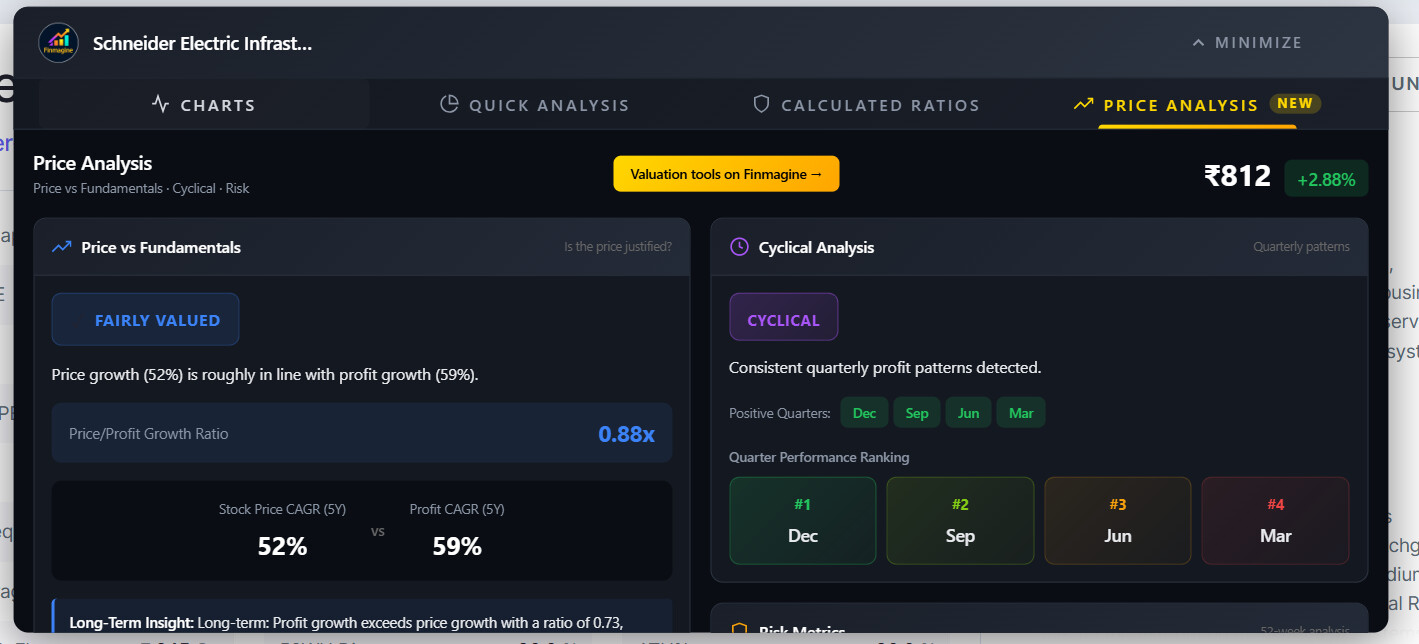
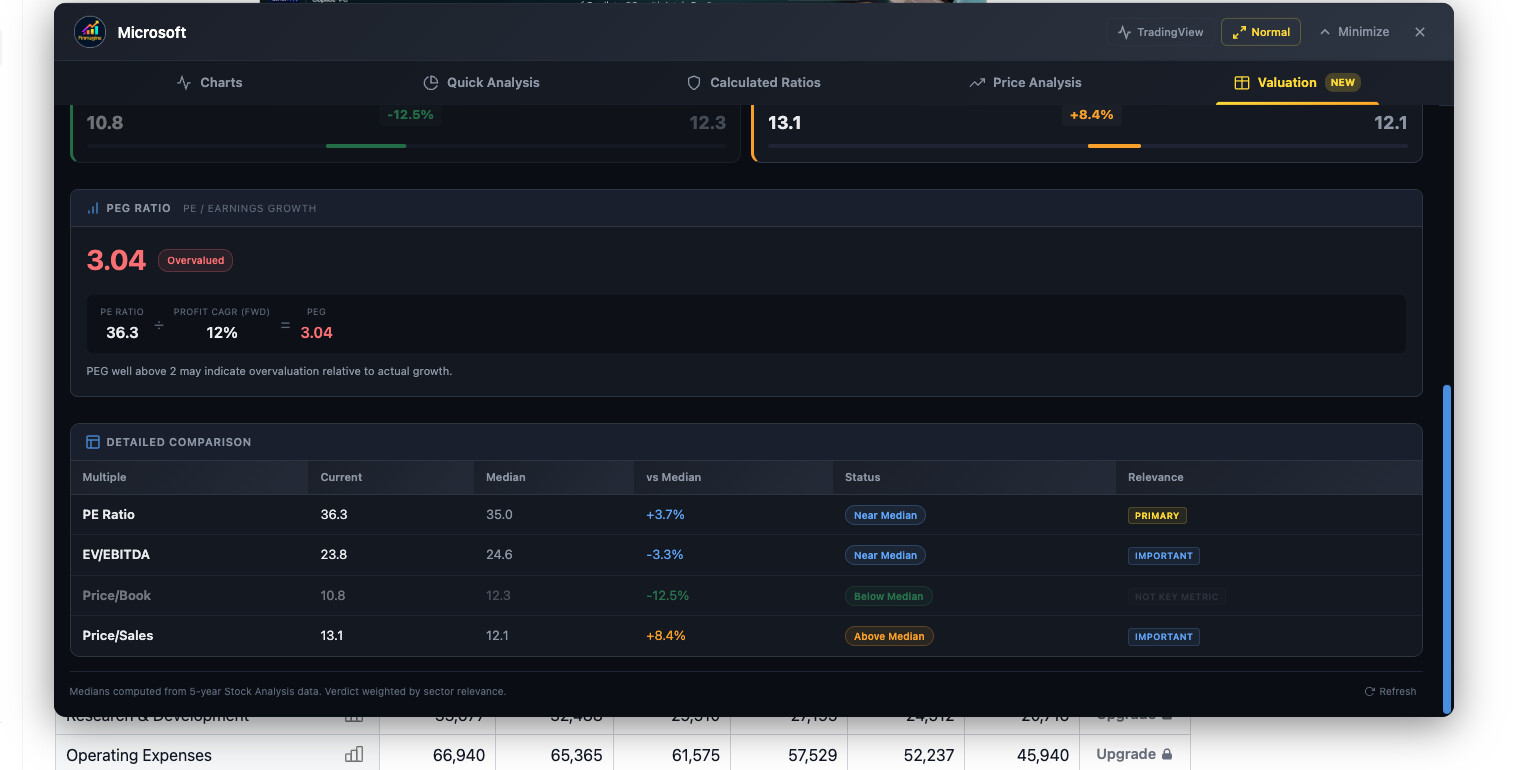
  • Calculates PEG Ratio (PE ÷ Profit CAGR)
  • Benchmarks against NIFTY 50
  • Delivers one verdict: Undervalued / Fairly Valued / Premium Priced

The weighting system matters because a bank trading at 30x PE isn’t necessarily expensive — PE is the wrong lens for banks. The framework applies the right metrics for each sector
automatically.

Valuation Tab deep dive: Valuation Tab Deep Dive: Sector-Aware Stock Valuation Framework | Finmagine Chart Builder
Complete v2.2.0 tutorial: Mastering Finmagine Financial Chart Builder v2.2.0: The Complete 5-Tab Deep Dive Tutorial | Finmagine

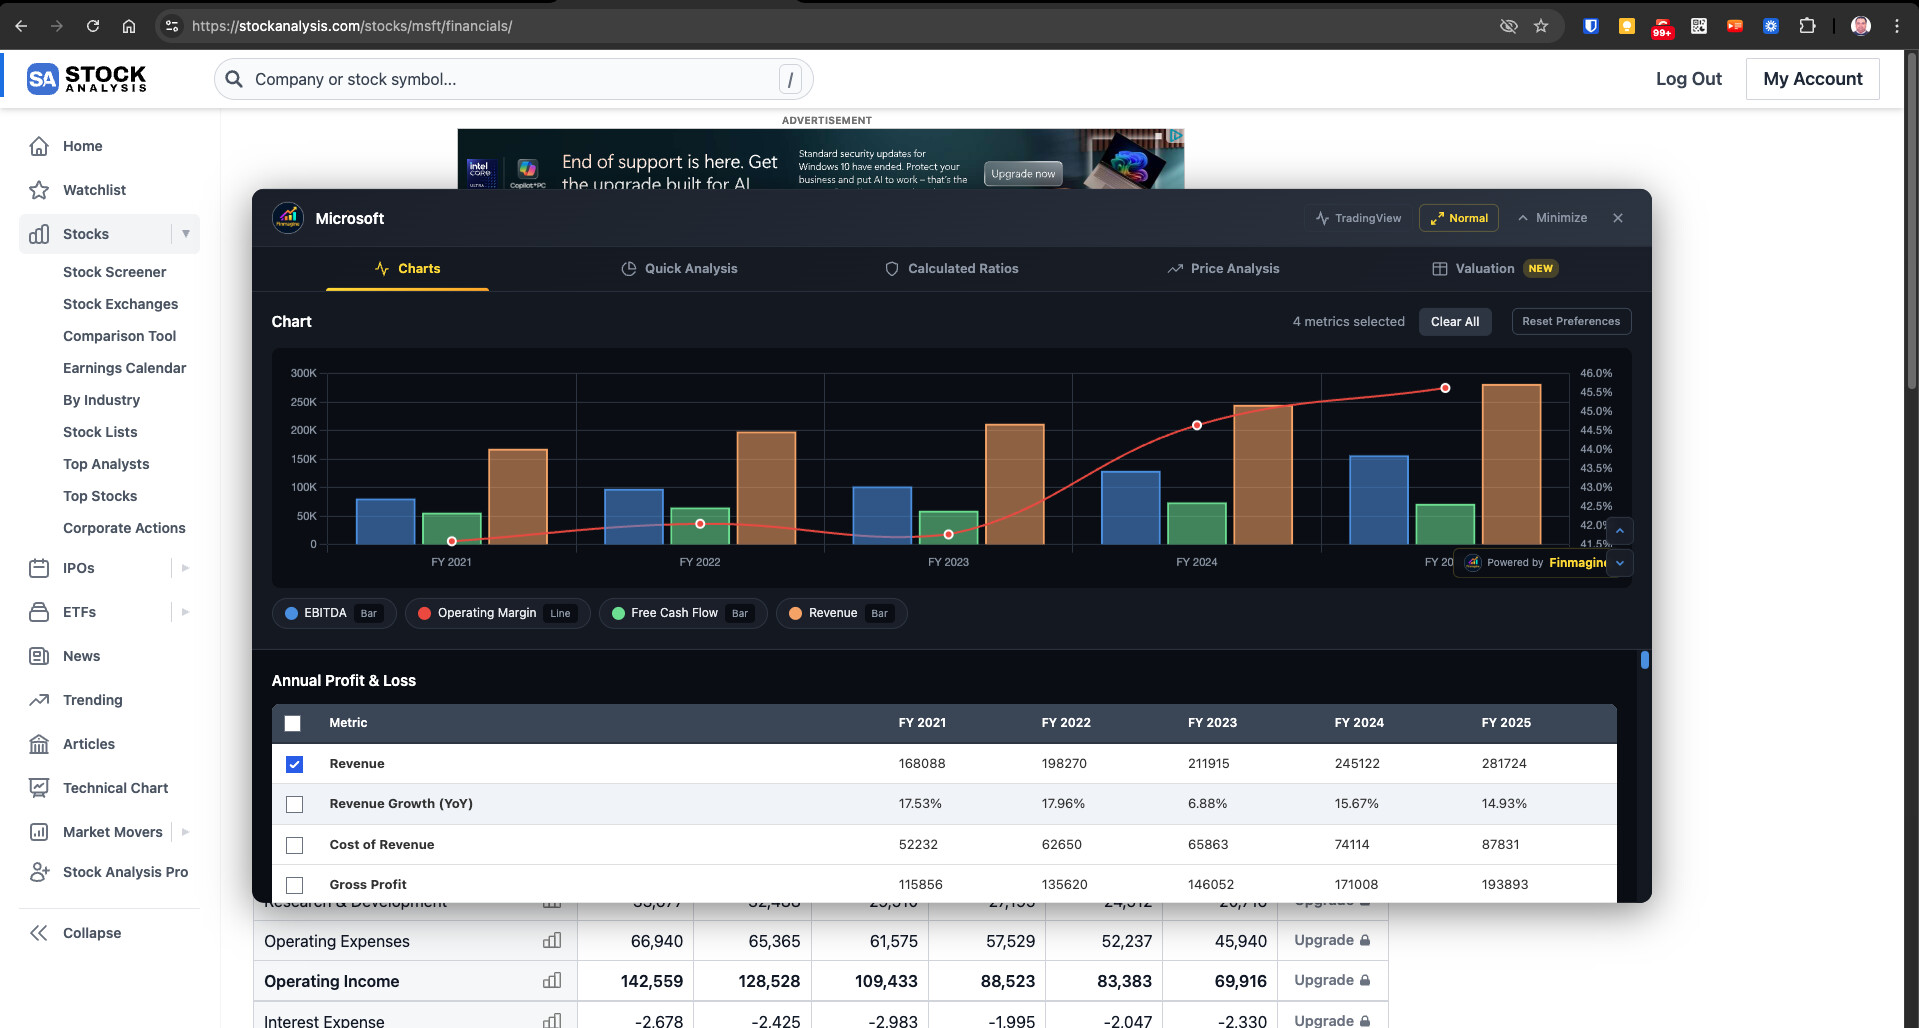
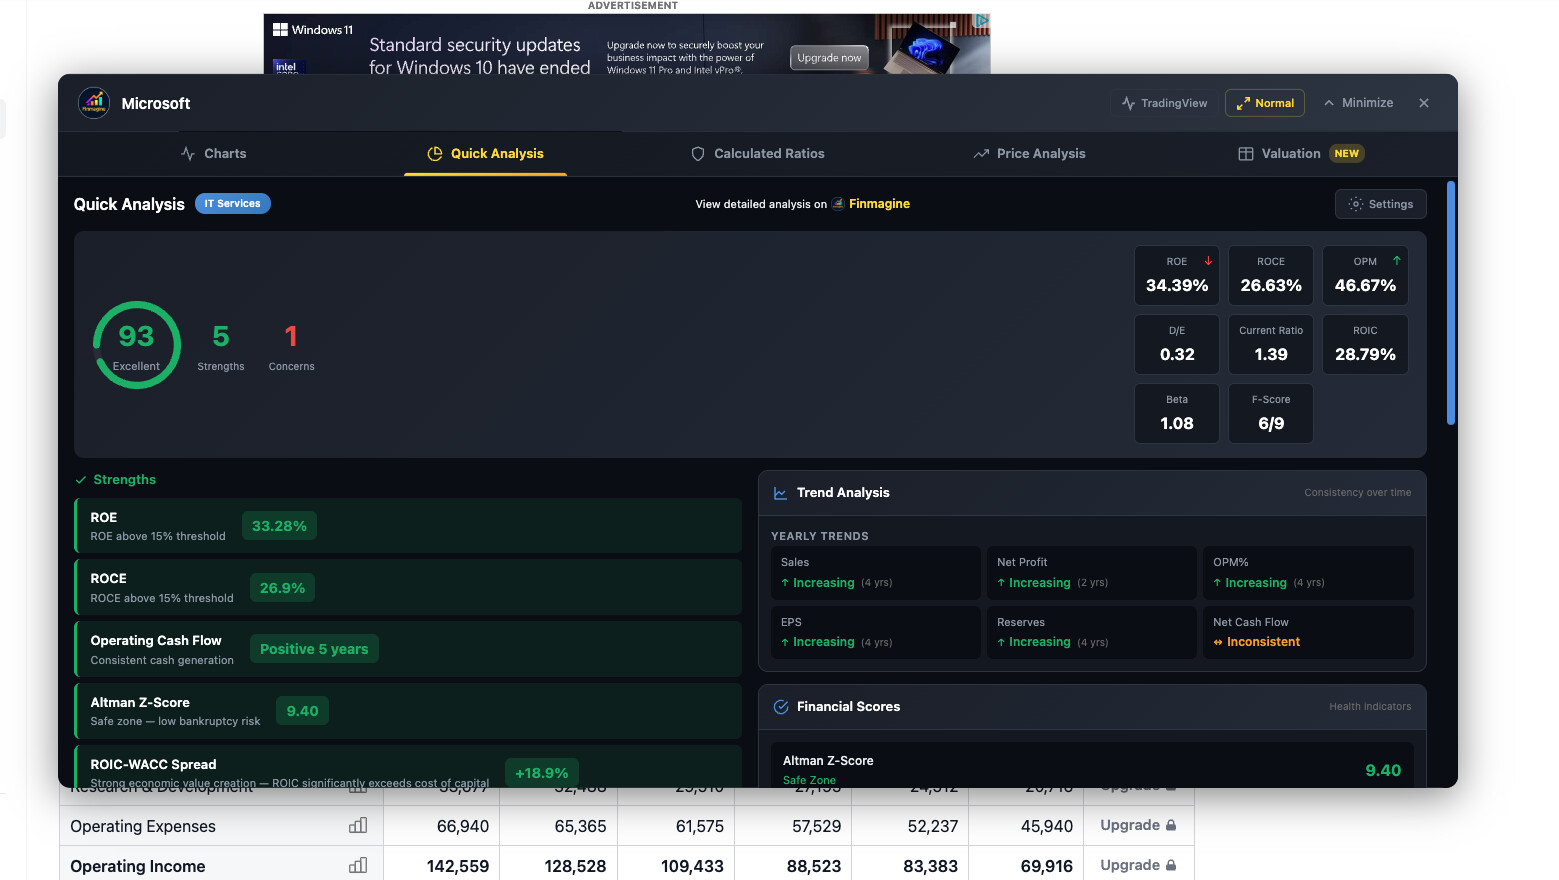
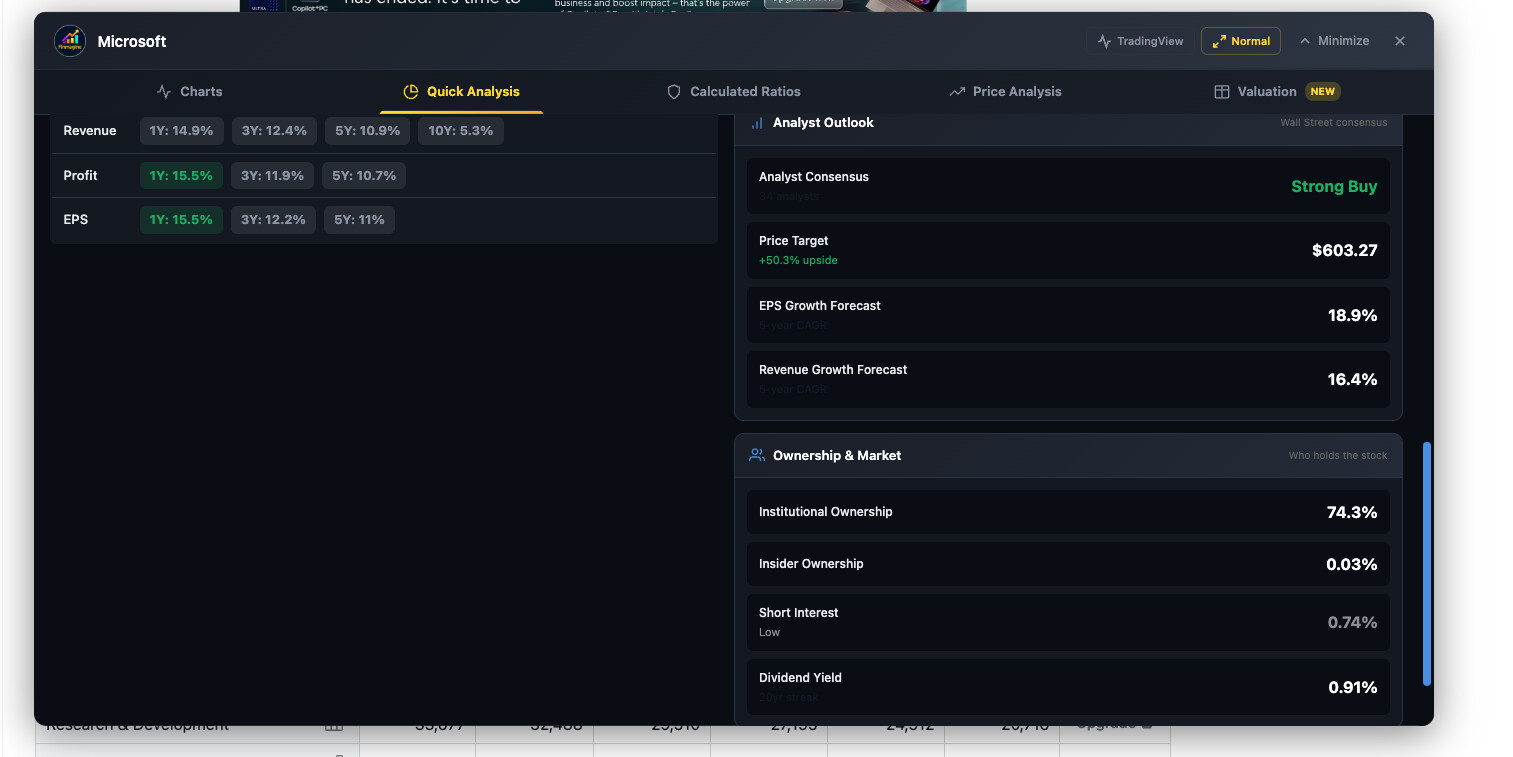
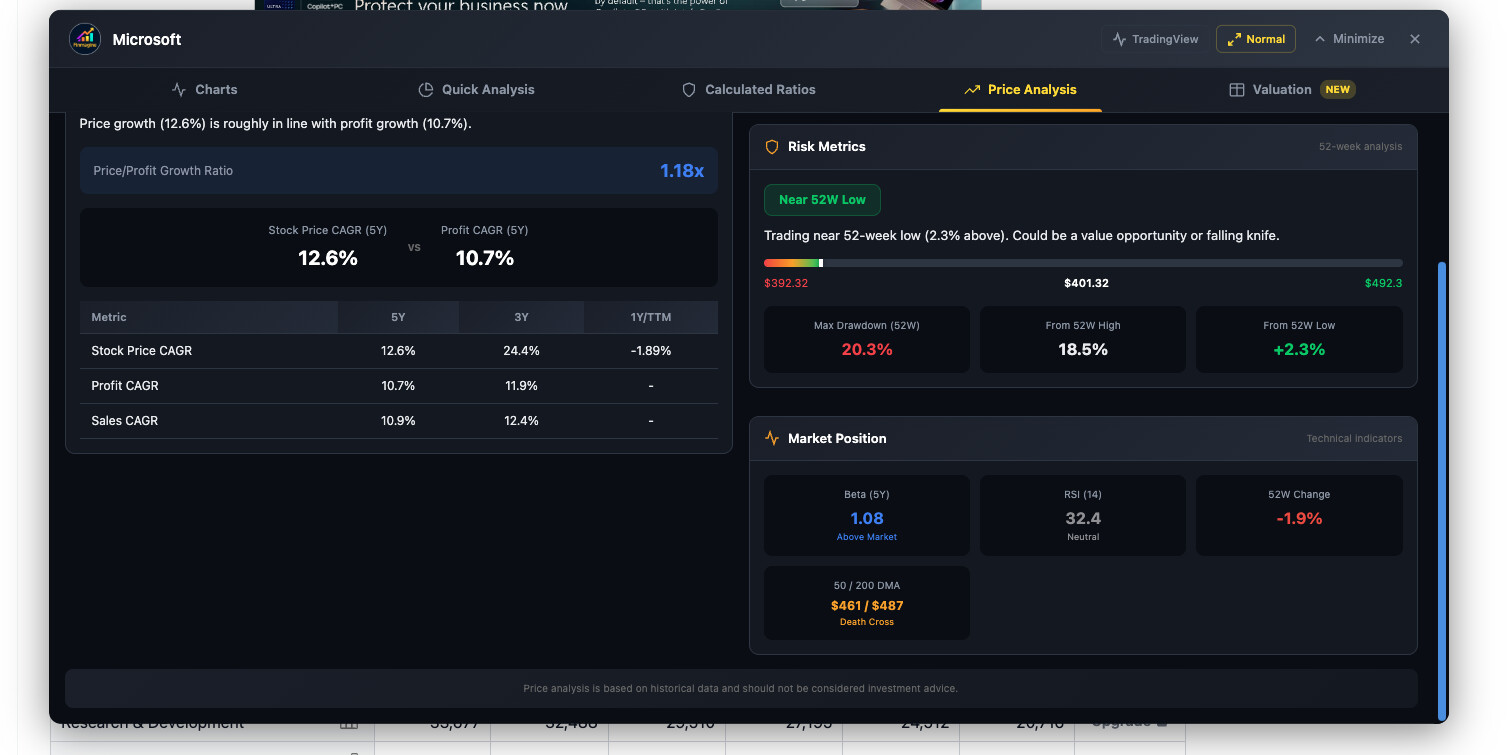
v2.3.0 just submitted — adds full US stock analysis on stockanalysis.com. All 5 tabs work. Altman Z-Score, Piotroski F-Score, ROIC vs WACC spread, analyst consensus with price targets,
ownership data (institutional %, insider %, short interest). 145+ GICS industry classifications for accurate sector benchmarks. Also added TradingView one-click integration.

US stock guide: Complete Guide to US Stock Analysis with Finmagine Chart Builder | stockanalysis.com Tutorial | Finmagine

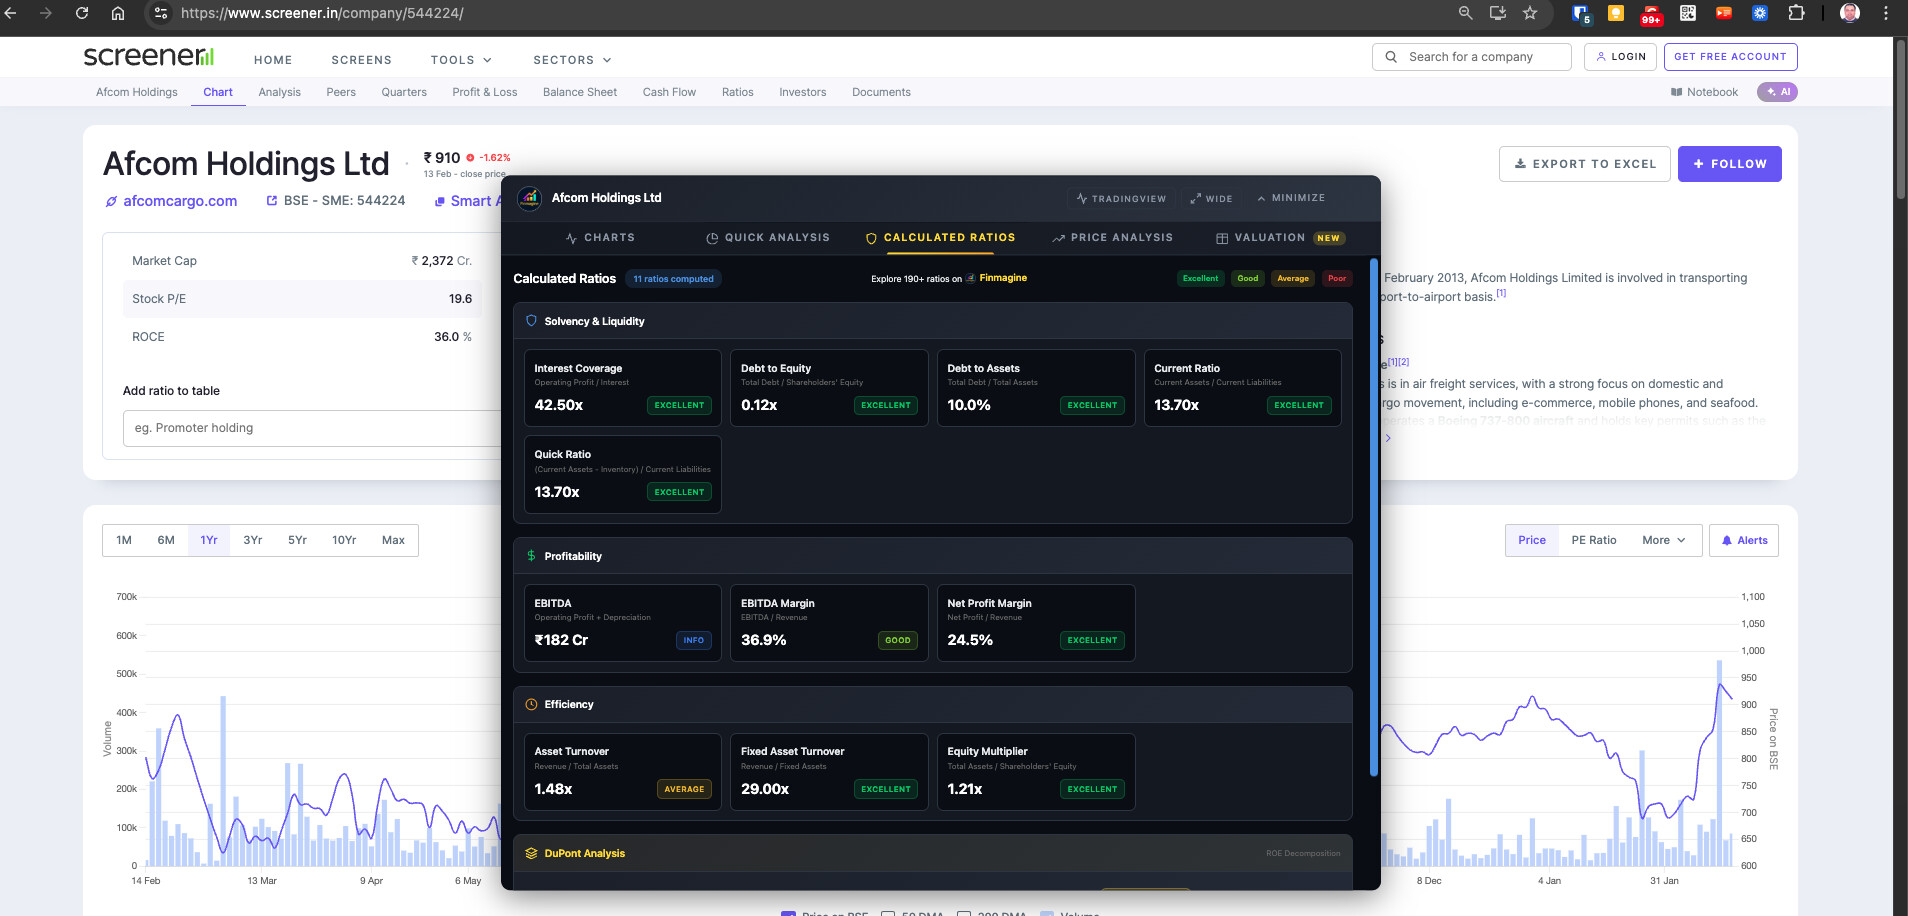
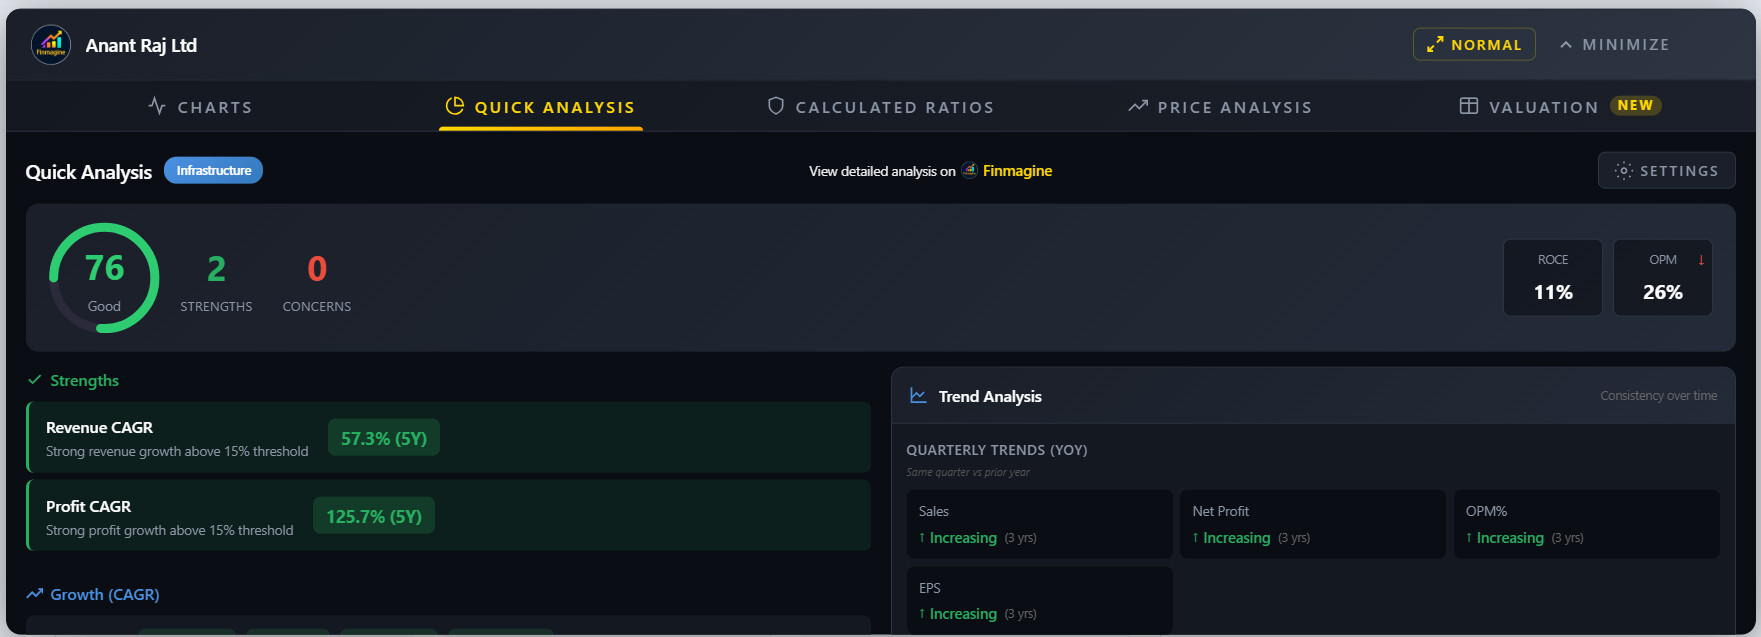
Also submitted a brand new extension — Finmagine AI Advisor. This one sits inside Screener.in and does something completely different from the Chart Builder. It extracts all the financial
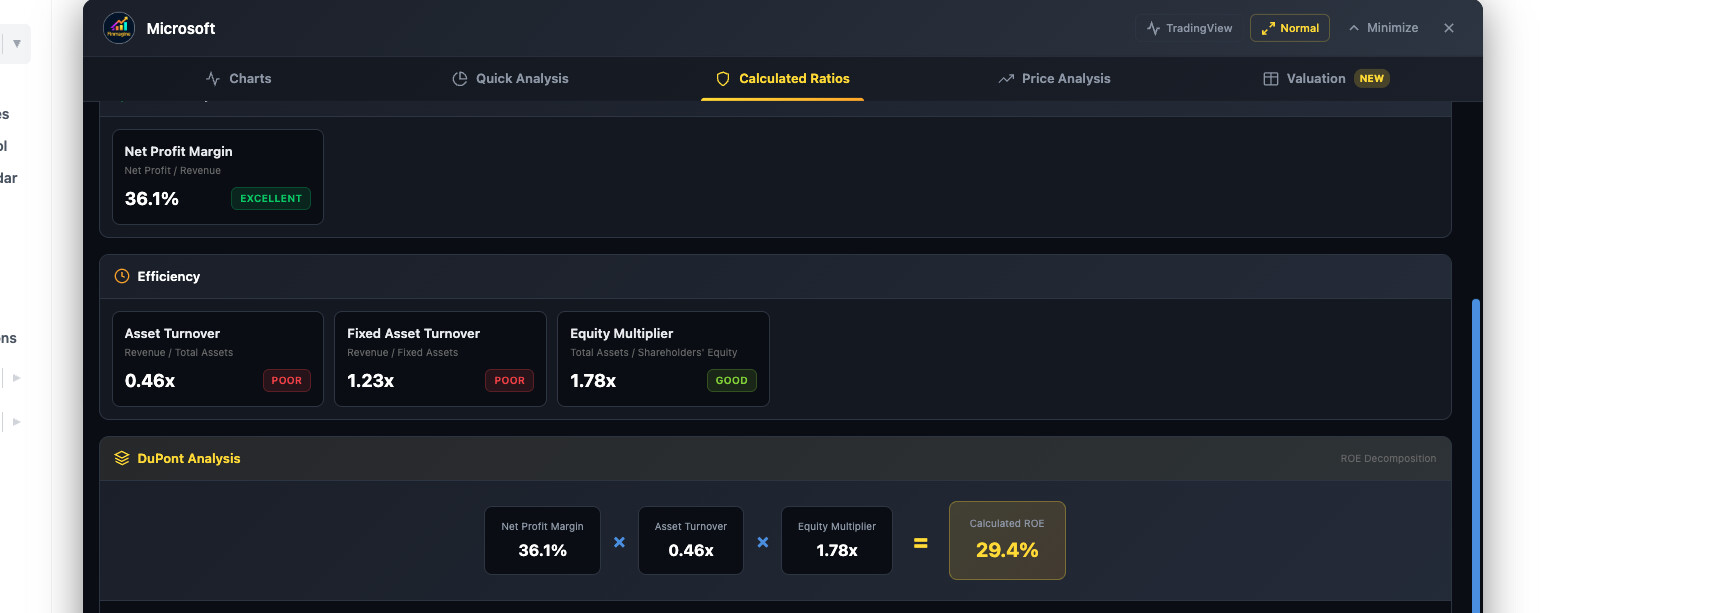
data on the page, detects the sector, computes a health score using DuPont decomposition and multi-timeframe CAGRs, and generates structured research prompts for a Custom GPT trained on a
21-parameter scoring methodology.

The Deep Research template instructs the GPT to actually go and read the concall transcripts and annual reports linked on the page. 18 sector profiles. Banking stocks get analyzed
differently from IT stocks get analyzed differently from pharma stocks.

AI Advisor deep dive: Turn Screener.in Into an Institutional-Grade AI Analyst | Finmagine AI Advisor Deep Dive

Everything is free, private, and zero data collection. Feedback welcome.

2 Likes

Hello Sir, Scrolling is still not Coming up in the new version.

Hello @Gopalan_Suresh_Raj
I have upgraded the extension to V2.2.
The scroll issue is still there. Only the Chart tab has scroll, others don’t have it.

Thank you @karanshah137 and @vavazzodu for reporting this. You’re both right — the scrolling issue on Quick Analysis, Calculated Ratios, Price Analysis, and Valuation tabs persists in v2.2.0.

The fix is already built and included in v2.3.0, which was submitted for review today. The root cause was two-fold:

  1. The mouse wheel handler was only forwarding scroll events to the Charts tab container
  2. The inner wrapper divs on analysis tabs weren’t set up as flex containers, so the scrollable area expanded to full content height — making the browser think there was nothing to scroll

Both have been fixed in v2.3.0. In the meantime, you can scroll using the scrollbar on the right edge of the panel, or by clicking inside the tab content and using keyboard arrow keys /
Page Down.

v2.3.0 also brings US stock analysis on stockanalysis.com (Altman Z-Score, Piotroski F-Score, ROIC-WACC, analyst consensus, ownership data) and TradingView integration. Should be approved
within a week.

Appreciate the patience and the detailed bug reports — they directly shaped the fixes.

2 Likes

It seems to be a tool helpful to all, from learners to advanced for quick glance at a stock’s financial performance.
Kudos for doing the greater good for community at large.

1 Que,
can this be even used apart from screener.in, on similar sites like stocscans.in or tijori finance, etc.

If it can, it would in real sense a universal go to plugin for stock market enthusiasts.