
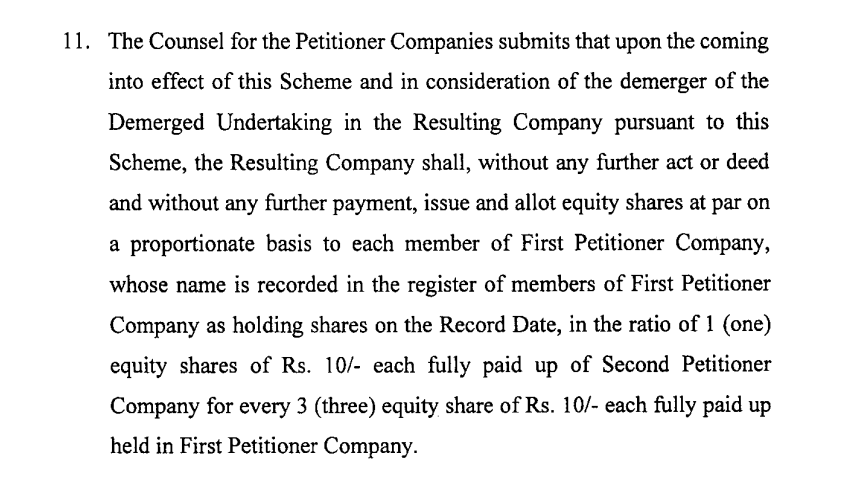
as per todays filling each share of tips will fetch 3 sares of tips films
2 Likes
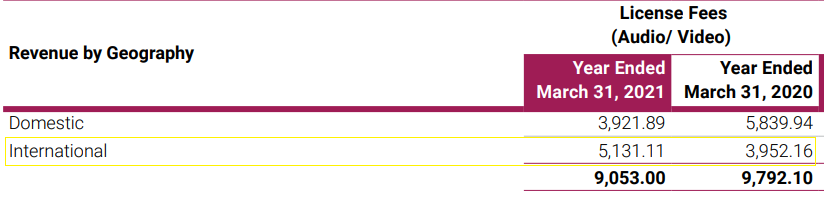
I was checking FY2020 and FY2021 numbers. In FY21 significant revenue came from international business. There was significant de-growth in domestic business in FY21 over FY20. I an unable to find this split for current year. Anyone has this data? Need to see from where growth is coming Domestic or International?
1 Like
Great interview of Merck Mercuriadis, who runs a listed fund called Hipgnosis Songs Fund which is basically a REIT like structure for music rights.
3 Likes
If we look at the performance of 2 of the listed funds in this space, both typically acquire songs at a 15-16x of publisher revenue, i.e., at ~6.5% yield. This would to some extent be dependent on the interest rates and growth potential of the income. In India, interest rates are higher so it could be argued that acquisitions need to happen at a higher yield, but the potential for growth is also higher than in the US/Europe given lower penetration of streaming services.
The operating expenses in India would be lower, so it is possible the net profit would be higher and also majority of the portfolio is historical so there is no new content charge (which will kick in once they start acquiring songs). This is true for both Tips and Saregama for now.
Tips does around Rs 150 cr of music licensing revenue, so a 15-20x multiple (to account for some growth), would give a valuation of Rs 2,250-3,000 cr. Saregama does around Rs 350 cr of music licensing revenue and a 20-25x multiple (bigger portfolio hence higher multiple) would give a valuation of Rs 7,000-8,750 cr.
The organic revenue growth in India from existing portfolio would be much higher in India and if we add inorganic growth as well, the valuation should be higher (the 2 listed funds operate with a trust structure and have debt, whereas the Indian companies have no debt, are free cash flow generating and have no compulsion to pay dividends so theoretically can compound the cash at higher rates).
Hipgnosis Songs Fund
From a portfolio of ~65,000 songs, the fund generates a revenue of ~ US$200m and trades at a valuation of ~US$2bn, or 10x revenue and trades at around 4.5% dividend yield. Their acquisition multiple of song catalogues as per their AR is ~15-16x of publisher share of income (~6.5% yield).
Royal Hill Music Royalty Fund
From a portfolio of 40 catalogues (they don’t share the number of songs), the fund generates ~US$20m in revenue and trades at a market cap of ~US$450m, or 22x revenue. Their acquisition yield is also around 16x (~6.5% yield). Their target dividend yield is 4.5% on initial cost though currently trades at 4.2% dividend yield.
11 Likes
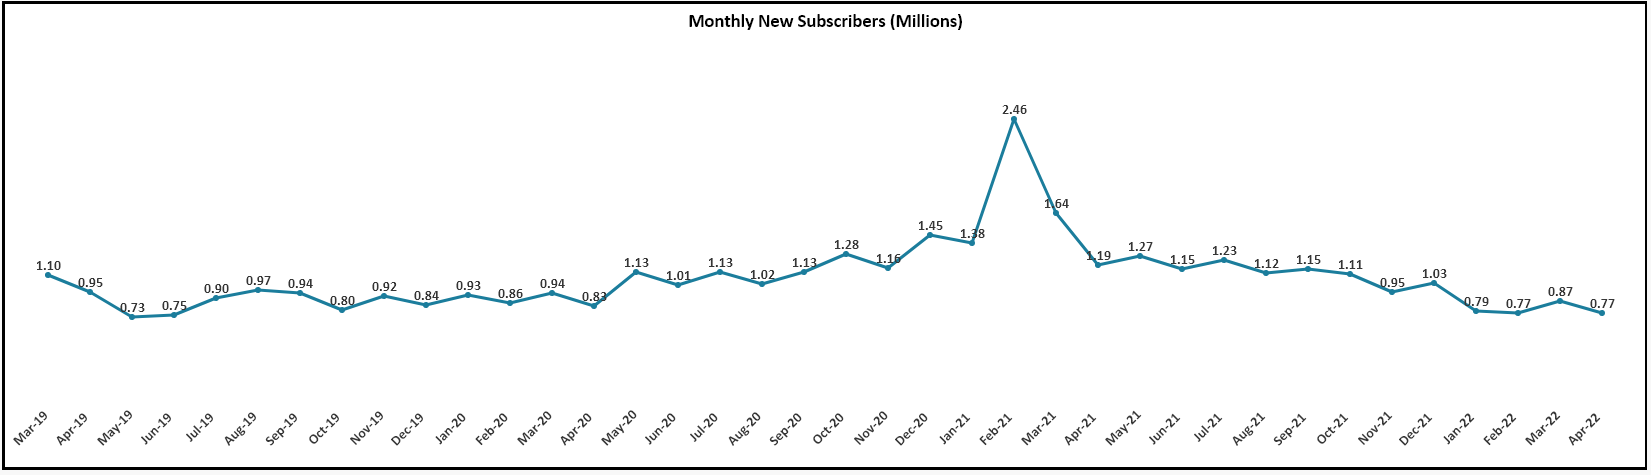
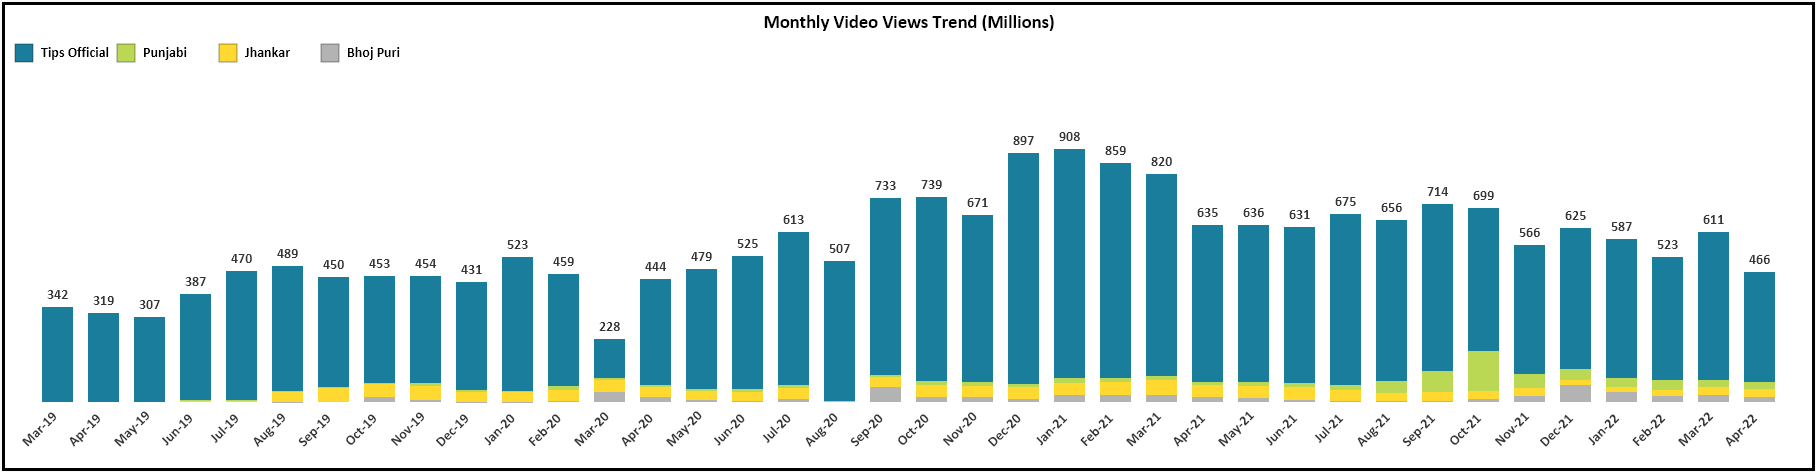
Since most of the revenues for Tips comes from Youtube, did some number crunching from the data sourced from public website - Social Blade.
I have taken in account their Main Channel (Tips Official) + 3 Other channels (Tips Punjabi, Jhankar and Bhojpuri) based on their subscribers. Rest of the channels were too less subscribed to be much material.
Number of subscribers added each month are kind of stable between 0.7 - 1 Million but declining trend recently. Feb-21 is the exception because of huge spike in Bhojpuri Account.
Monthly Views create a slightly bearish picture where monthly views are declining recently (may be, reverting back to mean) with Sep / Oct -21 jump in Punjabi because of new content addition but unable to sustain that momentum.
Music Revenues looks like in Trend with Youtube Views with a lag of Quarter. 3Q FY22 saw huge jump in Revenues (Possible reason could be deferred revenues / Increase in Ads Frequency / Increase of performance revenue in the mix).
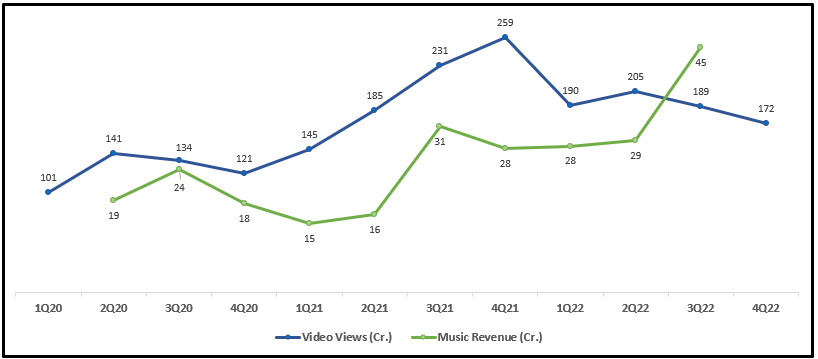
If the trend continues to decline, achieving 25-30% topline growth could be challenging IMO.
Disclaimer - Invested since lower levels. Partially sold few weeks ago.
13 Likes
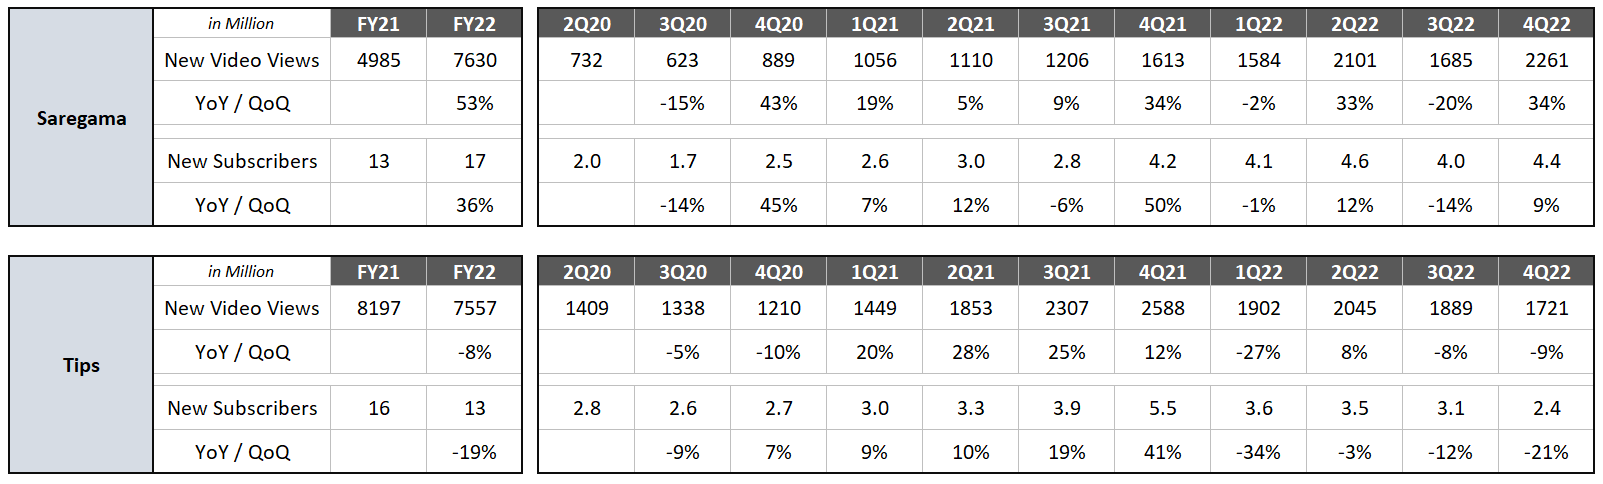
To add to the previous post, did the same thing for Saregama including all the major channels to check whether decline of views is industry wide but Saregama seems to be on a healthy growth track compared to Tips.
12 Likes
This is great stuff, any way to track these for streaming services like Gaana, Spotify, etc.?
I am not able to find any source for Spotify / gaana data. There is one tool by chartmasters, but it provides on artist level, and is paid.
But this data is more relevant to TIPS as they are not on gaana and also limited on Spotify.
Youtube is one of the major contributor to them. One of the loophole in this data is it doesn’t include user generated content so actual number of views can be much higher. But I am presuming it to follow similar trends, but I could be wrong.
1 Like
In last concall Tips management mentioned that Youtube premium views are increasing rapidly which may cannibalize Youtube views. More over Saregama have added more catalogues (mostly regional) in last quarter compared to Tips and Tips new vedio’s are mostly recreational and have less costs.
Can you clarify below points
- Are these figures only for newly added veidos?
- Are these numbers including all channels of Saregama and Tips?
1 Like
Hi Ravindra,
These figures are for all the videos watched in the particular month / quarter from those channels considered.
For Tips - Considering 4 major channels. Among rest, their 4 channels are private, so unable to get views data. Rest, 6 channels have flat trend with 15-20 M / month views combined.
For Saregama - Considering 9 of their channels (Because in almost all these channels trend is increasing). Rest 9 channels are very small with flat trend (10-15M / Month views combined).
However, Note that none of these include user generated content, which also makes up large part of their revenue (which is also why, these numbers will not match with views numbers provided by management). I just wanted to get an idea of trend for YouTube views across channels.
1 Like
Has anyone got TIPS films shares in demat account ? 21st May was supposed to be the date of demerger , can some learned folks throw some light on it.
3 Likes
They’ll be credited around mid July according to the management reply to a question yesterday on concall.
1 Like
Kindly upload copy of concall, if you have ?
Tips Concall Notes :
Film Songs : Last year for Hindi, Coolie no 1 and Bhoot Police songs were released. Currently in the process of acquiring film music in regional language movies too.
Effective tax rate will be ~25%.
Why Q3 was higher?
There was a one time larger payment from one of the vendor and also there is a seasonality factor.
(Q4 was lower than Q3 in last 2 years too)
Also, No co-relation with You-tube Views as it depends on whether ad is showing on the video.
(Opinion : Probably lack of better data analytics division)
Ad-Supported vs Subscription: 80-85% of digital revenues are still ad-supported.
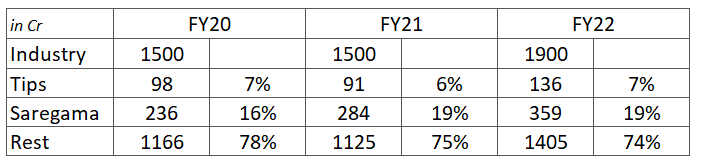
Market Share : 6-7% market share in music industry.
(Seems correct as per EY FICCI Mar-22 Report they shared in ppt - more calculations at the end)
Guidance : 25-30% growth on the Topline and 15-20% on the bottom. Target to release around 400 songs (60% in-house / 40% Acquisition) in FY23. (this number was 276 and 215 for previous 2 years)
(Considering 15-20% bottom line and 25-30% top line will suggest 70-75 Cr. of Expenses and 57% EBITDA Margin next year from current 67% Margin)
Huge Acquisition budget for this year. Can’t disclose amount due to competition.
(Historically, it’s around 50% of expenses so probably 35-37 Cr. for next year)
Future Plans : Planned to produce 1-2 Hindi Movie / year from Tips films and other several regional movies taking the count upto 25-30 films per year. (Songs of these films will be with Tips Music division)
Demerger : Tips Films Shares will be listed around 15th July subject to all proceedings.
Regarding Market Share, Taking Industry size from the EY FICCI report of Mar-22
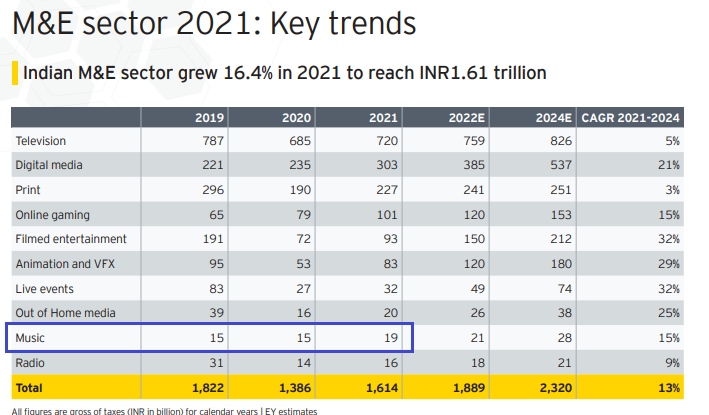
Since above is calender year, so considering 2021 Industry Size for FY22 below. Matching with management suggested 7% market share which seems constant since FY20 (probably because of less acquisition of new content). Saregama’s share has increased though in FY21 by 3%.
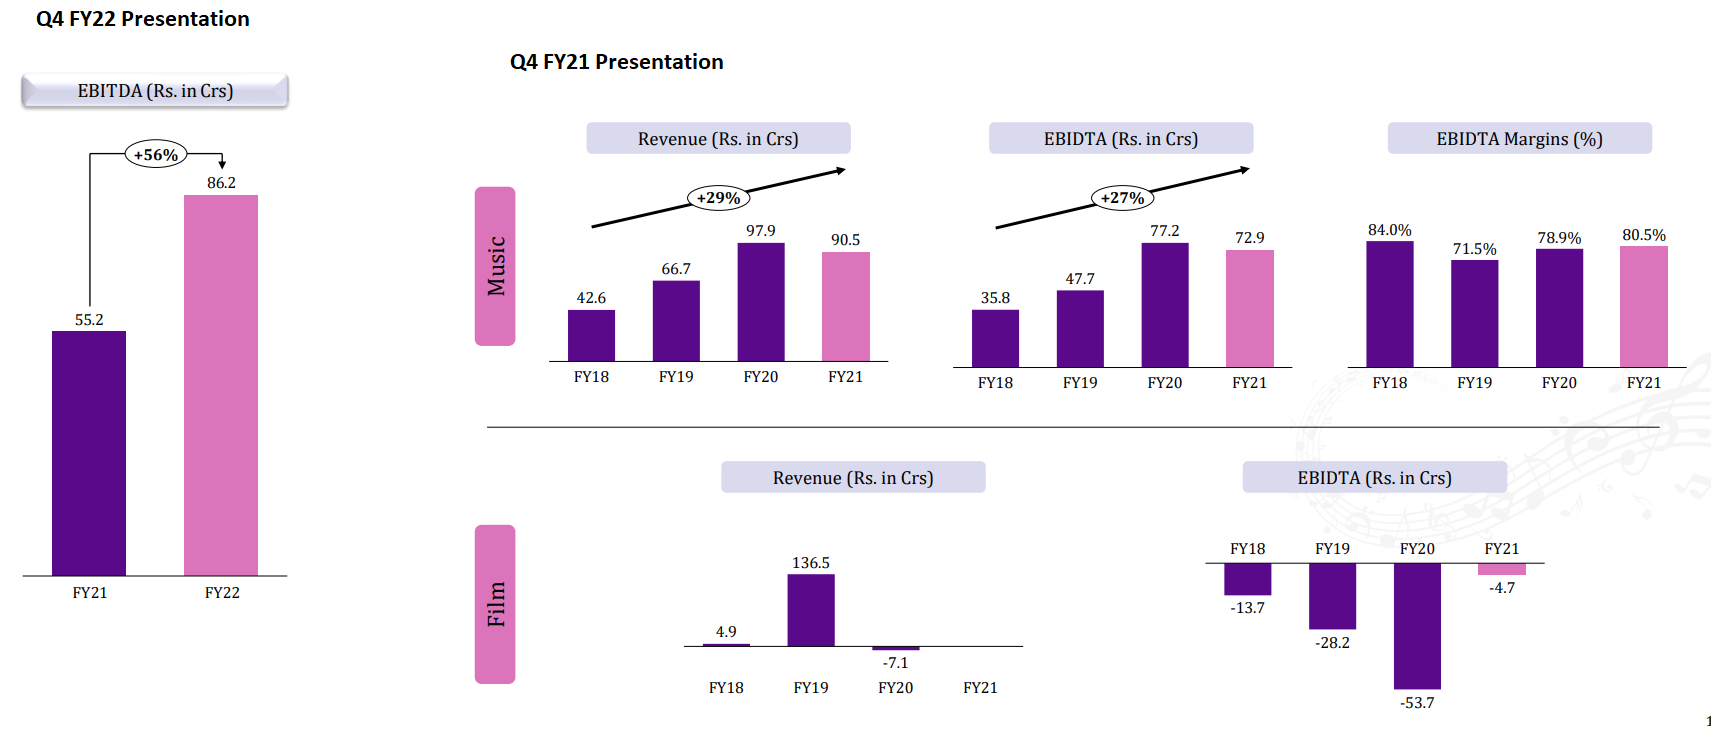
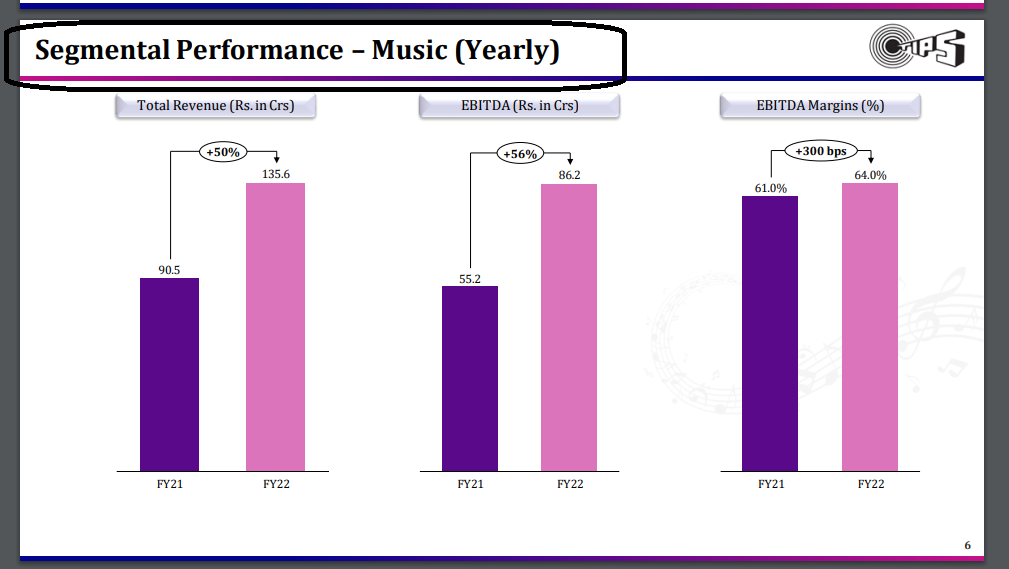
Lastly, at the last 5 Minutes of con-call, an analyst mentioned a valid point regarding discrepancy in numbers. Last year’s presentation, they have mentioned Music EBITDA as 72.9 which becomes 55.2 in this year’s presentation. Problem in itself is not the number if there has been some historical adjustments, but management was unable to even clarify about what happened here.
Concall Link : https://tips.in/wp-content/uploads/2022/05/InvestorsEarningCallAudio.mp3
11 Likes
The last question on discrepancy is a clear confusion on account of analyst. Only the FY22 numbers are for Music business, FY21 numbers in the presentation are for entire business including Films. And thus the EBITDA for FY21 is net of entire costs.
Management obviously did not understood the question well and was justifying the increase in other expense.
3 Likes
Can somebody share cost break up if Tips has provided after demerger? Sold Tips ex-demerger but HDFC Sec is not crediting funds unless it is provided.
Thanks Ankush. That makes sense. Just checked they also mentioned in a footnote on PnL statement page. However, showing % growth like this makes no sense when they already had breakdown data for music segment.
Some of the key issues regarding content costs:
- Not able to figure out return on new content investment. Management assessment is that payback period will be 3 years but no mechanism to review this.
- Indirectly related to 1st point only, not possible to do content cost benchmarking. If there is siphoning off money in the name of content cost, we will not be able to find out
- Strong data analytics capability should be in place so that company can make good decisions for content acquisition. I really doubt this is focus area for the company. They seem to just rely on their personal experience for making these decisions.
Old catalogue is throwing so much cash. It can only aggravate irrational decision making.
1 Like
I’m still not entirely clear on this, even their numbers in slide 7 are not adding up which adds to the confusion. For eg. for FY21 90.5 + 4.9 = 95.4 - 8.1 - 27.3 = 60 and NOT 55.2 as stated, similarly for FY22 numbers don’t add up
Was thoroughly disappointed with the quality of responses from the management, it seems they weren’t prepared for the call. Maybe I’m reading too much into it but even basic queries lacked data backed answers with a ton of vague statements without any sort of conviction
2 Likes