@rupeshtatiya: No comments, please refer to Charter on post 1.
I will address key elements of interest rate risk on a separate post to help explain the concepts.
@rupeshtatiya: No comments, please refer to Charter on post 1.
I will address key elements of interest rate risk on a separate post to help explain the concepts.
Hi @Mas24,
I have edited the previous post to fit within new guidelines. I hope you will be able to answer the questions in edited post.
Best,
Rupesh
Post 9: What are the key risks to life insurance business?
Life insurance business requires one to make assumptions about the future and then expect that experience pans out in line or better than those assumptions. So, there are a number of risks that can impact the business.
I personally find a ‘risk lens’ useful to build an understanding of any business and am hoping that the next few posts will help do that for life insurance.
In this post, we will just create a simple table of key risks segregated into certain categories and then, address some of the key ones in subsequent posts.
Post 10: What are the key execution risks and mitigation approaches?
• New business: Life insurance products address key life needs for customers. However, they may not simple to understand, may not offer instant gratification and may not be suitable to typical impulse purchase. Hence, there is a need to approach customers through various touch points in an efficient manner.
The key risk here is reduction in touch points or drop in productivity of existing touch points. Mitigation strategies:
o Number of touch points: De-risking through a varied set of sales channels and tie-ups with new partners to increase touch points
o Productivity levels: Retention levels, training, adaptability in different external environments and a balanced product mix
• People: Have discussed this in post 8.
• Service related: Service related risks can lead to financial impacts or customer grievances. While there are many ratios to track the trends, mitigation would require robust processes, systems and monitoring by the company.
• Renewals: Higher persistency would lead to increase in AUM, though the impact on various parameters would depend on the type of product. For example, persistency impact is usually higher in market linked products. A broader perspective is that higher customer loyalty would lead to upsell and cross-sell opportunities throughout life cycle of customers. Mitigation would require right selling, strong monitoring and higher engagement with customers.
• Expenses: Have discussed this in post 8. Usually, in a growth phase a better way to manage expenses is to increase the AUM or premiums so that ratios improve. However, one needs to monitor trends in absolute expenses - a higher growth rate is fine if it leads to increase in business volumes. Mitigation would require allocation of expenses to more productive areas and this may be difficult to gauge with an external lens.
• Digital: The industry is moving towards tech. based operations and over time, can be a differentiator. Immediate risks may relate to disruption of business but this would probably have a short term impact. Mitigation would require continuous improvement in digital infrastructure.
Post 11: What are the financial risks and mitigation approaches?
• Solvency: Solvency is the amount of capital that a life insurer needs to maintain, over and above reserves, in order to manage any adverse experience which is in excess of that allowed in the prudence built in reserves. This additional cushion helps give comfort that the company can meet its liabilities even in tough conditions. In India, the minimum required level of solvency capital is defined through the Solvency ratio – the ratio of available to required solvency capital needs to be at least 1.5. These calculations are factor based, well defined and easy to compare across the industry.
Now, let’s cover the risks:
o Low solvency ratio: This can result in a scenario where a further fall in solvency may require additional capital from shareholders or the company becomes insolvent.
o High solvency ratio: This may mean that the capital is not adequately deployed in the business and so, reduce the expected returns for shareholders.
The above risks imply that there may be an optimum level of solvency that a life insurer needs to maintain where there is no risk of insolvency and yet, capital is adequately deployed in the business.
Mitigation: One can track the changes in the ratio over time and validate the reasons for any significant movements.
• Profits: In the current phase this may not be as much of a risk given that the impact of new business strain would be much higher than any variance on assumptions in the underwriting profits. One may rather monitor EV and VNB to get a sense of future emergence of profits once the industry reaches a particular level of maturity. Having said that, looking at sources of surplus is very useful in understanding the business and we will cover it when we discuss the financial statements.
• Embedded Value and VNB: We have covered these in Posts 4 &5. The only point I would reiterate is that the risk is that future positive cash flows would be lower than expected – that is, experience being worse than assumption. Mitigation: One needs to monitor trends on the EV/VNB walks over a period of time and validate the reasons for variances.
• Liquidity: This may not be as a significant risk in the current phase as life insurers would receive much higher inflows (new business, renewals, investment income) in comparison to their outgoes (expenses, commissions, benefit payouts). However, when we reach a far higher level of maturity, liquidity can be an important parameter to monitor.
Post 12: Market related risks – How does one evaluate interest rate risk?
Given that investment income can be a key source of profit for a life insurer, it is an important risk that needs to be discussed.
Interest rate risk is a complex topic which has the potential to make any discussion highly technical. Yet, we will keep things simple for now, we can address more complex questions later - please do have some patience on this one.
The first time someone had explained a life insurance product to me, he had drawn a simple cashflow using a timeline and up/down arrows on a sheet of paper - where I was supposed to pay regular amounts for certain years and then receive a big lump sum at the end. In case of death, a big lumpsum was paid immediately to my family.
Over time, I have realized that cashflows are a simple, yet powerful way to evaluate life insurance business.
Let’s take some examples of cashflows that involve guarantees for life insurer:
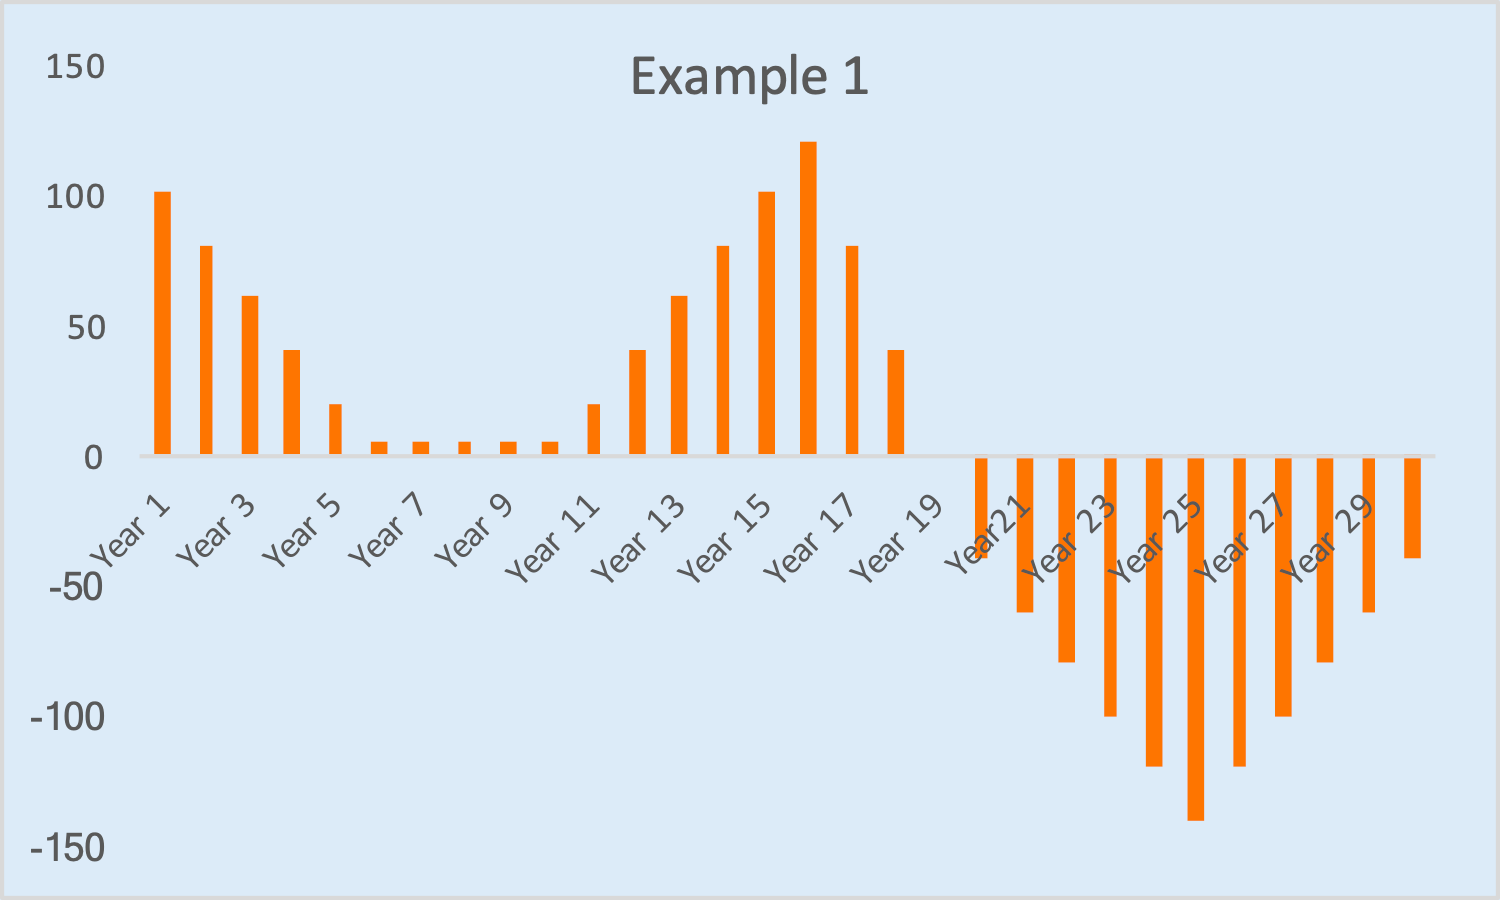
Example 1:
• Initial positive cashflows indicate that company would continue to receive premiums in the next few years and these need to be invested in assets to generate income
• Higher positive cashflows in middle years indicate that in this period insurer would be receiving maturity proceeds from investments and these would need to reinvested.
• Negative later year cashflows indicate that when insurer would be making customer payouts – death or survival benefits.
So, how sensitive is this cashflow signature to interest rates?
• If rates fall: new investments will give lower yields, reinvestment of assets in middle years would occur at lower yields and the payouts in later years may remain fixed.
• In this case, the overall duration is negative (assets < liabilities) and overall impact would be a reduction in the expected profits for life insurer.
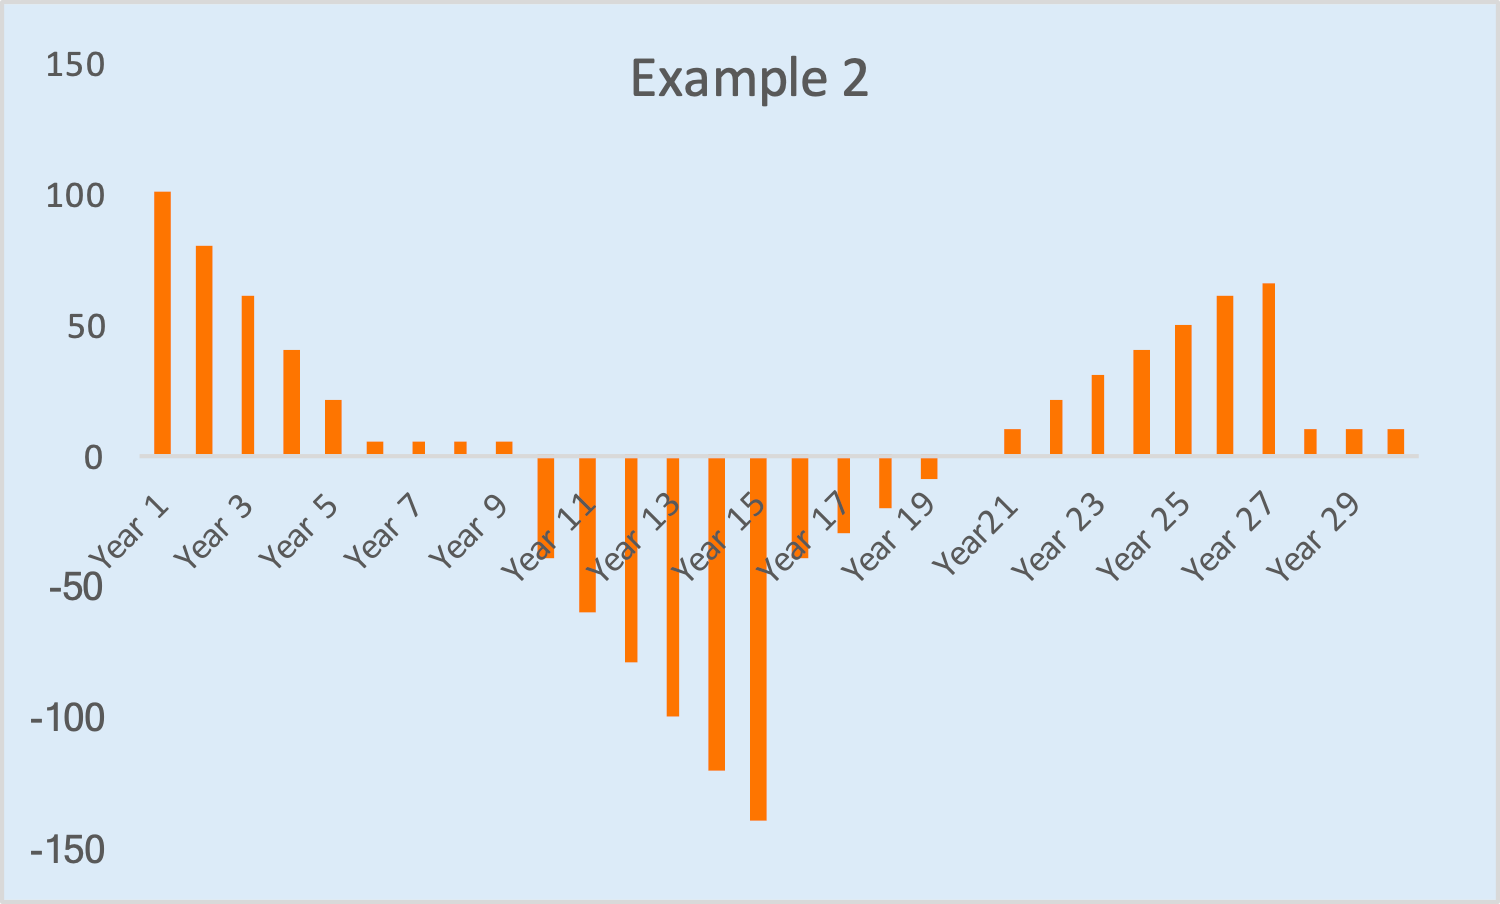
Example 2:
So, how sensitive is this cashflow signature to interest rates?
• If rates fall: new investments will give lower yields, payouts in the middle years may remain fixed, long duration assets will increase in market value and these would need to be sold in the middle years to make the payouts. Overall impact may be muted as in this case insurer may be well matched on duration.
• What if rates fall, but the fall varies with duration – 5 year yields fall by 50 bps, 10 year yield falls by 100 bps, 20 year yield falls by 10 bps? Here, the shape of the interest rate curve has changed and the overall impact on cashflows can be positive or negative.
So, duration matching takes care of fall in interest rates but shape changes can still create some volatility.
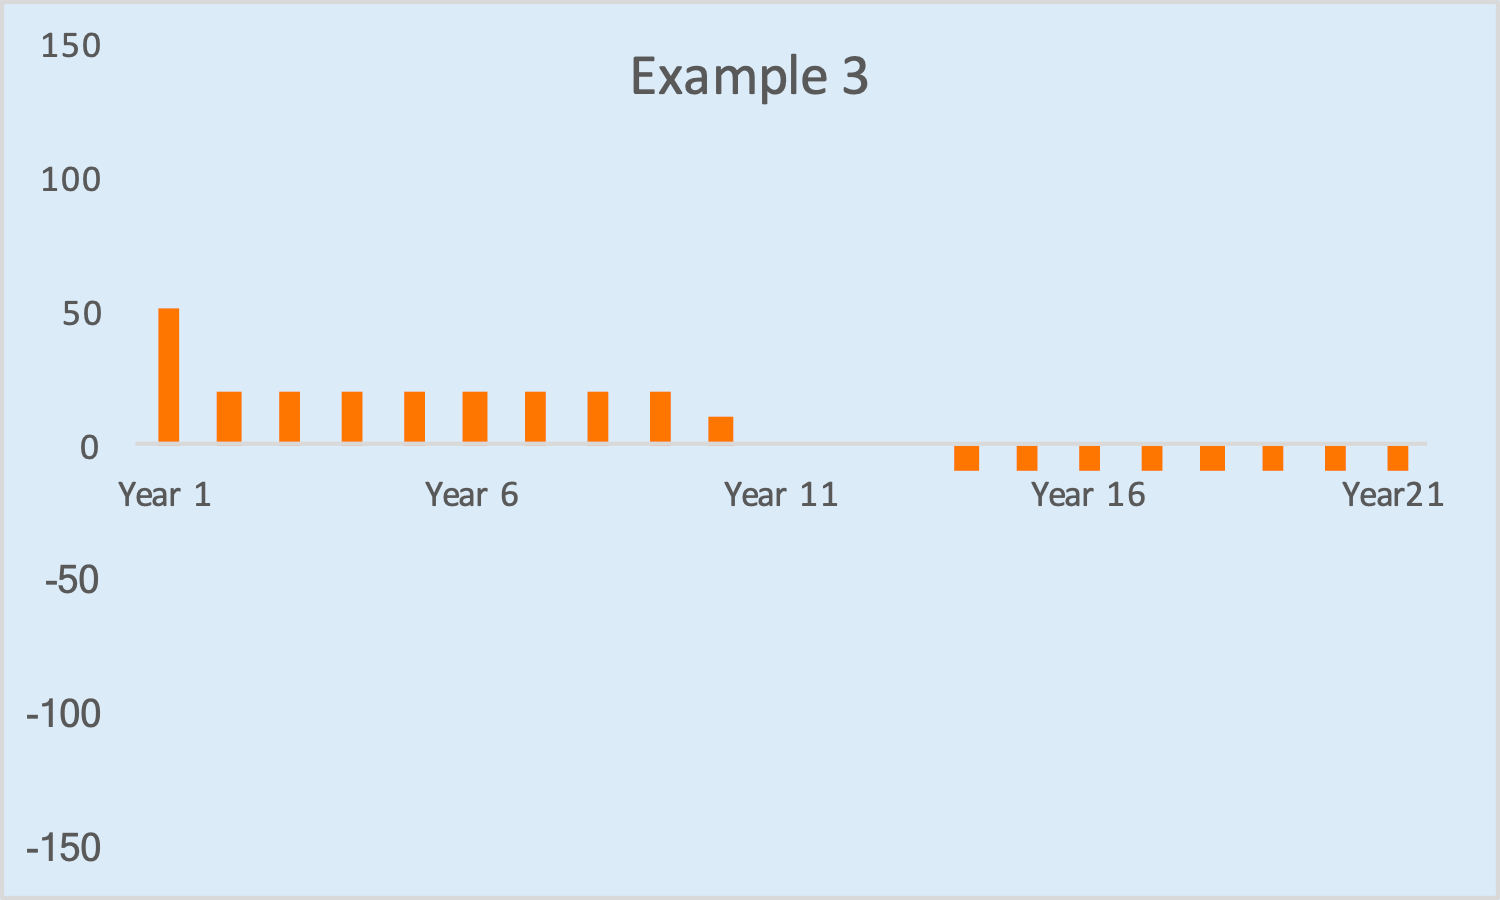
Example 3:
• In this case, the size of cashflows, either positive or negative, is much lower than that in earlier examples.
• It indicates that insurer is well matched at cashflow level. So, interest rates would not have a material impact.
• This is called cashflow hedging and it removes both risk and reward (in cases rates were to increase later). One would receive the expected cashflow irrespective of the movement in interest rates.
So, couple of key questions:
• How desirable is cashflow matching?
• How can a life insurer hedge its cashflows?
Will cover these questions in the next post.
Post 13: Market related risks – How desirable is cashflow matching?
Cashflow matching requires two cashflows, one positive and the other negative, equal in amount and occurring at the same time period. The net situation would be immune to any change in interest rates.
This removes both reward and risk of interest rates. So, what are the options for a life insurer:
• No hedging for guaranteed cashflows – This may be risky for a company writing significant volumes of guaranteed policies. However, for a company with a very strong balance sheet and lower quantum of such business, it can absorb the impact up to a certain level.
• Hedge all guaranteed cashflows – This limits any upside from higher interest rates as well as completely protects any downside from fall in interest rates. In some sense, it’s being comfortable with receiving the margin one has priced for, irrespective of market conditions.
• Hedge a part of guaranteed cashflows – This would result in hedging up to a certain amount based on the balance sheet strength of the company and closely monitoring the uncovered portion to optimize returns.
So, what’s the best strategy?
Well, it depends on the risk appetite of the life insurer and its ability to withstand any stress scenario. The endeavour should be to construct an optimal, yet practical, risk-return portfolio.
Post 14: Market related risks - How can a life insurer hedge its cashflows?
A hedge can be either external or internal.
External hedges
The most popular one is a derivative called forward rate agreement (FRA). This is simply locking of the future cashflows through an agreement with a counterparty (bank).
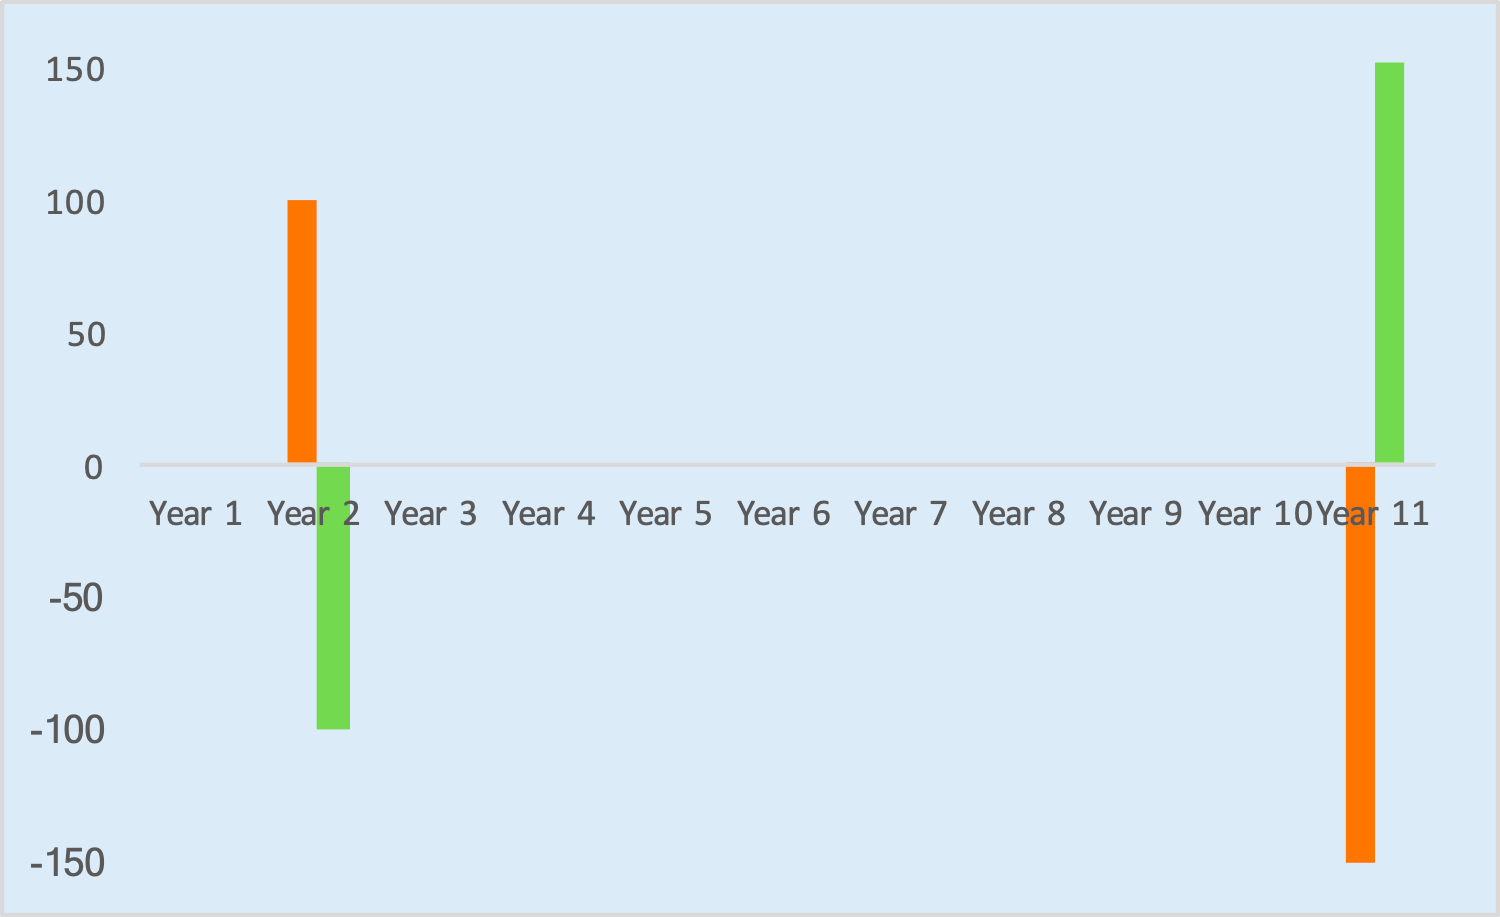
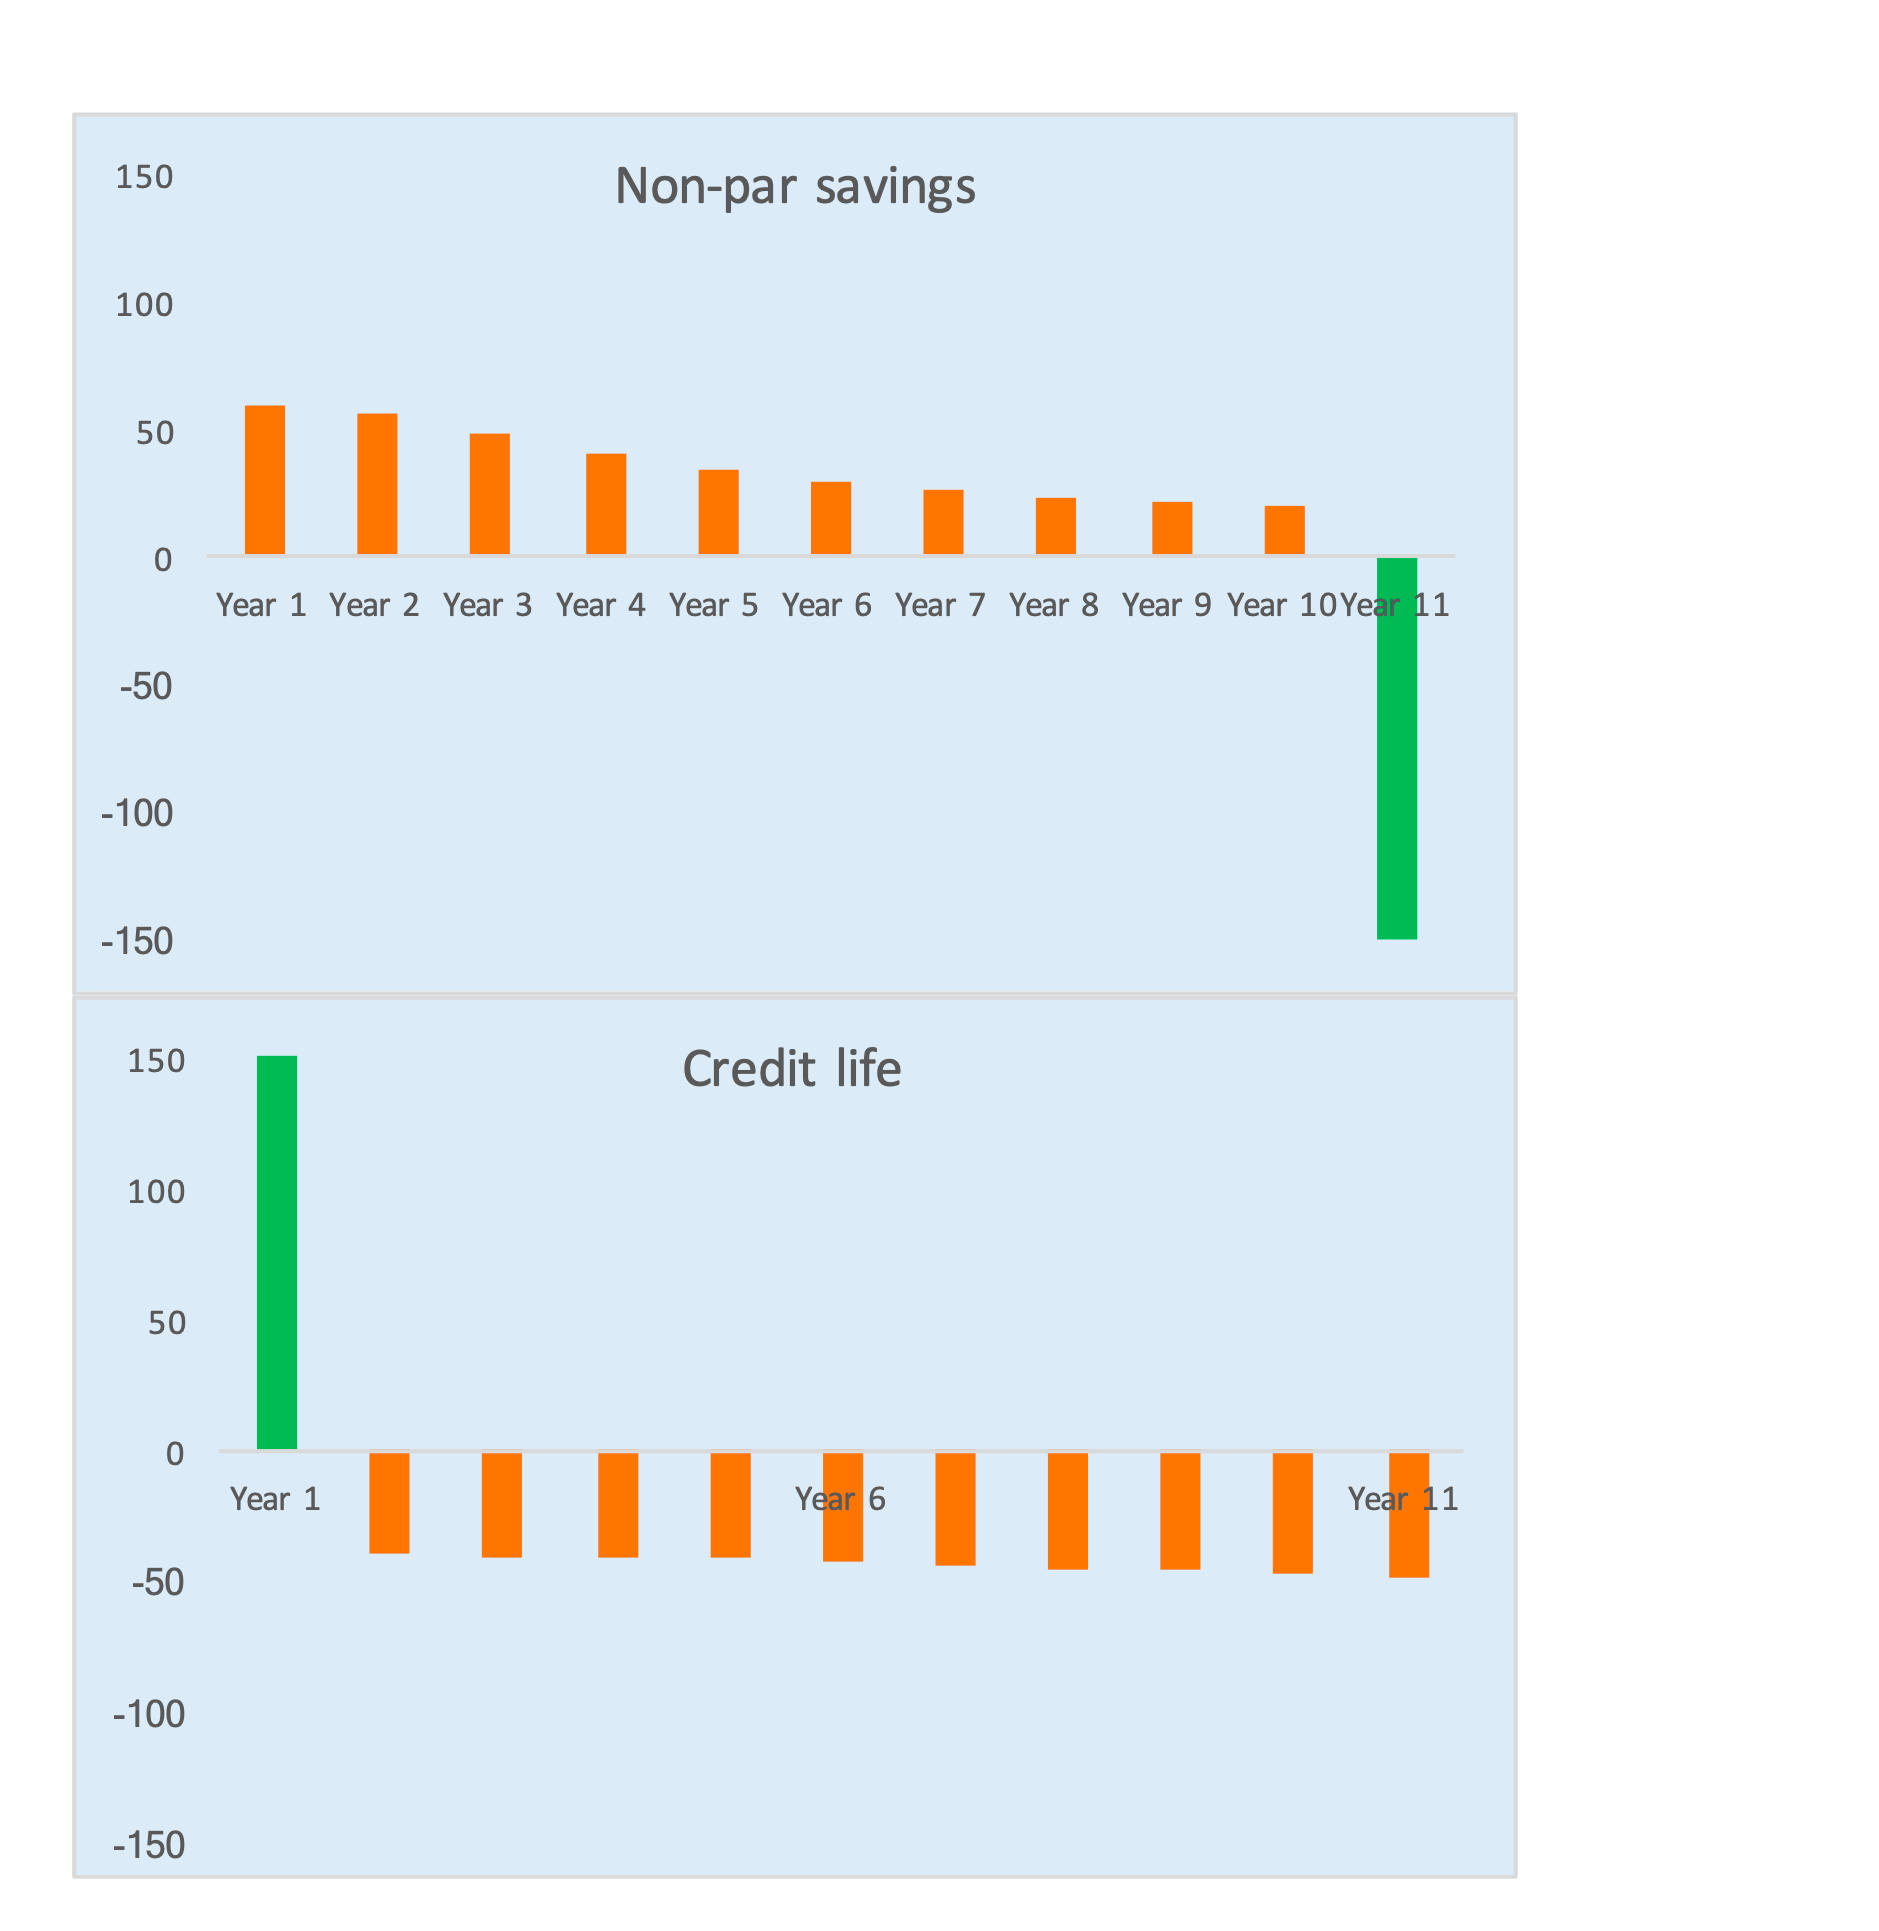
An example:
The orange bars are the net cashflows for the life insurer and the green bars are the net cashflows from the derivative. This provides a cashflow hedge – the settlement period of FRA coincides with the year 2 positive cashflow of life insurer and the underlying bond maturity coincides with the year 11 negative cashflow of life insurer.
Please note that this is a very simplified view and there are various additional impacts that we are ignoring for now.
Internal hedges
An internal hedge is one where there are two opposite liability cashflows. Let’s take an example:
• In years 2-10, these two products have approximately equal and opposite cashflows in the same years
• The positive cashflow for credit life in year 1 can be invested in a 10 year bond. The maturity proceeds from this bond in year 10 can be used to pay the endowment liability for the non-par savings in year 11.
So, in this example, two product portfolios can be used to offset each other’s cashfows.
Another rudimentary example of an internal hedge:
Pure annuity and pure term: Annuity would result in negative cashflows every year the customer dies (say year 10). At this point, the capital invested in a pure annuity policy is released as a positive cashflow for the insurer. Now, a pure term would result in regular positive cashflows for insurer and then at year 10, when customer dies, there is a negative cashflow (death benefit) for insurer. These two set of cashflows can offset each other and provide a hedge.
One can keep looking at product cashflows to evaluate hedging opportunities as well as understand the level of interest rate risk.
For example:
• A pure term plan promises to pay only on death while a return of premium (ROP) term plan pays on death and maturity. If we plot the cashflows on the ROP option, we can see that in some sense this has two components - a pure term plan and a non-par endowment. Hence, ROP will carry a higher interest rate risk.
• A pure annuity pays a higher pension during the lifetime and nothing on death. An annuity with return of purchase price (ROPP) option pays lower pension and returns the capital on death. If we plot the cashflows, we can see that a pure annuity carries higher interest rate risk.
• A deferred annuity non-par plan guarantees a pension rate say 20 years later. If we plot the cashflows we can see there is a reinvestment risk during deferment period and an additional reinvestment risk with the vesting proceeds at year 20, when the pension will start.
Interest rate risk management is relevant both at each line of business level as well as at the overall portfolio level. Hence, a balanced product mix helps a company mitigate this risk under different market conditions. We will discuss more on products in a later post.
Post 15: Market related risks - How does one look at equity market risks?
Market value of equity is reflected in the fair value adjustments on the balance sheet. However, the economic impact for life insurer depends on the fund through which the investment is made.
Equity investments can be made in the separate account (market linked funds) or in the general account (non-market linked funds). The impacts as are follows:
• Separate account (market linked funds):
In this case, policyholders choose the funds to invest it and equity investments are made accordingly, in line with the benchmarks of the funds. Here, the risk of fund value volatility remains with policyholders as they receive the payouts as per the market value of their investments.
However, there is a residual risk to life insurers with respect to the fund management charges that it can collect. In EV calculations, one assumes a certain rate of equity growth and the expected value of charges are included in EV. If the equity markets fall as on the date of EV, it will result in negative economic variance. Also, the impact is higher since all future expected cashflows are adjusted in line with market value of equity investments.
• General account (non-market linked funds):
In this case, the impact differs based on whether the investment is in participating funds or not.
For participating funds, the impact of fall in equity may be muted given that one can adjust future bonuses to be in line with the expected asset share and policyholder expectations. Also, the EV impact if further muted as shareholders receive only 1/9th of the cost of bonuses.
For other than par, this will have a direct impact of the EV in line with the movement in market value of equity investments.
There can be an impact on solvency as well. For other than par, it’s in line with the market value movement. For par, it can vary depending on whether the asset impact can be reflected in par liability through a change in bonuses.
Post 16: Market related risks: How does one look at credit risk and competition risk?
• Credit risk:
Investments that life insurers can make are well-regulated and diversified through asset allocation caps, company & sector caps, threshold on quality of papers, etc.
Further, life insurers may have their internal guidelines which can include tighter policies, credit reviews, regular monitoring, active management of assets, deepening primary research, etc.
Given the nature of the business, this risk would remain though in my view it can be reasonably well managed except in extreme conditions.
• Competition risk:
This can impact a life insurer through many internal or external factors. The earlier posts have covered many of the business aspects - one can modify the lens to ‘competitive advantage/disadvantage’ and build insights.
The only comment I would make is that the best way to manage this risk is to:
o Build a good strategy that plays to one’s strengths
o Focus on strong execution
o Invest to build future capabilities
o Remain agile to respond to an evolving competitive environment
Thank you for detailed post on insurance sector. It is very useful for investors to get to grips quickly on the sector.
I refer to your comment below in your post#6
I came across this interview of Sridhar by Enam which has a contrarian view on life insurance opportunity in India:
… that the penetration of life insurance adjusted for per capita keep in mind that these are actually financial products. You cannot say we are 2.5-3% penetration and China is also 3%. Their per capita is four times larger than us. From a penetration standpoint also, this is one of the only product where India is over penetrated forex per capita. And my last point on life insurance is that there are roughly 300 million life insurance policies outstanding in the market as we speak, the total number of households are roughly 300 million and if you assume only half of them are insurable you are already talking of two life insurance policies per household. Whichever way I cut it, it looks over penetrated to me.
Read more at:
Sridhar Sivaram on sectors to buy into and avoid with a five-year view - The Economic Times
Few additional inferences I could draw while reading through various reports
Looking at these data points, it would be interesting to get your perspective on following questions -
Maybe you can address this with a post on opportunity / outlook for life insurance sector in India.
Thanks!
Post 17: How does a market linked product work?
A market linked product is a combination of a protection and an investment product. Customer pays premiums, gets a benefit of a life cover, some charges are deducted and the remaining amount is invested in equity or debt funds as chosen by the customer.
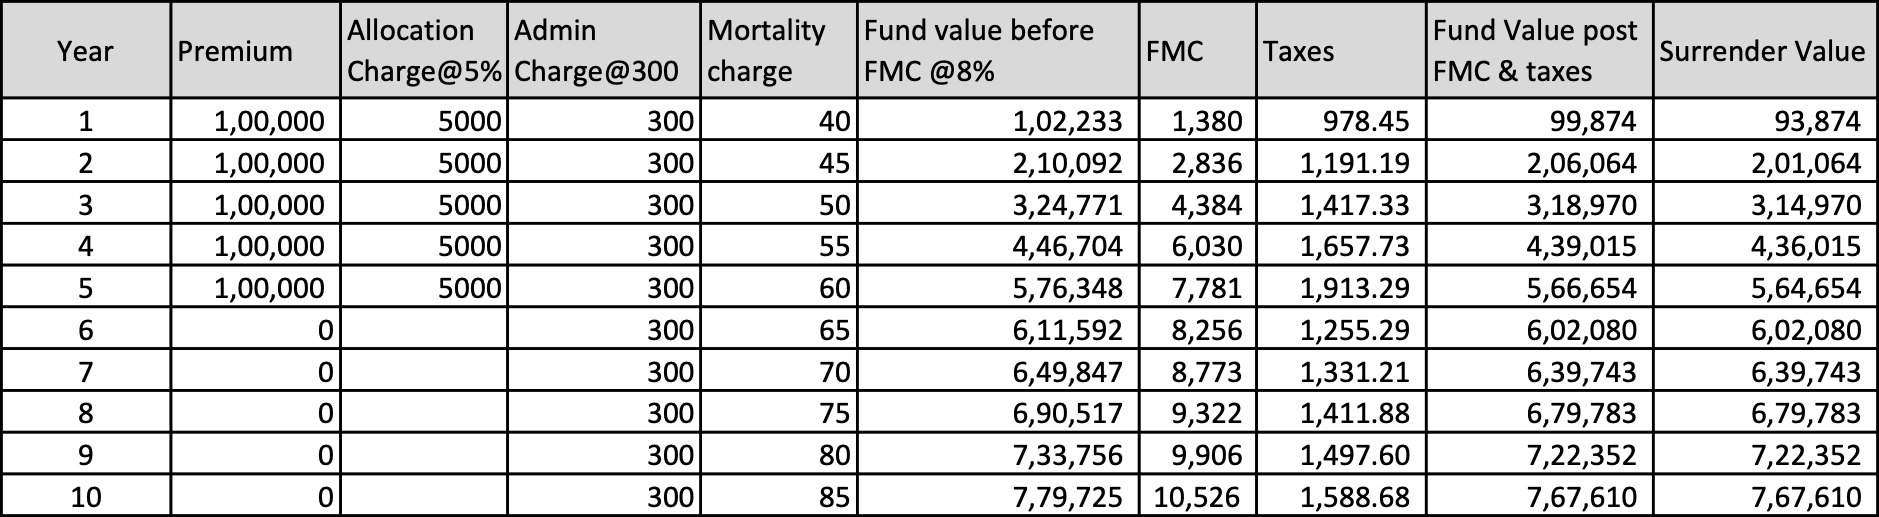
If one were to look at a customer benefit illustration, it would look like this:
This is the customer view. A few points to note:
• There are typically four types of charges – Allocation (initial charge on premium), Admin (monthly amount), mortality (for life cover), Fund management charge (FMC is applicable on fund value)
• While there is a lock-in for 5 years, surrender charges are low and infact, are zero after five years.
• Longer the maturity period, higher the customer returns and higher the charges that company can collect. Hence, there is an alignment of the interests of customers and company over the long term.
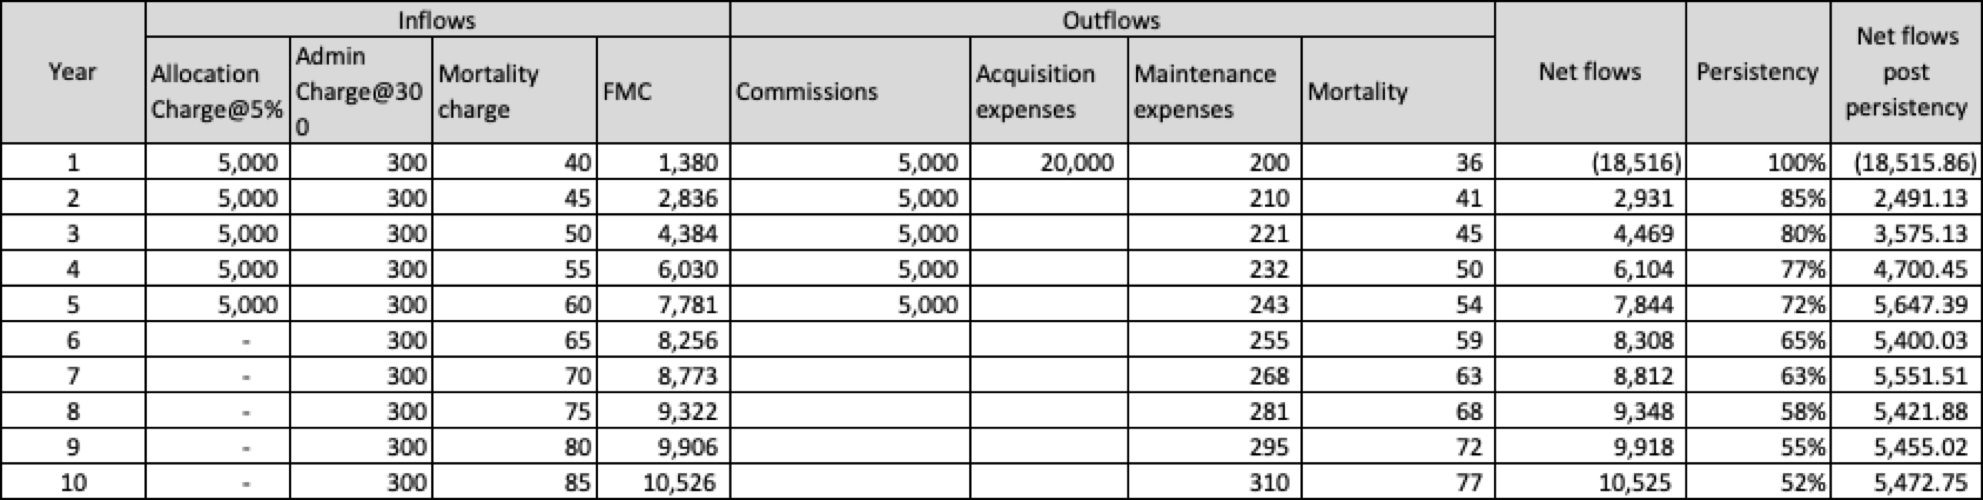
Now, let’s move on to the life insurer view:
In the case of market linked products, fund returns belong to customers. For the life insurer, the relevant cashflows are charges earned and expenses incurred. While charges are available in the customer illustration, expenses are not and hence, the insurer would need a separate view to look at its cashflows.
Key points to note:
• For the last column, NPV@7% is 11,362. Now, given premium was 100,000 p.a., the VNB margin is 11,362/100,000= 11% (remember this is an illustrative percentage)
• There is an initial negative cashflow which is called new business strain.
• Significant positive cashflows emerge later. If we do the NPV@7% for first five years, the number is negative 4,500. So, persistency plays a key role here.
• There is no significant impact of interest rates, while fund performance can impact FMC and hence, equity/debt market volatility can impact value.
• Impact of mortality can be marginal if experience is on expected line but if it varies significantly, it can impact value.
Key learnings:
• Market linked products can generate more value if persistency is better, expenses are lower and mortality experience is aligned
• There is strain at inception, so it consumes capital initially
• Interest rate impact is negligible
I have ignored many technical and regulatory requirements, but that’s fine for now since the objective is to just understand the product at a broad level.
Post 18: How does a participating plan work?
• In a participating plan, customers pay premiums and benefits include a guaranteed amount and bonuses which depend on the performance of the par fund.
• Premiums are invested in the par fund, expenses are deducted from this fund and bonuses are declared from the surplus that emerges. 1/9th of the cost of bonus is paid to the shareholders.
• If any excess surplus remains, post allowance for expenses and liabilities, this is called funds for future appropriation (FFA) and can be utilised for solvency. If any negative surplus emerges, this has to be funded by shareholders.
Lets take an example of the customer benefit illustration of a par endowment policy:
This is a customer view. Key points:
• Sum Assured is paid on death or maturity.
• Bonuses accrue every year and the total amount over 10 years is paid at maturity. Bonuses are not guaranteed and would depend on performance of par fund.
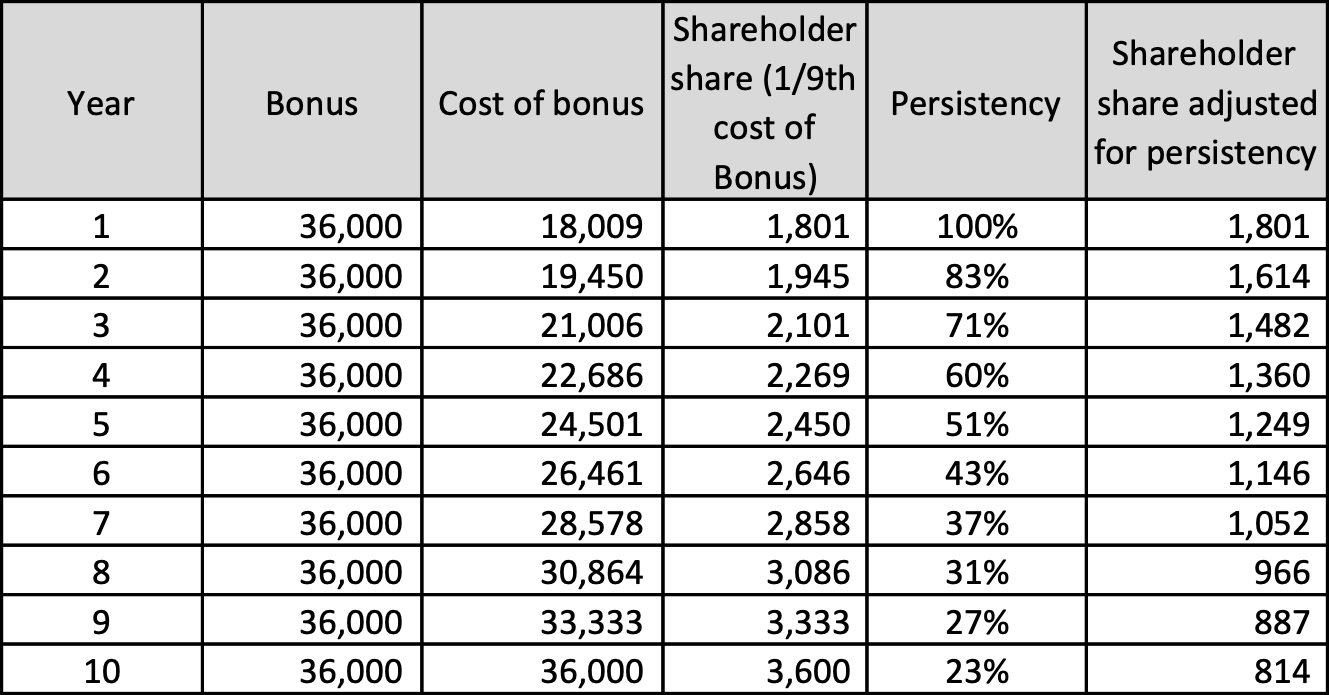
Now, when we look at company cashflows, the simplest view is to just take 1/9th of cost of bonus as the inflow, adjusted for persistency. So, for the above example, it would look like:
Key points:
• The cost of bonus is calculated by discounting the bonuses@8%. Shareholder share is 1/9th and we have adjusted it your persistency in the last column.
• We have ignored impact of expenses, surrenders, deaths, etc.
• For the last column, NPV@7% is 9,109. Now, given premium was 100,000 p.a., the VNB margin is 9,109/100,000= 9% (remember this is an illustrative percentage).
Key learnings:
• Eventual impact for the company for any positive or negative variance is ~10% since only 1/9th of cost of bonus will get affected. Hence, it’s not as significant as non-par categories. Also, this may limit the possible margins one can get from par.
• There is an interest rate risk but its lower since the level of base guarantee is low. Also, guarantee ratchets up each year as bonuses get added and since bonuses can be adjusted, interest rate risk can be mitigated to a large extent.
• Any initial strain will be funded by the par fund, does not impact company financials as long as the FFA is positive. However, there can be a solvency impact.
I have ignored many technical and regulatory requirements, but that’s fine for now since the objective is to just understand the product at a broad level.
Post 19: How may one build a view on the prospects of life insurance industry and within that, different product categories?
I have tried to share my personal views through a set of five questions. Will probably change the placement of this post later.
Q1) What are the needs that life insurance industry services?
Life insurance provides financial solutions to a wide variety of customer needs – life cover, regular savings, regular income, child education, wealth creation, hospitalization, critical illnesses, retirement planning, pension, legacy planning, coverage against liabilities, coverage for employees, etc.
These are relevant across the life cycle of an individual – as needs vary based on age, income, family situation, etc.
The key point is that life insurance business is well diversified in terms of customer needs, customer segments and distribution access.
Q2) Are these needs relevant today and will they remain relevant in the future?
In my view, many individuals may not have provided for these needs – either not at all or more likely, not adequately enough. Hence, they remain relevant today. Also, as one moves from a metro/ mass affluent segment to a non-metro/mass segment – the gap would be higher.
Measures such as penetration and density are estimates based on aggregates. While penetration looks comparable to other countries, density is significantly lower. However, these measures may or may not be best indicators of the runway ahead.
These needs would remain relevant in the future as long as – population increases, more people join the work force, more people start a family, income increases, health issues and health cost inflation increases, more people retire, people live longer, etc.
Q3) Are the life insurance companies well placed to tap these opportunities and remain relevant in the future?
Companies keep on working to improve products, innovate, provide new solutions, enhance service, reach out to a larger audience, adapt to changes in the environment, etc. They have demonstrated their ability to evolve in the past two decades and there is no reason to believe that this would not be the case going forward.
Q4) What products would be the key driver of future growth?
One can look at this from the customer lens – what’s important are the needs and products are just instruments to service those needs. Also, same product can be leveraged by different customers to fulfil different needs. This would also depend on the strategy which companies may adopt and the external environment.
In my view, all product categories are relevant and different products would drive growth based on various factors in different time periods. For example, there was a time when par products used to dominate, then came the era of pension plans, then market linked products drove growth and recently non-par savings & protection have picked up momentum. Also, as companies innovate, new products/solutions will be launched.
Companies need to have a wide bouquet available and then adapt over time.
Q5) How does one think protection is going to shape up in India?
Protection gap in India remains amongst the highest globally. Again, this is an estimated aggregate measure and may or may not be the best indicator for the runway ahead.
However, we do know that protection coverage is low in India and the key question is what can be the drivers that can change this. A few key ones are:
• Disposable income: Certain studies show a linkage with this metric in other countries and some would even try to estimate an inflection point using this. The key here is that as people earn more and improve their lifestyle, they would want more protection,
• Increasing awareness: There are some studies that show that SARS increased the awareness in China. Many expect that Covid19 has done/would be a key driver of awareness in India. In my view, it’s early to comment and we need to monitor this.
• Strategies of companies aligned to increase protection – with the increasing focus on protection in the past few years, don’t think there is any doubt on this one.
We probably have a long way to go on protection but it may be difficult to comment on the pace of the trajectory though.
Post 20: How does an individual protection plan work?
• In a pure protection plan, customers pay premiums and are assured of a guaranteed amount on death during the policy period.
• Premiums adjusted for all outgoes are invested in the non-par fund.
• Since customer benefits are guaranteed, any positive or negative experience impacts only the shareholders.
Lets take an example of the customer benefit of a protection policy:
• Customer pays premiums of Rs. 20,000 per annum for 40 years.
• She gets a life cover of Rs. 1 crore, payable on death during the policy term.
I haven’t shared a table for the above since it’s a simple benefit. One would need a table if it was a limited pay policy or there was a return of premium at maturity.
Now, when we look at company cashflows, we need to allow for all inflows and outflows. So, for the above example, it would look like:
Key points:
• The inflows include premiums and investment income. The outflows include expenses (including commissions), mortality and investment income.
• We adjust all cashflows for persistency and for simplicity, have ignored any impact of reinsurance. For the illustration, have assumed investment income@6.5%.
• For the last column, NPV@7% is 9,505. Now, given premium was 20,000 p.a., the VNB margin is 9,505/20,000= 48% (remember this is an illustrative percentage).
• Please note that the last column ignores detailed impacts of surrender, reinsurance, etc. and would not be an accurate representation of the profit cashflow. However, it serves our purpose for now.
• The key points to note are:
o Mortality cost is a key driver for margins
o Given that premium amount is much lower compared to savings products, maintenance expenses may be important over the long term
o For longer term policies and limited premium pays, investment income become important as well. So, interest rate risk exists and the impact depends on the contribution of investment income to net cashflows.
Key learnings:
• Non-par individual protection products usually provide higher margins but also bring significant mortality risk. There may be expense and interest rate risk as well.
• It is important for companies to build robust underwriting processes to ensure that premiums charged are adequate to mitigate any adverse mortality experience, particularly in the initial policy years.
I have ignored many technical and regulatory requirements, but that’s fine for now since the objective is to just understand the product at a broad level.
Post 21: How does a non-par savings plan work?
• In a non-par savings plan, customers pay premiums and benefits are guaranteed at inception.
• Premiums adjusted for all outgoes are invested in the non-par fund.
• Since customer benefits are guaranteed, any positive or negative experience impacts only the shareholders.
Lets take an example of the customer benefit illustration of a non-par endowment policy:
This is a customer view. Key points:
• Death benefit and surrender benefits are formula driven.
• At maturity, a guaranteed lump sum is paid to the customer.
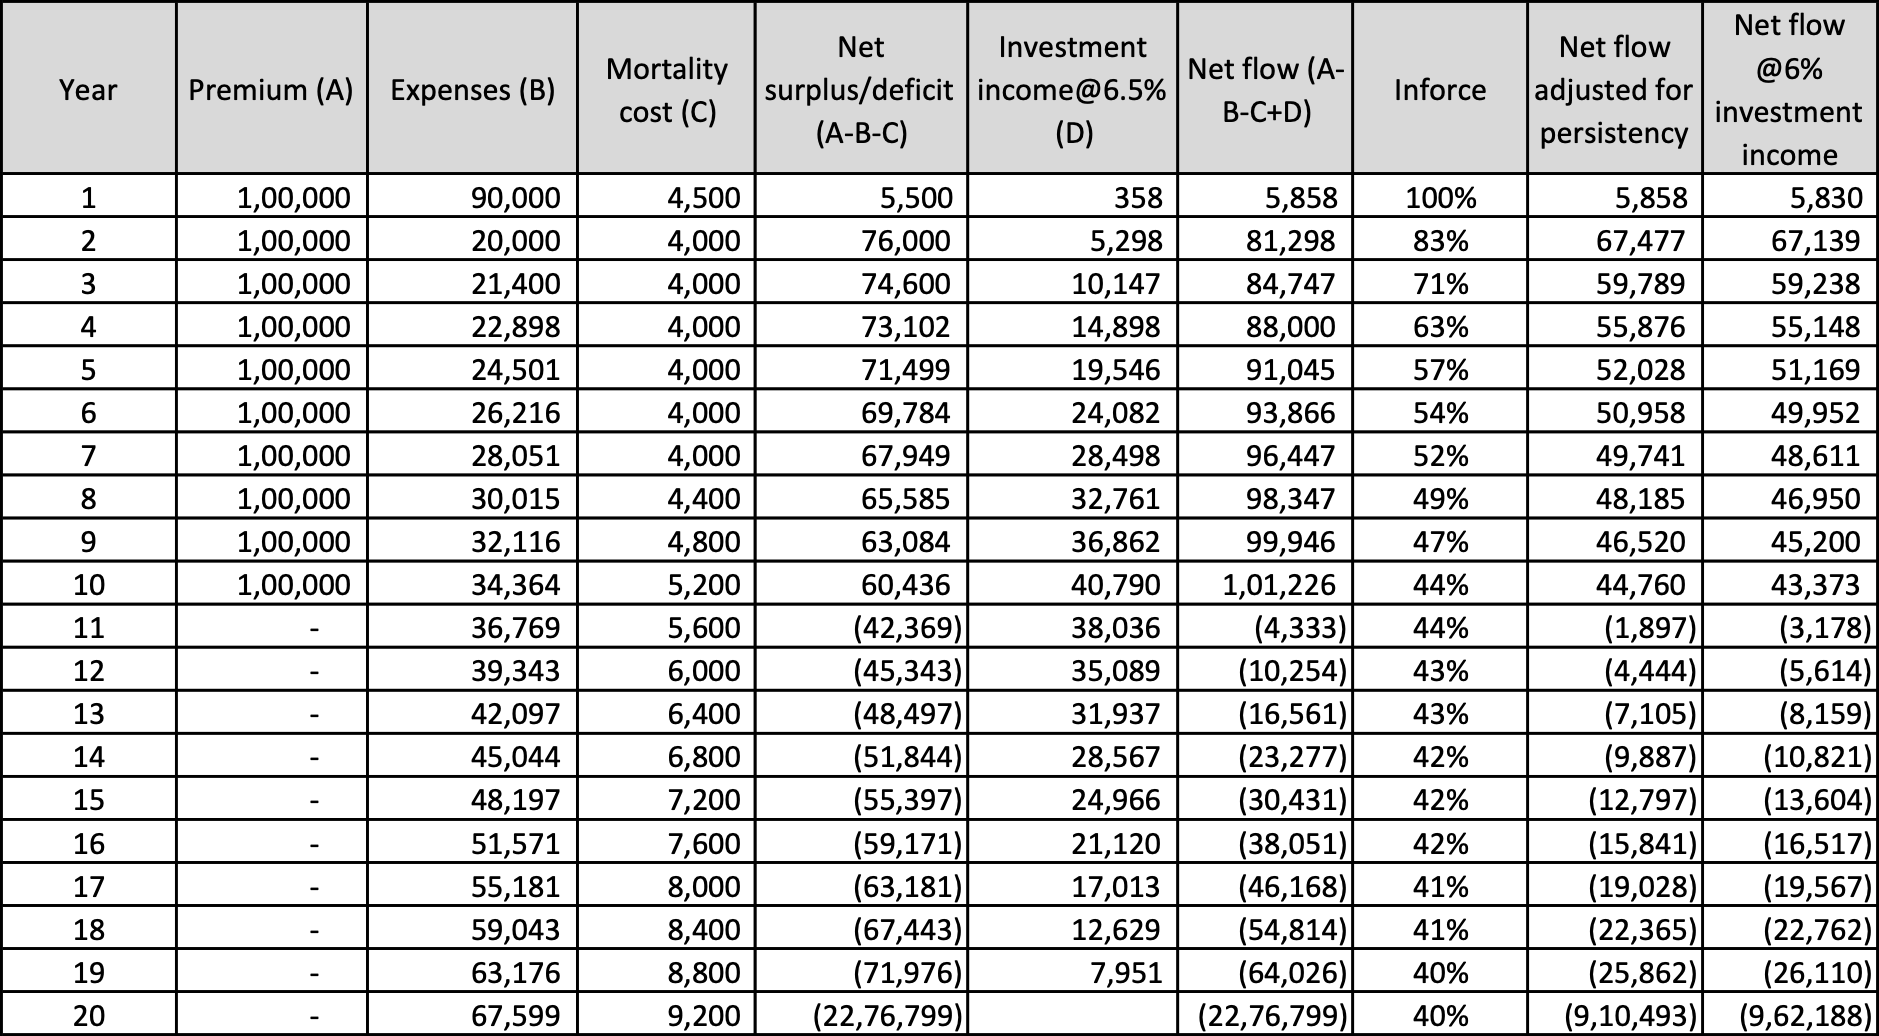
Now, when we look at company cashflows, we need to allow for all inflows and outflows. So, for the above example, it would look like:
Key points:
• The inflows include premiums and investment income. The outflows include expenses (including commissions), mortality and investment income.
• We adjust all cashflows for persistency and for simplicity, have ignored any impact of surrender payouts. For the illustration, have assumed investment income@6.5%.
• For the second last column, NPV@7% is 41,224. Now, given premium was 100,000 p.a., the VNB margin is 41,224/100,000= 41% (remember this is an illustrative percentage).
• The key point to note is that investment income is a significant component of the cashflows. For example, if we were to compare the ratio of sum of investment income (column D) to sum of premiums (column A), we get 4,30,545/10,00,000= 43%. Another way to look at this is of the total inflows (sum of columns A&D = 14,30,545), investment income contributes to 30% (4.3 lakh/14.3 lakh) of the same.
• To give a sense of the impact of interest rates, have included the last column where investment income is calculated@6%. In this case, NPV drops to 17,940 and VNB margin is 18%. So, a 50bps fall in interest rates leads to 23% absolute drop in margins (41%-18%). This example illustrates the interest rate risk in non-par savings products.
Key learnings:
• Non-par savings products usually provide higher margins but also bring significant interest rate risk.
• Hence, this is a category that one needs to monitor closely and companies need to ensure adequate hedging mechanisms are in place.
I have ignored many technical and regulatory requirements, but that’s fine for now since the objective is to just understand the product at a broad level.
Post 22: How does one understand profit for a life insurer?
Before we take a look at the financials for a life insurer, it may be relevant to discuss profit for a life insurer.
While there are many ways to look at this, I prefer the following approach:
Profit = Realistic expected experience - Actual experience
+ Release of prudence + Change in assumption – New business strain
Now, let’s look at the first three elements through an example of maintenance expense:
Realistic expected experience = Rs. 500 per policy
Actual experience = Rs. 450 per policy
Release of prudence = Rs. 20 per policy
In the above case, there is a maintenance expense profit of Rs. 70 per policy (500-450+20) on the inforce business. So, if the company had 1 Cr policies, this would give Rs. 70 Cr profit from maintenance expense for the current year.
Similarly, each source of profit will contribute a positive or a negative amount to the profit when we consider the first three elements. Other sources of profit may include investment income, morbidity and persistency.
There will be a negative contribution when actual experience is worse than the sum of (realistic expected experience and release of prudence). Usually, companies would try to avoid this scenario by tightening assumptions as they witness adverse experience.
This brings us to the fourth element:
Change in assumption: Let’s take the maintenance expense example. If we tighten assumptions, we will do it not only for the current year but also for future years which will result in an impact on current year profit. So, say actual experience was Rs. 510 per policy and we believe that it would remain at the same level for the next 5 years. So, impact is that we increase the assumption for future expected experience by Rs. 10 for next 5 years and it would reduce profit by Rs. 41 per policy (NPV@7% for Rs. 10 p.a. for 5 years). Just the reverse impact would be observed if we were to relax the assumptions.
Now, let’s look at the fifth element:
New business strain: is the negative cashflow at the time of sale of new business. As discussed earlier, this is not a bad thing if the value generated over time is positive. However, there is a negative impact on current year profit. So, higher new business will reduce profit.
We will look at these elements later when we discuss the financial statements.
Even an insurance company is not invincible
Few points from Q3FY22 conference calls of SBI LIFE INSURANCE, HDFC LIFE INSURANCE, ICICI PRUDENTIAL LIFE INSURANCE.
SBI LIFE:
HDFC LIFE:
ICICI prudential life:
I am really not able to come to conclusion in the context of the extent of reinsurance, who is playing safer for the longer term.
It will be very informative if the members help in forming a relation between the risk and amount of reinsurance done by insurers. And is it better to have an higher average Cover or a lower average cover.
Please delete if not inappropriate for the thread.  . I will post in a company specific thread.
Threads like these make me love valuepickr. Random people educating others selflessly. Hatts off.