Tech Mahindra : Investment bet?

I wonder that there is no thread about Tech Mahindra here.

Market Cap.: ₹ 46,178.53 Cr.Current Price: ₹ 474.15Book Value: ₹ 170.97Stock P/E: 14.59
Dividend Yield: 2.52%Face Value: ₹ 5.00
52 Week High/Low: ₹ 564.00 / ₹ 405.50
PEG Ratio: 0.56
Return on equity: 23.36%
Debt: ₹ 1,092.00 Cr .Debt to equity: 0.08
Profit growth: 20.16%OPM: 18.01%
Promoter holding: 36.24% Unpledged promoter holding: 36.24%
Return on capital employed: 30.35%
EPS: ₹ 32.50
Dividend yield: 2.52%Graham Number: ₹ 353.58
Intrinsic Value: ₹ 289.79Price to Sales: 1.62
Price to book value: 2.77Return on invested capital: 27.94%Profit growth 5Years: 26.18%Profit growth 10Years: 21.39%Average return on capital employed 10Years: 43.06%Sales growth 7Years: 28.98%Price to Free Cash Flow: 38.88Book value of unquoted investments: ₹ 1,261.70 Cr.Interest Coverage Ratio: 32.31Net cash flow last year: ₹ 1,187.70 Cr.Days Receivable Outstanding: 164.04

All are good nos.
Company is in Solution and Services, Outsourcing and Automation areas.

I think it is a good investment bet in current scenario.

Not invested, tracking.

1 Like

Though I am not tracking the stock, attaching MOSL research report for benefit of others
TECHM-20170327-MOSL-CU-PG010.pdf (303.5 KB)

Market Cap.: ₹ 40,897.77 Cr.
Current Price: ₹ 419.85
Book Value: ₹ 170.94
Stock P/E: 12.92
Dividend Yield: 2.84%
Face Value: ₹ 5.00
52 Week High/Low: ₹ 564.00 / ₹ 405.50
Promoter holding: 36.24%
Debt: ₹ 1,092.00 Cr.
Debt to equity: 0.08
Sales growth 10Years: 27.72%
Profit growth 10Years: 21.39%
OPM 10Year: 18.60%
Current ratio: 2.37
Altman Z Score: 5.88
Return on invested capital: 27.94%
Sales last year: ₹ 26,494.20 Cr.
Total Capital Employed: ₹ 13,246.90 Cr.
Average dividend payout 3years: 25.13%
Average return on equity 10Years: 30.64%
Average return on capital employed 10Years: 43.06%
Cash 3Years back: ₹ 1,451.90 Cr.
Cash end of last year: ₹ 2,393.30 Cr.
Cash beginning of last year: ₹ 1,205.60 Cr.
Dividend Payout: 37.25%
Dividend last year: ₹ 1,161.40 Cr.

Eventhough IT is facing lot of headwinds i believe in the resillience of Indian IT in medium terms definetly. At pe of 12.9 and div yld close to 3% tm looks a value at the moment.

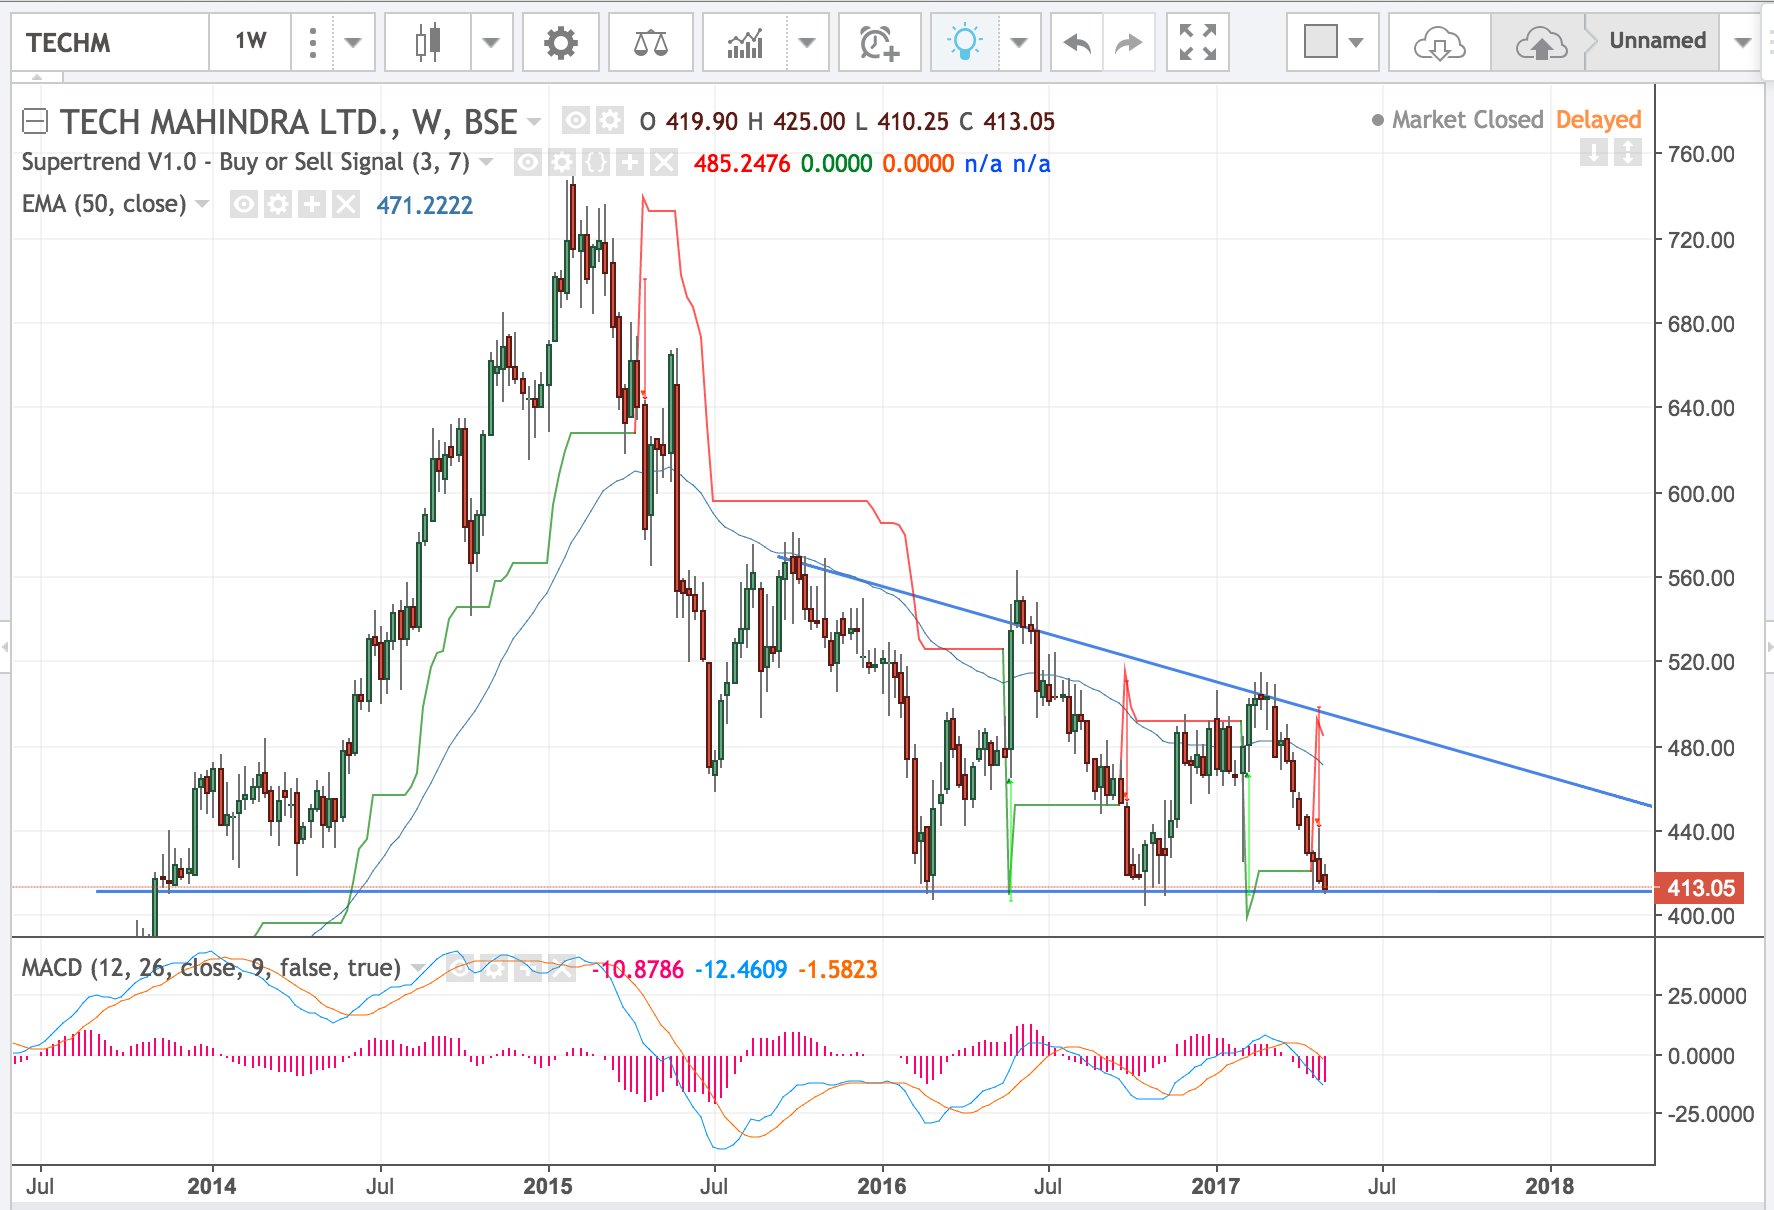
Weekly chart of TechM attached.
The current price has been a strong support level on the Daily, Weekly, and Monthly charts. Coupled with favourable fundamentals, as discussed above, any bounce from here will be a positive indication, with resistance at 480 and 500 levels.

Disc: Not invested. Tracking to invest

Results https://nseindia.com/corporate/TML-Q42017_26052017160012.zip