Indian Diagnostics Report (Phillip Capital Research)
Industry Overview:
-Key reasons for industry tailwinds:
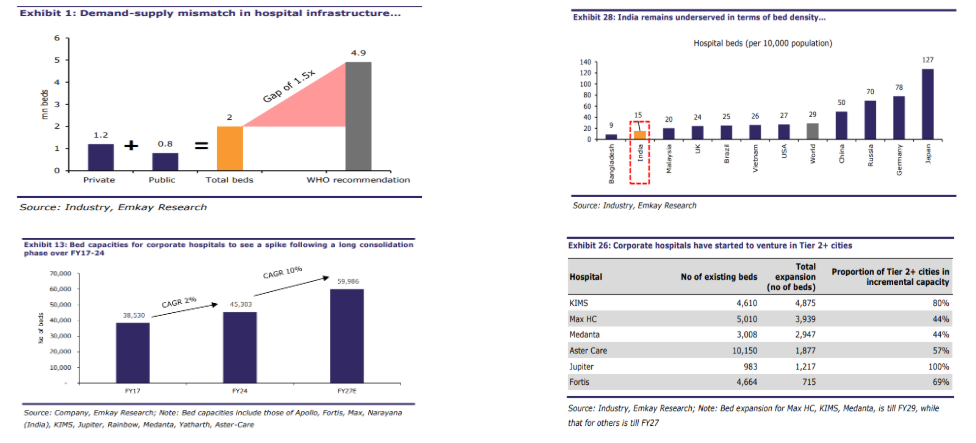
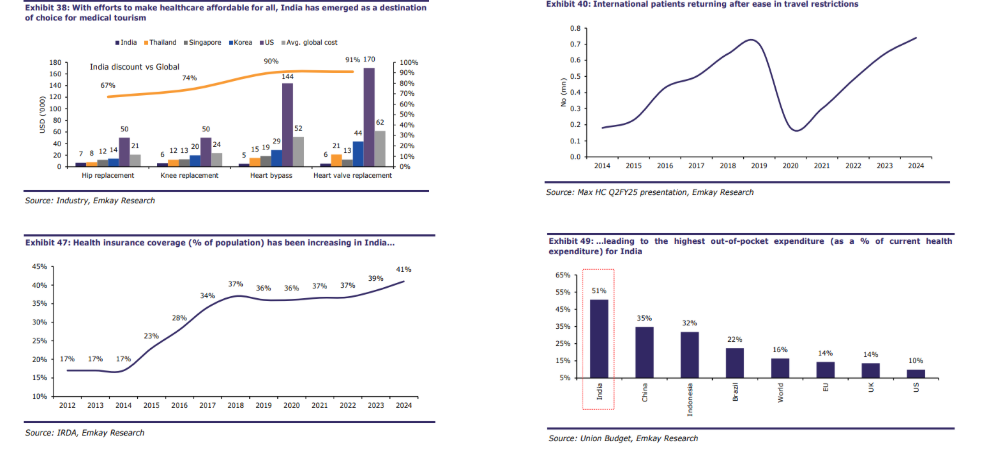
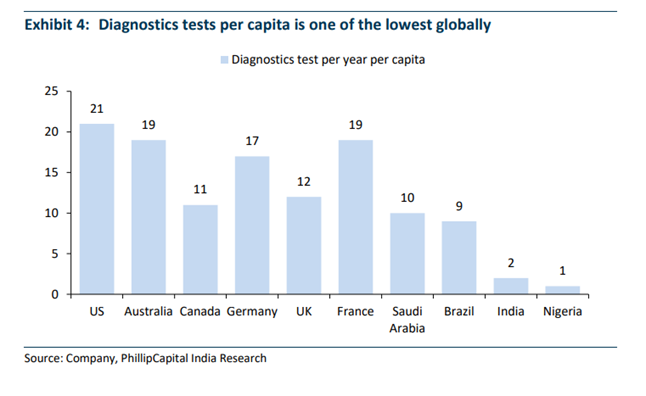
o Significant under-penetration of diagnostic services (6% of healthcare market)
o Low organize market share (15% only) which will increase
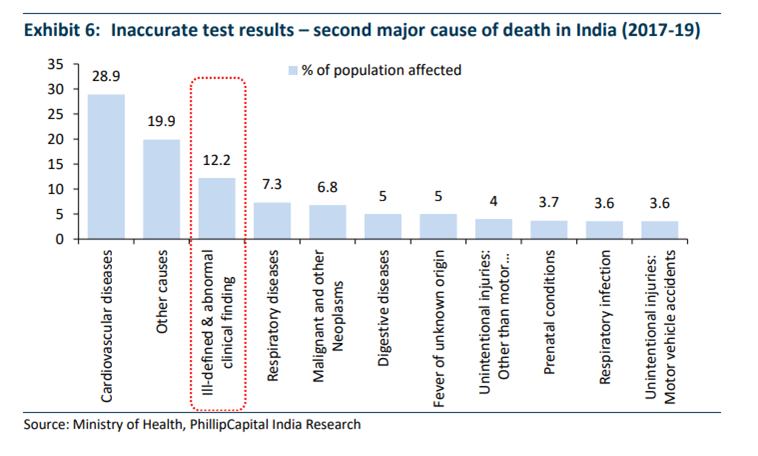
o Low lab accreditation and misdiagnosis (12% causes of death)
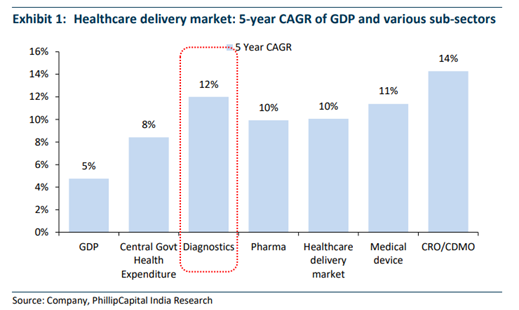
o Fast-growing trend of preventive diagnosis (12% Share)
o Initiatives by Govt. of India
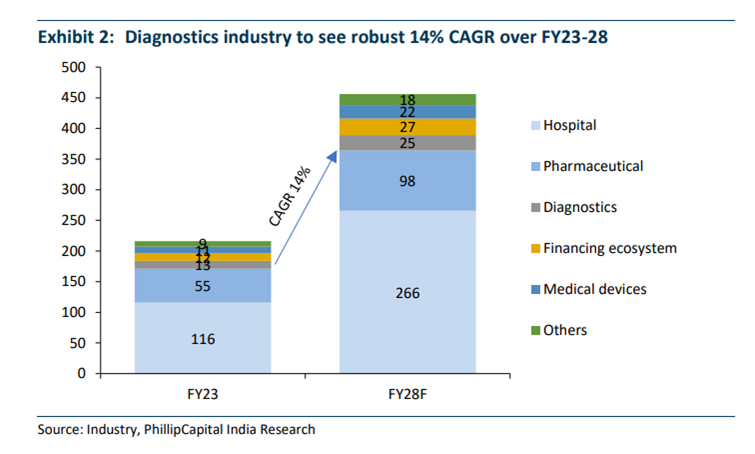
- Organize diagnostics is estimated to grow at an 14% rate over FY23-28, set to outpace industry growth
Industry fragmentation based on Diagnosis Tests:
Current market share distribution in diagnostic industry:
-
Organized Chain – 15%
-
Hospitals: 37%
-
Standalone Centres: 48%
Geographical mix of test volumes:
-
Rural Share: 66%
-
Urban Share: 34%
This highlights vast untapped potential for organized player’s expansion
Structure of pathology market:
- Specialized tests have relatively smaller pie (20% of pathology market) but are growing at a high pace led by an aging population and awareness
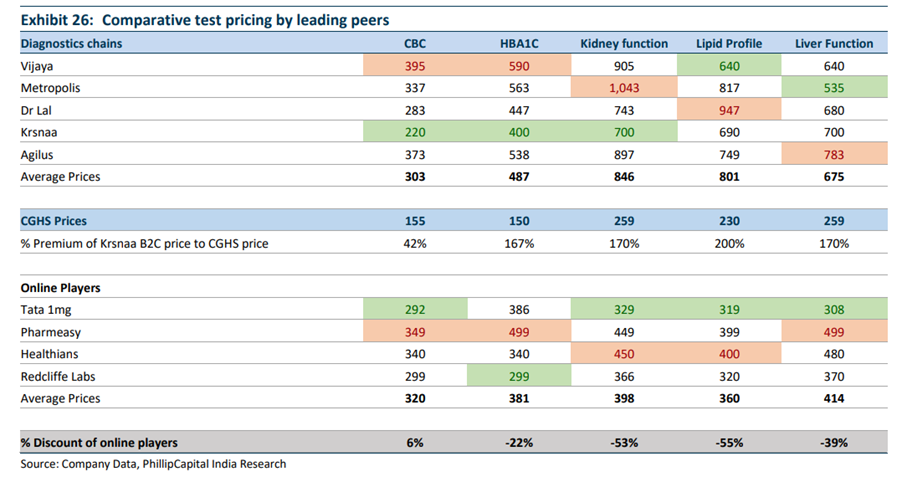
Comparative Test Pricing by leading peers in Pathalogy Market:
-
Premium and high price players: Metropolis in Mumbai & Hyderabad, Dr.Lal and Agilus in Delhi, Vijaya in Hyderabad
-
Krsnaa Diagnostics operate at a lower cost as compared to peers
-
Online players usually have less price as compared to offline players and have uniform pricing across states
![]()
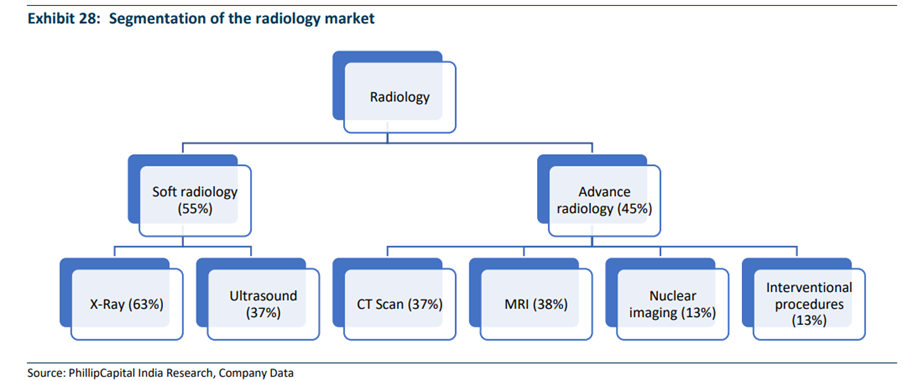
Structure of Radiology Market:
o Soft Radiology: 55% of market; basic tests like X-Ray, Ultrasound
o Advance Radiology: 45% of market; CT Scan, MRI, Nuclear Imaging, etc.
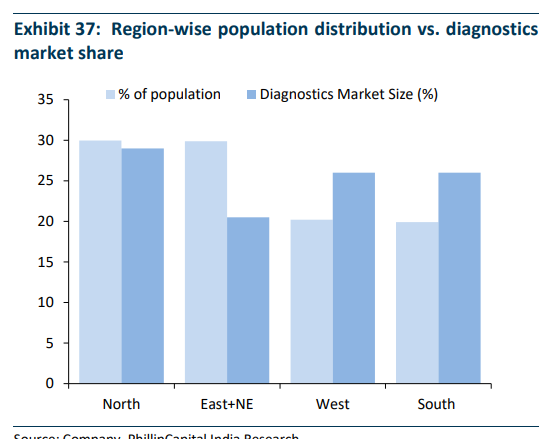
Geographical Distribution of Indian Diagnostics:
-
North India leads the market due to high population (28-30%), Dr. Lal has positioned itself
-
South India has the best infrastructure and disease prevalence (25-27%); highest bed density, doctors,etc
-
Western India has the most premium market with around 70% of India’s total NCD (Non Communicable Diseases), which makes it attractive for diagnostics
-
Eastern India lags behind and has highest growth opportunity due to under-penetration
Business Models for Positioning in this Market:
o Nature of Service : Only pathology test with or without minimal soft radiology
o Rationale: For the mass, asset light, lower capital intensive
o Listed Peers (Best to least positioned): Dr. Lal, Metropolis, Thyrocare, Agilus
o Nature of Service: Pathology & Radiology (more focused)
o Rationale: Capital Intensive, less competitive, higher growth, B2C oriented
o Listed Peers (Best to least positioned): Vijaya, Suraksha
o Nature of Service: Pathology & Radiology in govt. hospitals
o Rationale: Scale of operation, high volumes, test realizations are lower, less capital outlay
o Listed Peers (Best to least positioned): Krsnaa is the leader, second largest volume in industry (after Dr. Lal), second highest number of tests per patient (after suraksha), largest radiology revenue
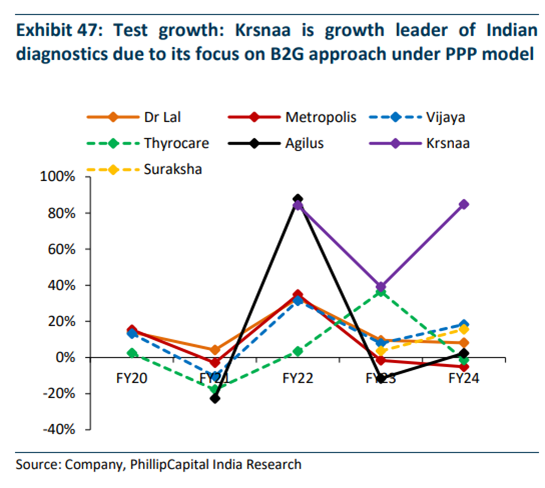
Story from Charts:
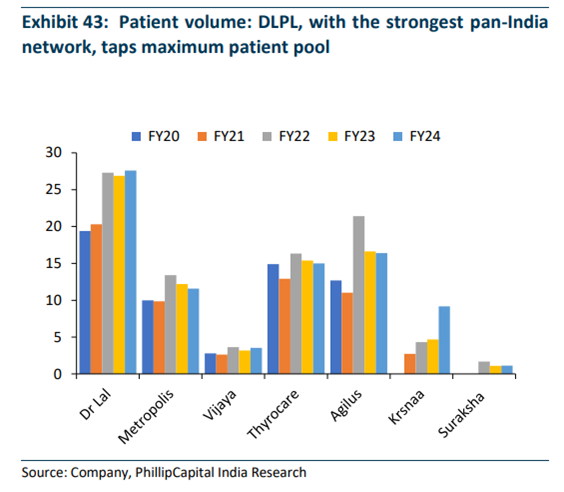
-
DLPL has highest network and patient pool
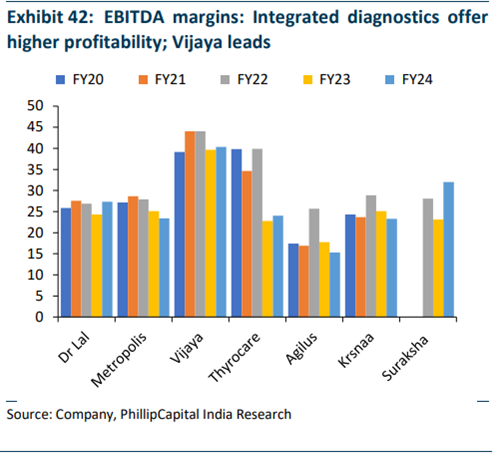
-
Vijaya leads in margins; Integrated diagnostics offer higher profitability
-
Krsnaa is leading in test growth due to its focus on B2G
-
DLPL leads in revenue growth in Pathology with 12% CAGR over last 5 years
-
Krsnaa leads in revenue growth in Radiology with 30% CAGR