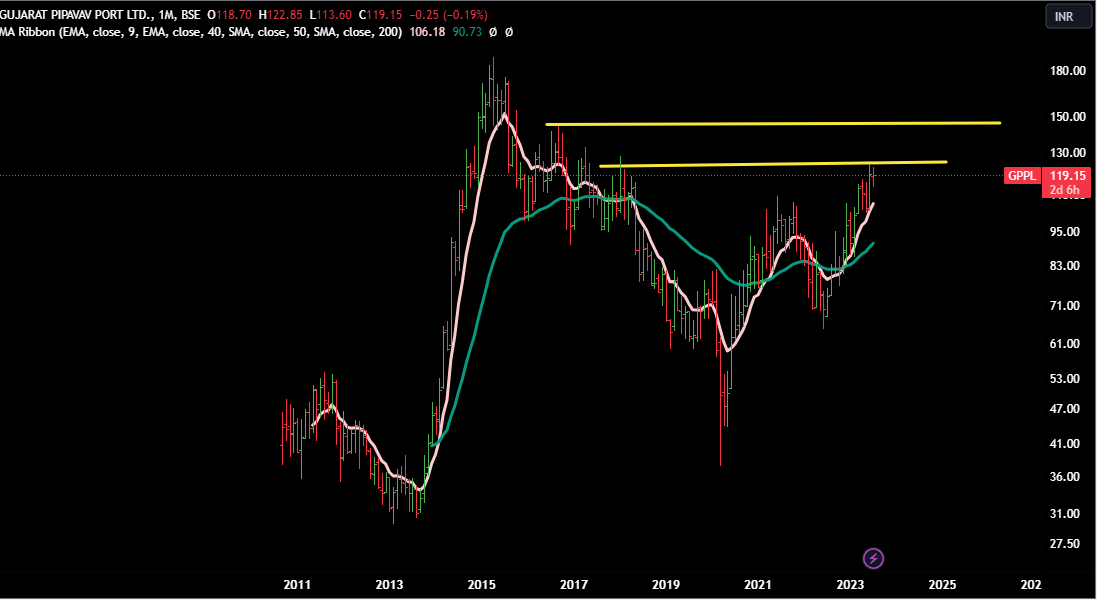
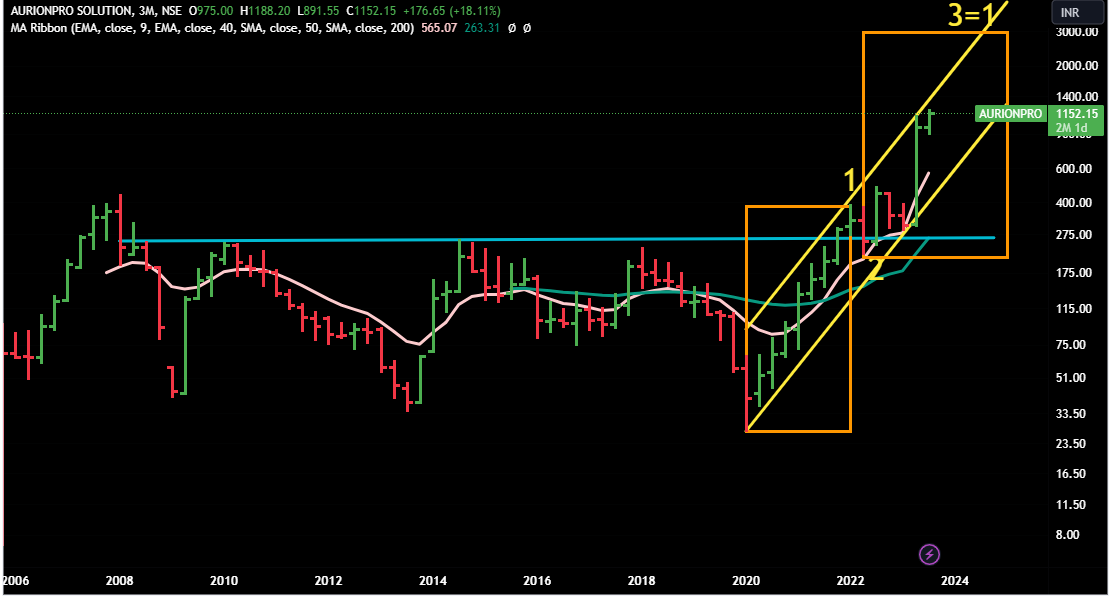
It does not have very long history. From EW prespective, we’re taking a hint from trianglebrakout . Triagles are normally 4th waves so we can assume that we’re in 5th wave.
If this is true, then long way to go.
But keep in consideration, that monthly chart projections take months to reach the level.
Disclaimer : This post is just for learning few methods of price-patterns. Views are personal and are purely based on our limited knowledge of charts. No buy/sell recommendations. These are probability-study methods and chances of success/failure depend upon various factors
Vivek ji - we don’t look for short term trading opportunities. We take long term positions ,hence we don;t bother about quarterly results and price movements. We just focus on our set-ups. If the set-up is intact, we stay invested.
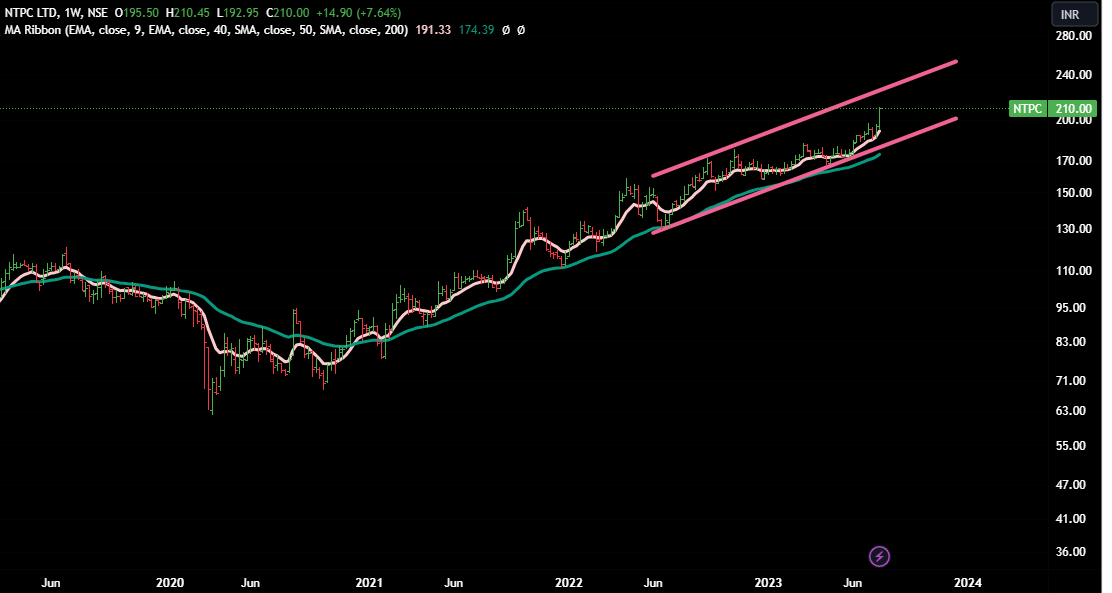
NTPC
CMP 210
Well it has lot of internal ovelapping waves so not so clear marking can be done as of now.
It is near to upper end of recent parralel channel ,hence can expect some resistant near 225-230.
Once it starts closing above this channel , then we would try marking it.
We tend to stay away these kind of charts where we’re unable to count clearly and that too at the time when there are many other opportuities avaialble ( remeber we’re in a bull market)
Disclaimer : This post is just for learning few methods of price-patterns. Views are personal and are purely based on our limited knowledge of charts. No buy/sell recommendations. These are probability-study methods and chances of success/failure depend upon various factors
Hi @StageInvesting Thanks for generously sharing knowledge. Could you please share EW perspective for Motilaal Financial and Gujarat Pipavav. Thank you.
Has lot of resistance at 130 and 145 . Let it cross these , only then it can get into fast uptrend.
And please do always check relative strength of a stock in investing . If stock is moving faster than index, there you will make more money in small time .Otherwise you may miss the bus in a bull market .
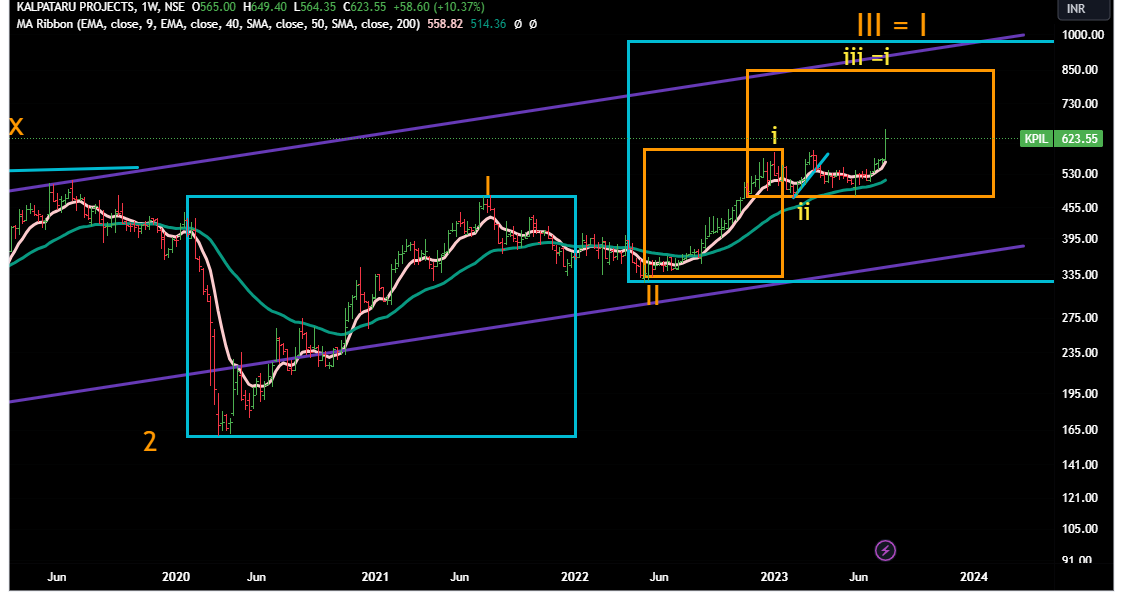
One of our long term core-portfolio .Sharing it from the levels of 228.
Elliot Waves can be learnt by everyone who is ready to put few years of efforts and practice.
Unlike other methods , it gives long term targets and a set-up that can be tracked like we track quarterly resutls of a company .
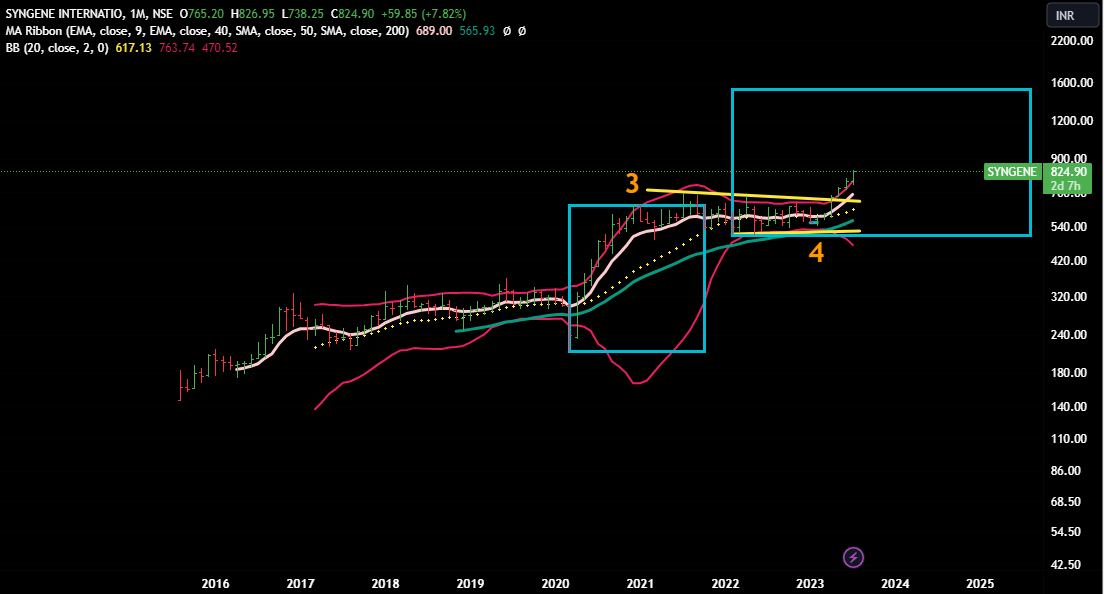
Seems to be in a long term bull run though overheated in short term and is near to upper end of the channel . Once it starts giving close above the channel for 1-2 months, then it will start its journey to next level.
Monthly Chart
Keep in mind that monthly chart work over duration of months and years.
Disclaimer : This post is just for learning few methods of price-patterns. Views are personal and are purely based on our limited knowledge of charts. No buy/sell recommendations. These are probability-study methods and chances of success/failure depend upon various factors
Too many questions from you in short period, hence would avoid putting a chart for Abbot. But in nutshell, would say that for long term , it is in Bull run.
Aditya Vison .The accounting concerns raised were more of noise well answered by Mgmt in last concall & transcript posted in AVL thread .
Some high quality marquee investors like Ashish Kacholia who doubled his stake in last qtr to 2% , Envision PMS,Sameeksha , Stallion, East lane capital has invested who invest only after doing good homework.
Co execution has been great in under penetrated hindi heartland where demand & aspiration level quite high after increase in electricity availability. valuation still reasonable. Disl Invested & biased.
PPT & Concall transcript enclosed for benefit of VPers