
Added the following in last few days:
9. PDD
10.InMode
11. HPQ
12. PAAS
1 Like
Hi @StageInvesting thanks for sharing your knowledge and information generously. Could you please share platform you are using for investment out side India in US market. TIA.
Can you share your views on Time Technoplast Ltd & Add-shop E-retail?
Hi @StageInvesting , can you pls share your views on SRF, technically and fundamentally if you track it.
Requesting for a chart check on Stylam Ind after the recent pullback. Thank you.
Hi @StageInvesting can you please share views on ![]()
Nath Bio-Genes (India) Ltd
1 Like
This company is in our ‘never-to-invest’ basket.
2 Likes
Wait for the turaround . The last move ws very quick ,hence BB has to squeeze a bit and RSI had to cool off.
1 Like
We’re staying away from chemical companies stocks for at least one/two quarters. We try to avoid those stocks that are not in upward momentum as we’re not contrarian investors.
1 Like
Avanti CMP 413
To start any real long term upmove ,it should first start trading and closing above 435 (sky-blue line ) and then above 490 (yellow line )
Weekly Chart
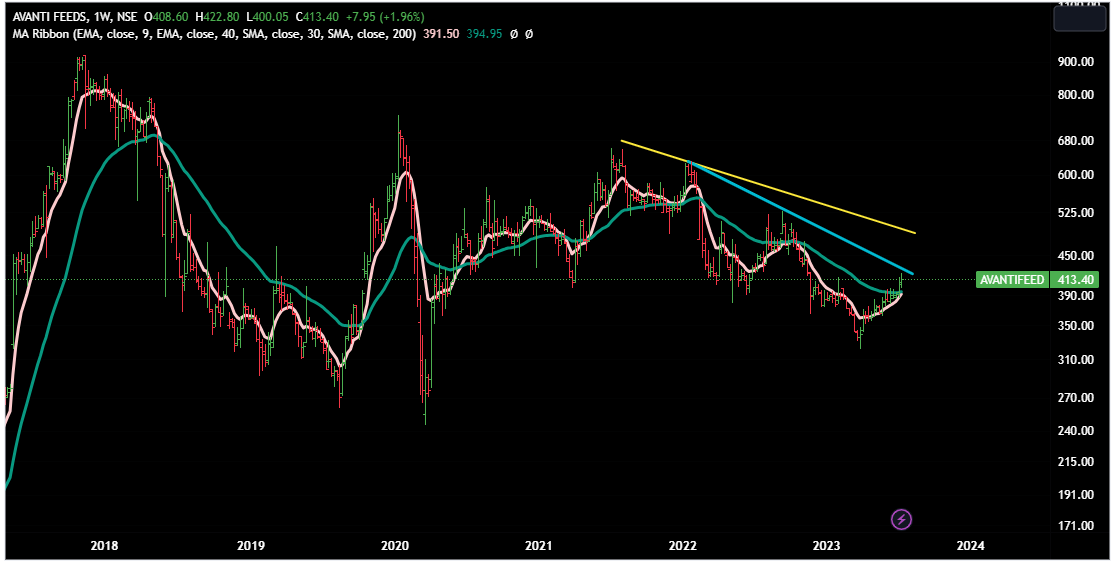
No buy /sell reco. Only for technicals -study.
2 Likes
Please refer to the following post on DXY - now it has broken down.
Metals have shown intial signs of turning around…but let’s wait for more confirmations.
Keep in mind that all stocks in a sector move in a herd - if the sector moves, everything moves. Skill lies in choosing the ones that have bigger runway ahead of them.
AIA Engineering
CMP 3363
Quarterly Chart shows that we’ve a long way to go in coming 2-3 years.
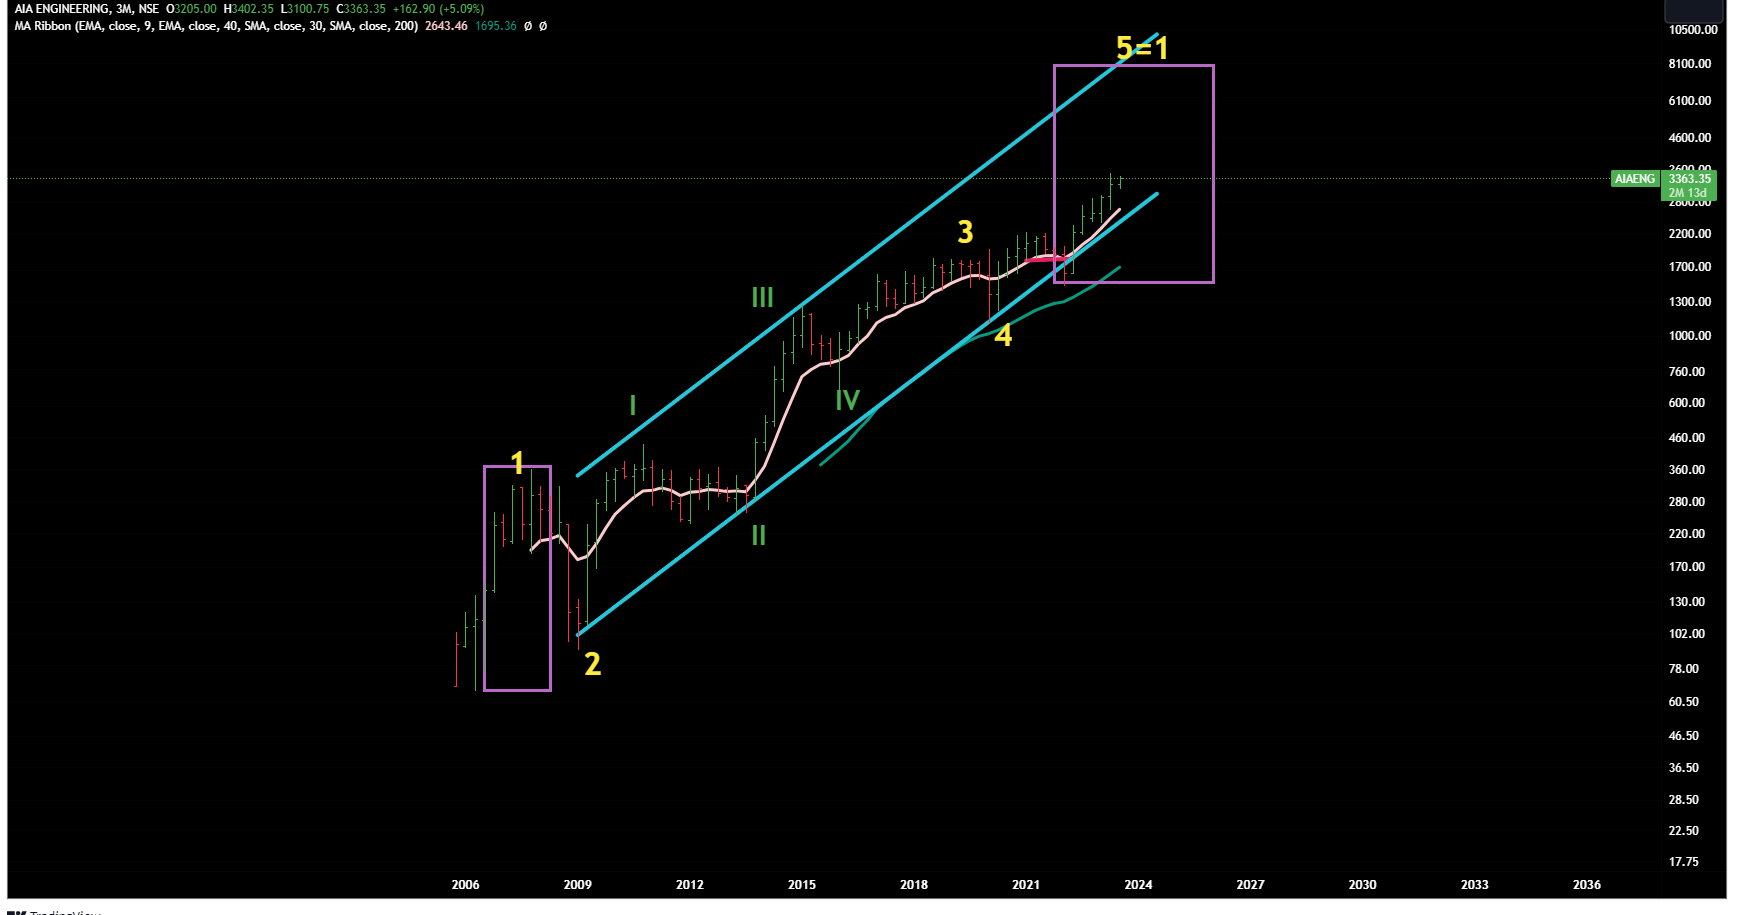
Disclaimer : This post is just for learning few methods of price-patterns. Views are personal and are purely based on our limited knowledge of charts. No buy/sell recommendations. These are probability study methods and chances of success/failure depend upon various factors
Motherson Sumi (Samvardhna)
Showing signs of Stage 2.
Had closed above first trading range (TR1) last week and just below TR2.
If it gives a close above 97 (TR2 ) on this weekend ,then we will have long way to go - only hurdle would be 135 (ATH)
Fingers crossed, let’s see how it pans out in coming weeks.
Weekly Chart
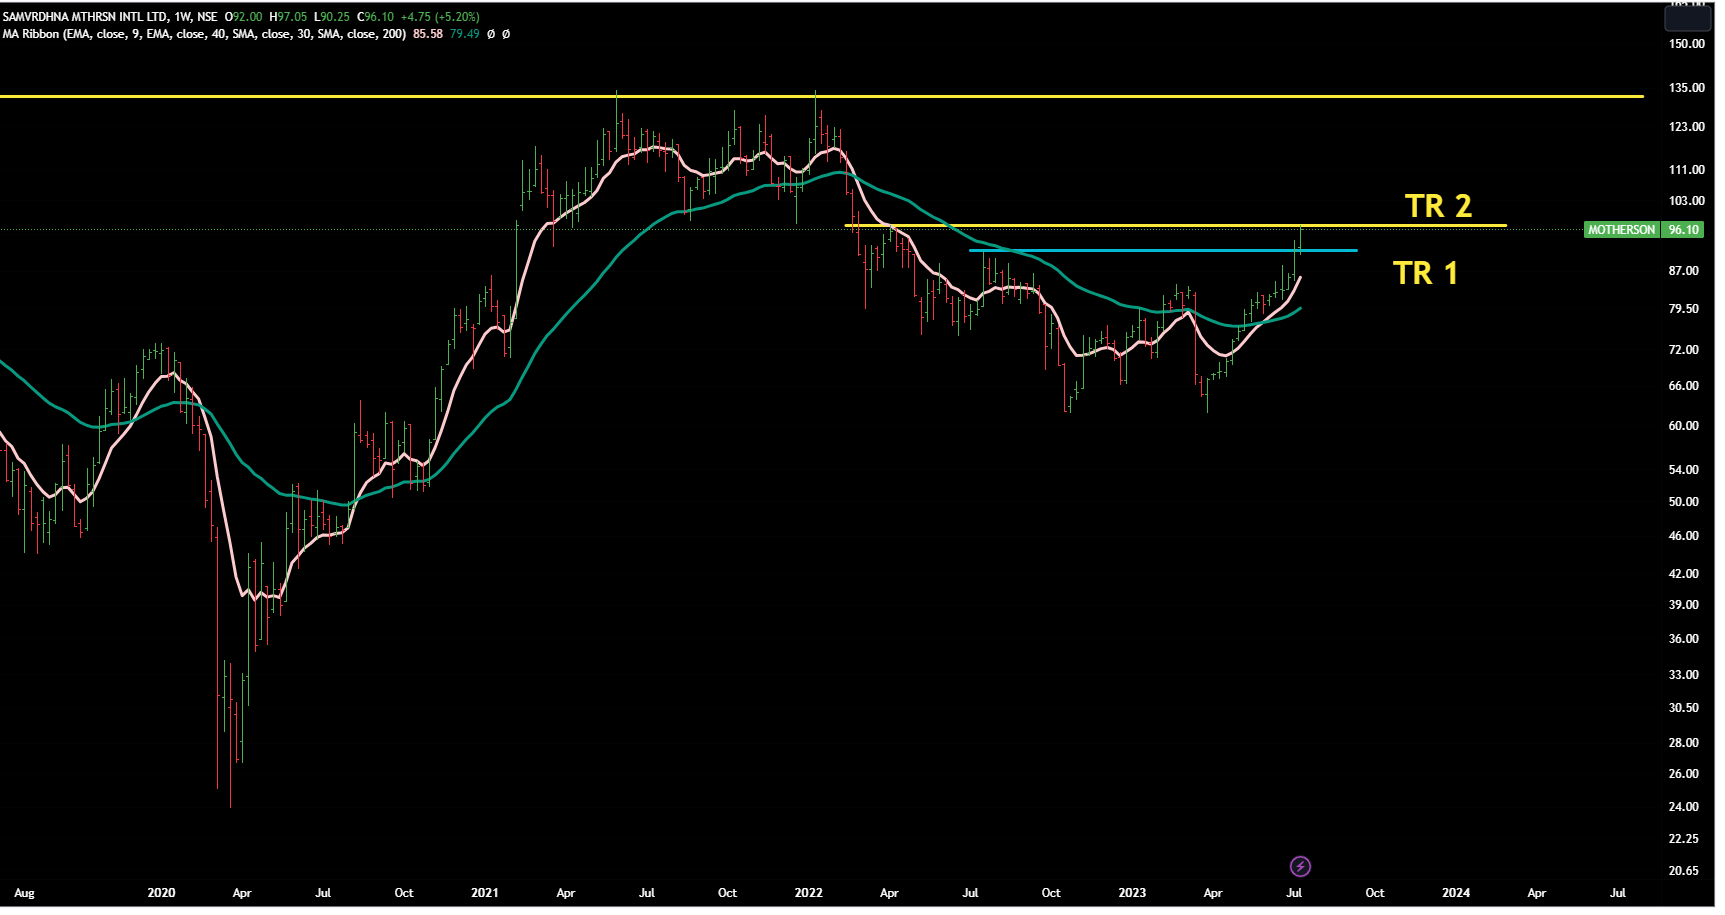
Disclaimer : This post is just for learning few methods of price-patterns. Views are personal and are purely based on our limited knowledge of charts. No buy/sell recommendations. These are probability-study methods and chances of success/failure depend upon various factors
1 Like
Dear @StageInvesting
Thank you for generous views and open sharing.
Any major changes in Indian PF last 4 weeks ?
1 Like
Portfolio Update -July 17
Added Muthoot Cap , re-addition of Intellect and exited Dynemic Products,Happpiest Mind ( it was the quickest entry and exit ) .
We’re in a long bull market - and we identified the horses of long-run at the beginning , hence no plan to change them midway.
Yes we keep doing small proift booking here and there by selling 5-10% from those stocks where the run has been very ferocious.
Need to generate some cash if some equally exciting opportunity comes along or to add more on old -holdings.
5 Likes
JKIL J Kumar Infra
CMP 327
If India infra-story keeps playing, this looks possible.
Based on EW and Stage Analysis method , this weekly chart looks interesting.
Next level to watch-out for is 352.
Weekly Chart
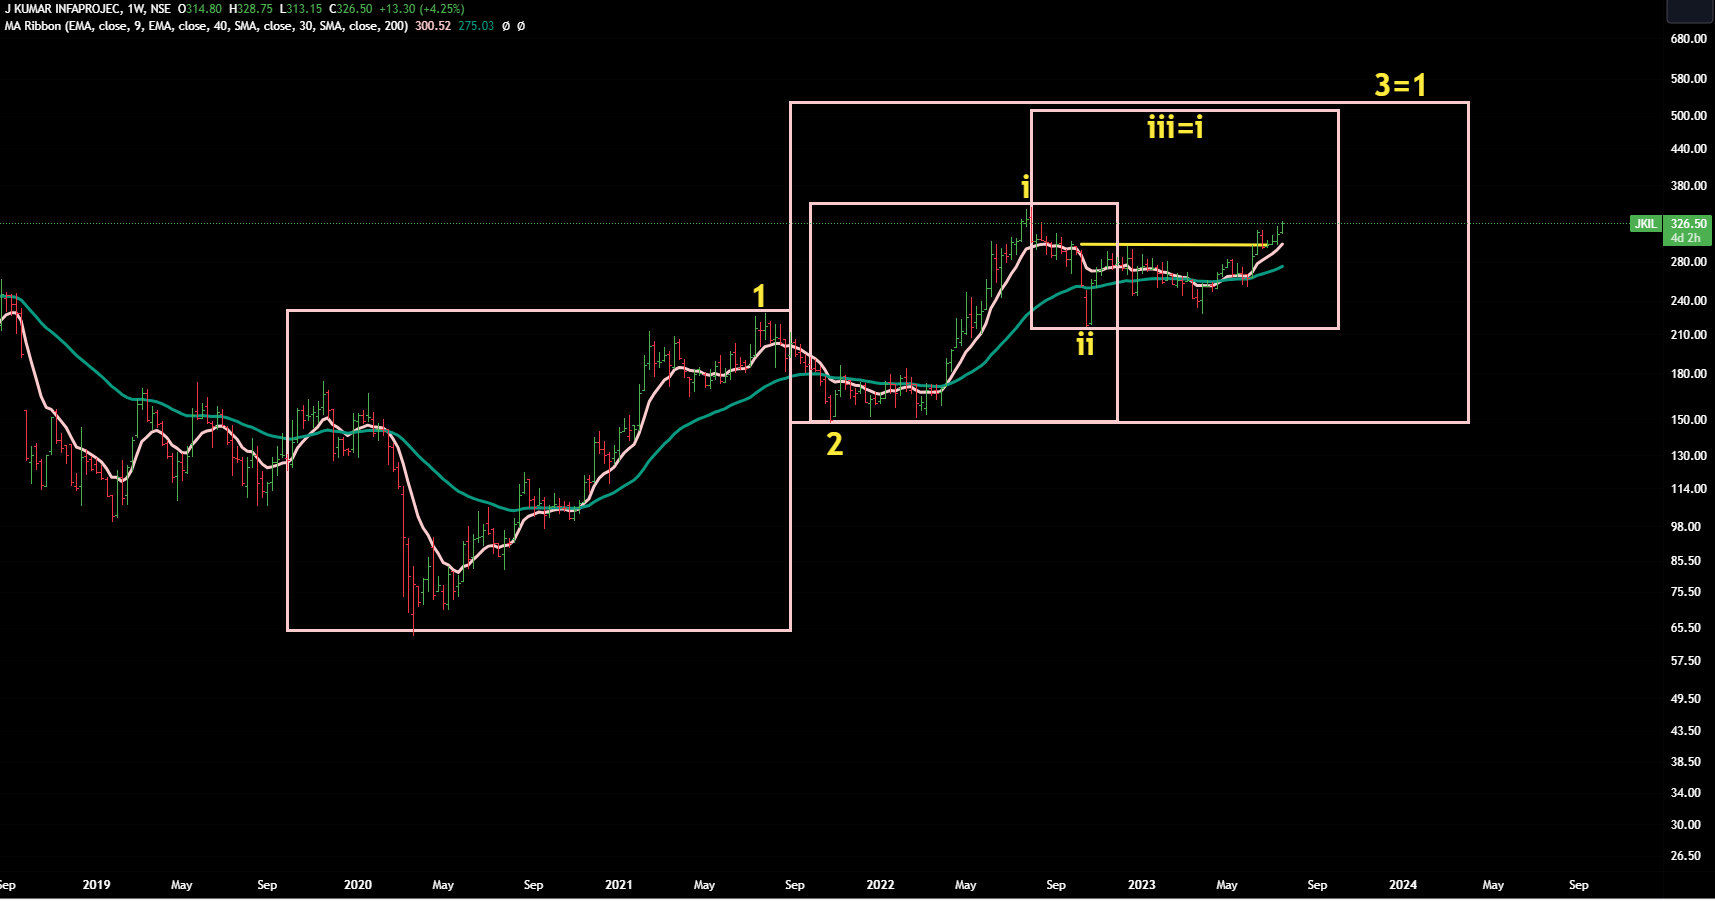
Disclaimer : This post is just for learning few methods of price-patterns. Views are personal and are purely based on our limited knowledge of charts. No buy/sell recommendations. These are probability-study methods and chances of success/failure depend upon various factors
I think you missed this while scrolling.
We don’t know much about ADD-SHop - so no comments.
( we avoid those stocks where we don’t know the company’s fundamentals and long-term play)
Time Technoplast
CMP 137
Looks good.
Should go much higher in next 2- 3 years- off course with ups/downs.
Next major resistance should come near 220 -the high made in2017 -the yellow line and upper end of the rising channel .
Once that hurdle gets crossed - then next leg of journey will start.
Weekly Chart

Disclaimer : This post is just for learning few methods of price-patterns. Views are personal and are purely based on our limited knowledge of charts. No buy/sell recommendations. These are probability-study methods and chances of success/failure depend upon various factors
2 Likes
Hi @StageInvesting , ASAHI INDIA, Only if it is above 610 and RSI is above 55, it is can be considered for long tread? Thanks in Advance for your valuable input
Thanks,
Satish