Hi everyone,
Following up on my earlier post about Screener Specter, I’m excited to share a major upgrade we’ve just rolled out based on a lot of work and user feedback.
We’ve fundamentally rebuilt the AI core to be much smarter and more useful for deep-dive analysis.
Here’s what’s new:
- Industry-Specific Intelligence: The biggest change. The assistant uses different models specific to the industry. This means when you analyze a transcript, it will automatically focus on the right KPIs:
-
Banks: NIM, CASA, GNPA/NNPA.
-
Auto Ancillaries: Content per vehicle, OEM vs. Aftermarket mix.
-
and many more
The output is now far more relevant and mirrors what a sector-specific analyst would look for.
- Automatic Target Extraction: The AI now automatically finds and lists all forward-looking guidance and targets mentioned by management. This creates a “Management Scorecard” in the summary, making it easy to track promises on revenue, margins, capex, and timelines.
The goal was to move from a generic summarizer to a true, specialized research assistant. Hope this proves even more useful for everyone’s research process.
As always, open to feedback and suggestions from this wonderful community.
Chrome Web Store Link
2 Likes
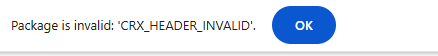
Error message that pops up after download.
its a wonderful tool. (taken help from chatgpt for format)
When analyzing financial ratios, it’s not enough to look at individual ratios in isolation. For example, a stock with a P/E ratio of 10 may initially appear attractive if the industry average P/E is 15. However, if you then compare this with other financial metrics — such as weak sales growth and declining PAT, or a Price-to-Book ratio that’s over 5 times the ROE — it indicates underlying performance issues. In such cases, despite a seemingly low P/E, the stock might not be a good investment at current levels.
There should be a compact, interconnected table or framework where different ratios are linked logically with related financial metrics. This would allow an investor to understand the overall financial health of a company by seeing how one ratio interacts with others — preventing hasty conclusions based on a single metric.
Example:
| Metric |
Value |
Industry Avg |
Linked Metric |
Interpretation |
| P/E |
10 |
15 |
Sales, PAT Growth |
Looks undervalued, but check growth trends |
| Sales Growth (YoY) |
2% |
10% |
PAT Growth |
Underperforming in topline |
| PAT Growth (YoY) |
1% |
12% |
ROE, Net Profit Margin |
Weak profitability |
| P/B |
5.5 |
2.5 |
ROE |
Expensive if ROE is low |
| ROE |
11% |
15% |
P/B |
Return on equity not justifying the valuation |
4 Likes
Still the same error. may be its just my computer.
@Daksh_kothari
Great insights.
You are right. Its a great idea to interconnect forensics. We will keep a note of that.
We are currently working on peer comparison, it will have a concise as well as detailed comparison. Also we are trying to connect it to the industry trends and company outlook/guidance.
@Rohit_Sharma5
Can you may be send a screenshot of the error? It might help in figuring out the issue.
1 Like
