
Hi there folks, just wanted to know if there is any impact or potential challenges of Trump tariff scenario on this company? There is a fear of accelerated dumping by China. The company depends on coke import from China. This also belongs to the Metal sector which isnt doing great. Last 3-4 days the price action seem to be not that great which may indicate that there’s fear. Thanks
Q4FY25 Results breakdown
Standalone Q4 Results
| Metric | Q4 FY25 | Q4 FY24 | % Change |
|---|---|---|---|
| Sales | 1013.09 | 670.01 | +51.2% |
| EBITDA (Adj.) | 262.33 | 150.95 | +73.8% |
| EBITDA Margin (%) | 25.9 | 22.5 | +3.4 pp |
| Net Profit | 115.25 | 101.07 | +14.0% |
Consolidated Q4 Results
| Metric | Q4 FY25 | Q4 FY24 | % Change |
|---|---|---|---|
| Sales | 1238.83 | 889.25 | +39.3% |
| EBITDA (Adj.) | 270.24 | 179.20 | +50.8% |
| EBITDA Margin (%) | 21.8 | 20.2 | +1.6 pp |
| Net Profit | 100.38 | 87.98 | +14.1% |
Segment-wise Standalone Q4 Results
| Segment | Revenue Q4 FY25 | Revenue Q4 FY24 | % Change | EBIT Q4 FY25 | EBIT Q4 FY24 | % Change |
|---|---|---|---|---|---|---|
| Steel | 432.77 | 531.10 | -18.5% | 47.53 | 111.73 | -57.5% |
| Ferro Alloys | 147.29 | 153.25 | -3.9% | 17.37 | 25.39 | -31.6% |
| Power | 562.54 | 69.10 | +714.1% | 170.75 | 1.76 | +9599% |
Segment-wise Consolidated Q4 Results
| Segment | Revenue Q4 FY25 | Revenue Q4 FY24 | % Change | EBIT Q4 FY25 | EBIT Q4 FY24 | % Change |
|---|---|---|---|---|---|---|
| Steel | 432.78 | 504.35 | -14.2% | 47.53 | 111.73 | -57.5% |
| Ferro Alloys | 355.91 | 367.17 | -3.1% | 33.84 | 36.74 | -7.9% |
| Power | 642.33 | 161.96 | +296.3% | 144.91 | -11.86 | +1321% |
Net profit is lower despite strong sales and adjusted EBITDA growth primarily due to a sharp rise in interest costs, deferred tax, and depreciation expenses following the acquisition of SKS Power. The company took on significant debt to fund the acquisition, leading to a substantial increase in finance costs, which jumped from 27.57 in Q4 FY24 to 70.03 in Q4 FY25. Additionally, the integration of SKS Power’s assets and higher capital expenditure resulted in depreciation nearly doubling, from 46.27 to 86.62. On top of this, the company recorded a one-time spike in deferred tax expense (66.22 in Q4 FY25 vs a reversal in Q4 FY24) due to fair value adjustments of SKS Power’s assets as part of the acquisition accounting. These three non-operational but unavoidable items significantly reduced profit before tax and after-tax earnings, ultimately muting the growth in net profit despite strong underlying operating performance.
Update:
I had included other income in EBITDA. Updated the answer to remove other income from calculations.
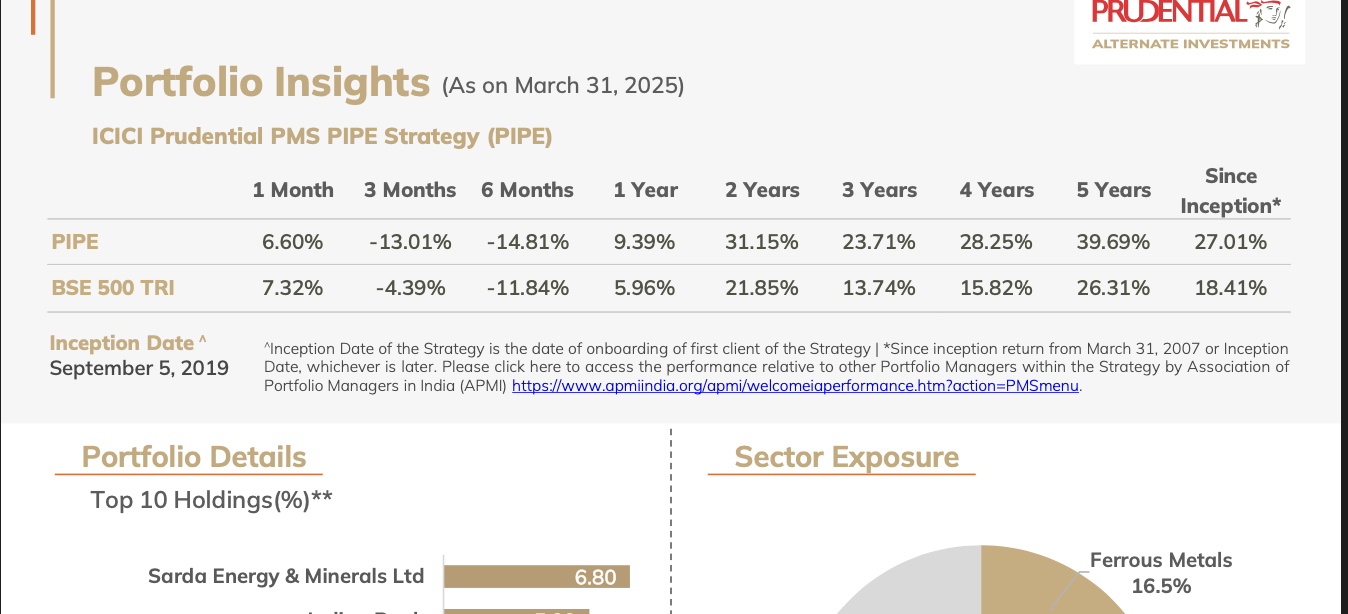
Sarda and Energy and minerals ltd -
Q4 and FY 25 results and concall highlights -
Q4 outcomes -
Revenues - 1239 cr, up 39 pc
EBITDA - 317 cr, up 62 pc ( margins @ 24.7 pc )
PAT - 100 cr, up 14 pc
FY 25 outcomes -
Revenues - 4643 cr, up 20 pc
EBITDA - 1410 cr, up 44 pc ( margins @ 29.3 pc )
PAT - 702 cr, up 34 pc
FY 25 - Achieved production -
Coal production @ 16.8 lakh MT ( highest ever )
Iron Ore pellets @ 8.18 vs 8.1 lakh MT ( highest ever )
Sponge iron @ 3.19 vs 3.16 lakh MT
Steel Billets @ 2.05 vs 2.29 lakh MT
HB Wires @ 0.35 vs 0.38 lakh MT
Ferro alloys @ 1.83 vs 2 lakh MT
Captive thermal power generation @ 1244 vs 1262 million KWHs
Hydro power generation @ 508 vs 482 million KWHs
Thermal power generated from SKS energy’s plant @ 2238 million KWH
Update on SKS energy’s acquisition -
In mid CY 25, Sarda Energy acquired SKS Power for 1950 cr through the NCLT process. SKS operates 2X 300 MW thermal power plants. Since Sarda energy has access to captive coal mines, it should be able to turn around SKS Power’s operations in a much better way
Sarda Energy’s FY 25 results do not include first Qtr’s revenues from SKS ( Q1 is the best Qtr for power sales )
Also, the power load factor ( PLF ) of SKS’s operations in FY 25 was low due to - maintenance shut down of one of the 300 MW unit for 40 days ( in Q3 ) + shut down of the other 300 MW unit for 28 days due to a fire accident ( in Q4 )
Hydro Power -
Recorded stable revenues of 330 cr from their 142 MW hydro power unit with 72 pc EBITDA margins
Operationalised 25 MW Rehar Hydro power plant in Q4 FY 25. should start contributing wef Q1 this FY
SKS Power’s acquisition will ensure that energy distribution becomes a major EBITDA driver from FY 26 onwards
Company’s current capacities -
Minerals -
Iron Ore mines ( @ Rajnandgaon ) producing 1.5 MMT / yr
Coal mines ( @ Gare Palma ) producing 1.68 MMT / yr
Energy -
Thermal -
81.5 MW @ Siltara - Chattisgarh
2 X 300 MW @ Raigarh - Chattisgarh ( acquired from SKS Power )
80 MW @ Vishakhapatnam
Hydro -
49 MW ( including the new 25 MW Rehar project ) in Chattishgarh
4.8 MW in Uttarakhand
113 MW in Sikkim
Solar -
50 MW @ Chattishgarh to be commissioned in FY 26 - for captive consumption
Waste Heat -
Waste heat power generation capacity @ 21.5 MW
Metals -
Pellets - 9 lakh MT
Sponge Iron - 3.6 lakh MT
Billets - 3 lakh MT
Wire Rods - 2.5 lakh MT
HB Wires - 45k MT
Ferro alloys - 45 MVA @ Chattishgarh + 102 MVA @ Vishakhapatnam ( capacities of electric furnaces to make Ferro alloys is measured in MVA )
Gross Debt @ 2823 cr, Net Debt @ 1566 cr
Expansion plans -
Gare Balma IV/7 coal mine - expects to get the final approval for increase in coal mining capacity from 1.68 MMT / yr to 1.8 MMT / yr in Q1 FY 26
Gare Balma IV/5 coal mine - is a high grade coal mine in Chattishgarh with extractable reserves of 39 MMT - company has been granted a time of 57 months to commence production
Shahpur West coal mine - High-grade Coal Mine in Madhya Pradesh, with extractable reserves of 10.38 MT. Mine Opening permission received in Mar-25. Mine development work has started. Expect to commence production before end of FY 27
Bartunga (Joint Venture) coal mine - High-grade Coal Mine in Chhattisgarh with production capacity of 2.1 MMT / yr ; 18% revenue share with SECL; Approvals under process
Kotaiveera Hydro Power project with capacity of 24.9 MW - Based on IB river ( a tributary of Mahanadi ) - project is in approval stage, project work is expected to commence in mid FY 26
50 MW solar plant in Chattishgarh - work is under progress. Project is likely to be commissioned in FY 26
Management commentary -
Company’s Thermal + Hydro energy plants contributed to 47 pc of company’s EBITDA in FY 25. With better results from SKS Power’s 2X300 MW plants in FY 26, company expects the energy segment’s EBITDA contribution to grow further
India’s steel production increased by 5 pc in FY 25 to 152 MMT vs a 3 pc decline in global steel production @ 1840 MMT ( led by 1 pc decline in Chinese production ). Domestic steel demand increased by 12 pc in FY 25. Steel prices in India declined due to increased imports and reduced exports. Net imports @ 4.2 MMT in FY 25 vs 1.1 MMT in FY 24
Domestic steel production in Q4 was 40.1 MMT, up 7 pc YoY. Steel consumption in Q4 was @ 40.3 MMT, up 3 pc QoQ
Chinese export of steel in Q4 @ 27.4 MMT, up 6 pc due weakening local steel demand in China. Many countries have started imposing anti - dumping duties against cheap Chinese imports
Domestic Coal production @ 1047 MMT in FY 25, up 5 pc YoY. Coal imports into India fell by 9 pc in FY 25. Indian coal Index declined by 15 pc in FY 25 vs 24
Ferro alloys exports from India dropped to 1.06 lakh MT from 1.15 lakh MT due lower production
Exchange power prices dropped 17 pc in FY 25 vs FY 24 from Rs 4.31 vs Rs 5.17 / unit
India has recently imposed a 12 pc anti-dumping duty on Chinese Steel imports - safeguarding the domestic Industry
Unsuccessful bidders for SKS power plant have appealed against NCLAT order. The matter is sub-judice @ Supreme Court
Likely to see significant improvement in PLF of SKS Power’s generation capacity in FY 26 vs 25
Having captive coal feeding into their commercial power plants is a big competitive advantage and insulates their profitability to a large extent
Company steel production is down 13 pc in Q4 due planned shutdowns + when power rates r good, company diverts its coal for Power production instead of steel production
Going forward ( in medium to long term ), the contribution from energy vertical is going to become more and more prominent. Second area where the company is going to focus more is towards mining ( ie minerals division ). They believe that their steel production capacities are working at optimum levels and have no immediate expansion plans for their finished metal division
Segmental breakup of company’s FY 25 EBITDA -
Energy - 47 vs 20 pc
Ferro Alloys - 19 vs 21 pc
Steel - 34 vs 59 pc
Company is consuming 10k MT of coal / day to run the SKS power’s plants at full capacity ( so that works out to be an annual coal requirement @ 36 lakh MT for SKS’s plants )
Ballpark estimate - SKS’s power plants should produce about 400 cr units of sellable units. One may assume an avg selling rate of Rs 5 / unit for full FY ( factoring in summer peaks + rainy season troughs in the selling rates of electricity )
Disc: initiated a tracking position, not SEBI registered, not a buy/sell recommendation, posted for educational purposes
Hi @ranvir - thanks for uploading this. Do you have any ball park estimates of next qrtr or next yr nos, mainly sales and EBITDA?
Since a part of the business is dependent on Ferro alloys + Steel prices, it’s very difficult ( at least for me to hazard a guess for FY 26 )
However, Q1 should be good since these commodity prices have been largely stable in Apr + May. In addition, they should get full benefits of the 2 X 300 MW power plants acquired LY
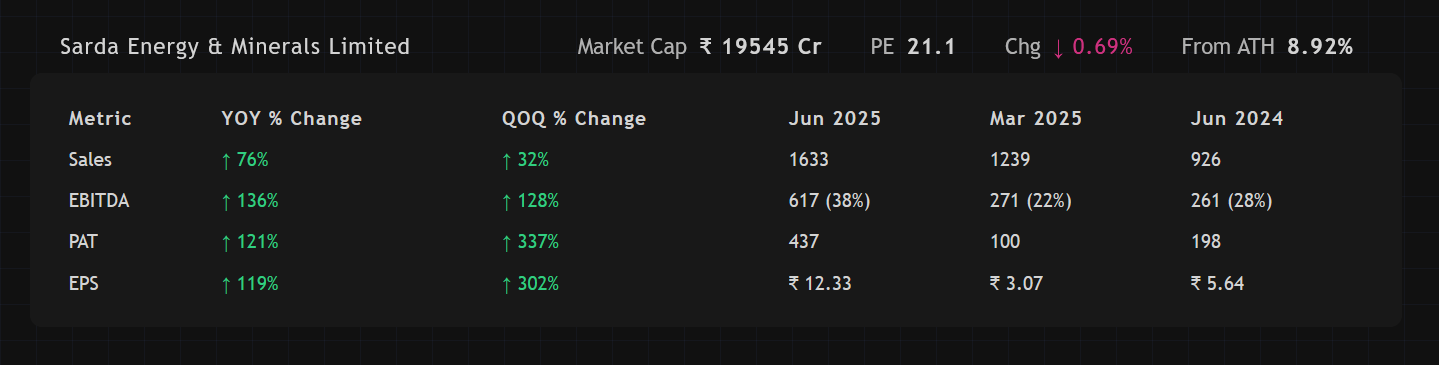
@ranvir what a stunning set of results..! the power sector is now contributing to almost 75% of EBITDA.. huge uptick from SKS power.. do you think the numbers are sustainable? do you know if the SKS power plants they bought have any PPA or is it merchant risk? many thanks for your attention..!
I could not find any mention of PPA anywhere. May be we will get more information from upcoming concall and PPT. Overall 350-400 cr PAT should come from SKS.
“IPP Binjkot (SKS Power), achieved a high average PLF of 90% and an average realization of Rs 6.16/unit in Q1FY26 (vs PLF of 70.5% & price of Rs 4.9/unit in FY25), reflecting strong operational performance.”
I took it from PPT.
Fluctuating realization means it is not under PPA, there is merchant risk involved.
Another Point is that SKS power plant already has the infrastructure to double the capacity so long term growth will be there.
Right now PE is 20. As the company is becoming energy business and moving away from commodity business, so its PE will most likely get rerated. Major component of price move will come from PE rerating in next couple of years.
Thanks Sachin.. for a standard IPP, 20x is a pretty decent multiple right? Higher is a bit punchy I feel..
Yup. PE has room to expand.
Q1 FY26
Performance
Concall Notes
- Hydropower generation grew by 37% YoY, supported by an early monsoon.
- The IPP thermal power plant achieved a significantly improved PLF (Plant Load Factor: A measure of how much electricity a plant actually generates over a period versus how much it could generate if it ran at full capacity all the time) of 90.21%.
- The pellet plant and captive power plant also reported record production.
- The 25 MW Rehar Hydropower project began commercial operations on July 8, 2025.
- The Chinese government announced a new stimulus of CNY69 billion to tackle consumption bottlenecks.
- Global steel production declined over 4% YoY in Q1, with China down 6%.
- India recorded a 10.3% growth in crude steel production.
- Imports moderated post-imposition of safeguard duty and quality control orders but still exceeded exports.
- The Indian Coal Index declined by 13% YoY from 142 to 128.
- Power demand and solar power prices remain subdued during the monsoon season.
- The company is spending about ₹500 crores to ₹1,000 crores a year on expansion projects in coal mines, hydropower.
- An enabling resolution to raise up to ₹1,000 crores of debt has been passed, but there are no immediate plans to raise funds.
- Net consolidated debt fell to ~₹1,000 crores from ~₹1,600 crores.
- Liquidity remains robust with ~₹1,700 crores in cash and liquid investments.
- The Net Debt / EBITDA ratio is well below 1.
-
Infrastructure is there for 1,200 megawatt. We definitely will be going for environment
clearances for another 800 megawatt in future. That much land and everything in the
infrastructure is there. - The Kotaiveera Hydropower project (25 MW) is in the approval stage, with work expected to begin next quarter.
- Two additional small hydropower projects are in various stages of approval.
- The company has an operating coal mine in Indonesia, with plans to expand production to 1 million tons in the near future.
- Expansion is focused on energy and minerals only, with no new expansions on the steel front.
- Strategically terminated the long-term power purchase agreement (PPA) with CSPDCL for the 113 MW hydropower project.
-
We had entered into power purchase agreement with cost plus tariff. So our tariff was going down year-on-year as the interest burden was going down. As our cost was going down, our tariff was also going down. And the transmission cost was in our account, on our head. So revenue was going down year-on-year. That’s why we decided to terminate this agreement. And we are selling power in the open market. We are able to sell 100% of the power. And annual average of the realization for the time being may remain at the levels what we were getting previously. But yes, in longer term, we will be getting the benefit of the increasing rates of power over a longer period of time.
- The company sells power from its thermal plant (SKS) through a mixed basket of short-term and medium-term bilateral contracts, with some volume sold on the IEX.
- The company is avoiding imported coal as much as possible, aiming to maximize the use of coal from its own mines.
- Steel realizations are expected to improve post-monsoon as construction activity picks up.
- Doubling SKS capacity is a long-term process requiring new environmental clearances. The Gare Palma mine will be expanded to 3 million tons plus, which will also require fresh environmental clearances after the current 1.8 MT expansion is achieved.
Risks & Concerns (Personal View)
- The Supreme Court case regarding the SKS acquisition is still pending, with a hearing listed for August 6, 2025. [Couldn’t find any update on the case]
- Long product steel prices are typically subdued during the monsoon season due to a slowdown in construction activities.
- Chinese exports surged despite a decline in their production, putting pressure on global pricing.
Fun Fact: FII & DII Accumulating while Public is selling.
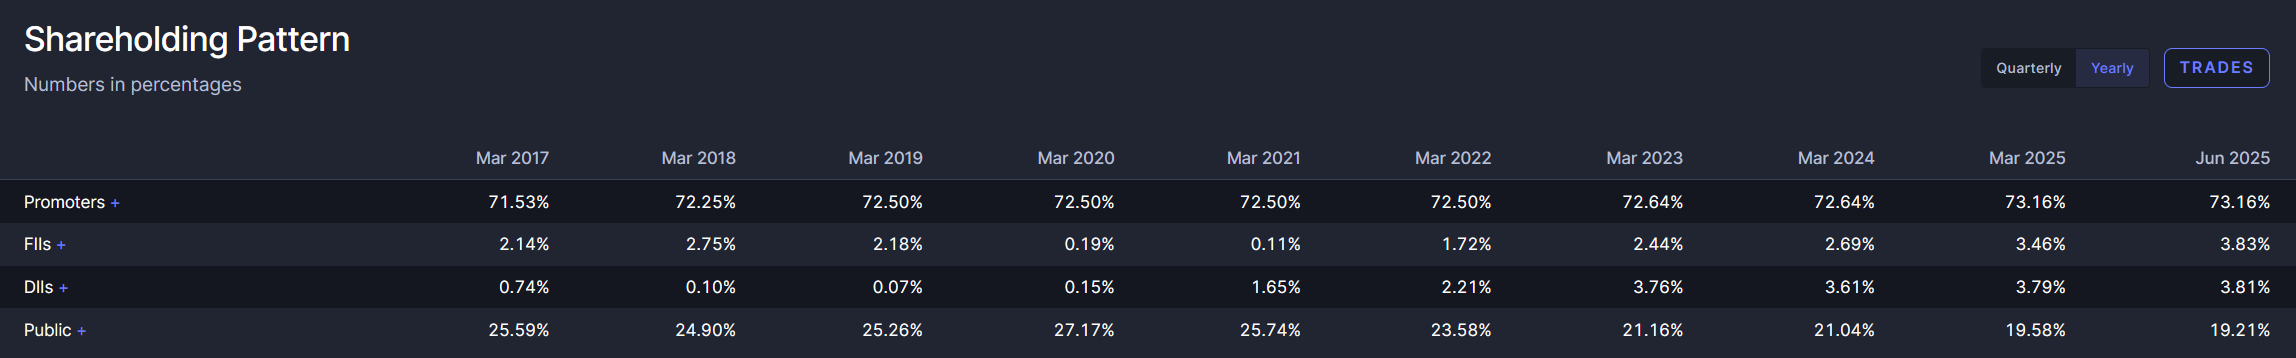
Disclaimer: Invested & Biased
When the court hearing of SKS acquisition has been scheduled or the order has been finalized ?