
Company Overview – Business Model & Operations
ROX Hi-Tech Ltd is an Indian IT services and consulting company established in 2002. It operates as a systems integrator and IT solutions provider, offering a broad portfolio of technology services. Key aspects of the business model include:
-
IT Infrastructure & Integration: The company provides end-to-end IT infrastructure solutions – from computer hardware components and networking equipment to software (packaged and custom) and cloud services. It sources and resells hardware (servers, peripherals, etc.) and implements enterprise software solutions (e.g. CRM, supply chain management, ERP) for clients. Through partnerships with major OEMs like IBM, Cisco, SAP, and Lenovo, ROX delivers integrated solutions tailored to client needs
-
IT Services & Consulting: Beyond hardware, ROX offers consulting and digital transformation services. Its services span intelligent automation (AI-driven process automation), enterprise application implementation, network and collaboration solutions, and cybersecurity. For example, ROX helps clients adopt cloud platforms and secure their IT environments. It also provides IT training and manpower outsourcing – running training centers and recruiting/deploying IT talent for projects in India and abroad
-
Industry Focus: ROX serves a diversified client base across sectors such as Manufacturing, BFSI (banking/finance), Government/PSU, Retail, Education, and Healthcare. The company emphasizes that its top 10 clients contribute ~45% of revenue, indicating a mix of multiple customers rather than dependence on a single client. Notably, ROX caters to some Fortune 1000 companies with its IT solutions
-
Geographical Reach: While headquartered in Chennai (India) with ~51–200 employees, ROX claims a “global footprint” with projects in North America, Denmark, and Singapore. However, the company has no foreign subsidiaries as of FY2024 – its international presence likely comes from executing overseas client contracts or partnerships rather than owned offices. The core operations (sales, delivery, support) are based in India, leveraging lower-cost skilled talent to serve both domestic and international clients.
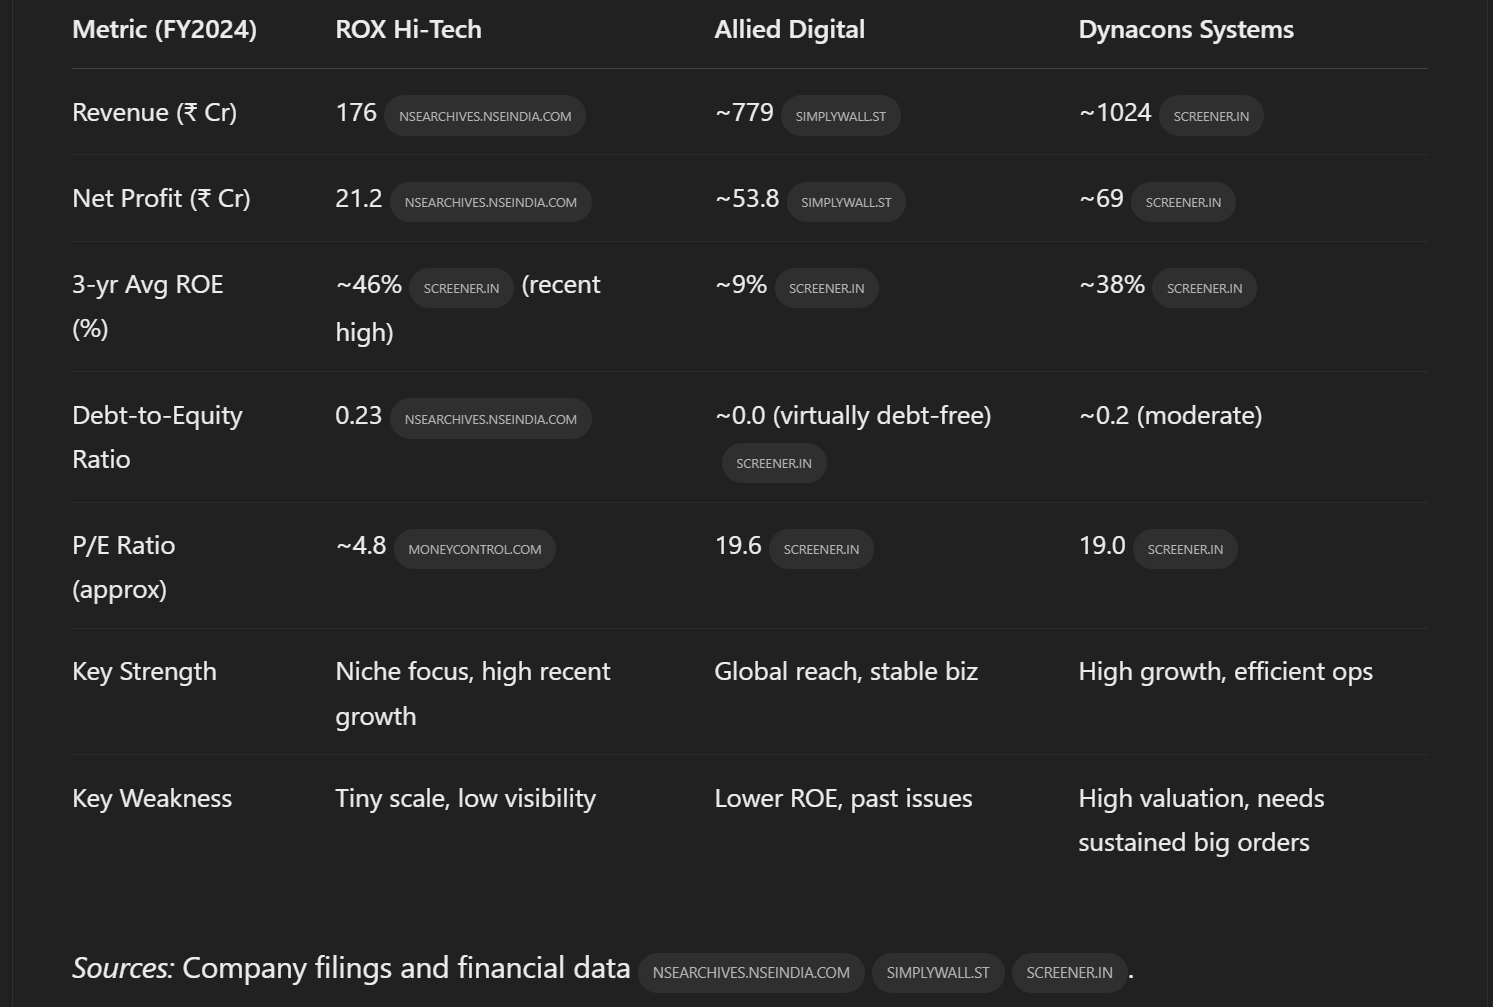
Comparative Snapshot: (ROX vs Selected Competitors)
Financial Performance & Statements Analysis
A review of ROX Hi-Tech’s financial statements (over the past several years) reveals a company that has scaled up revenues significantly since 2020 and improved profitability, but also one that is straining its working capital as it grows. Key observations:
-
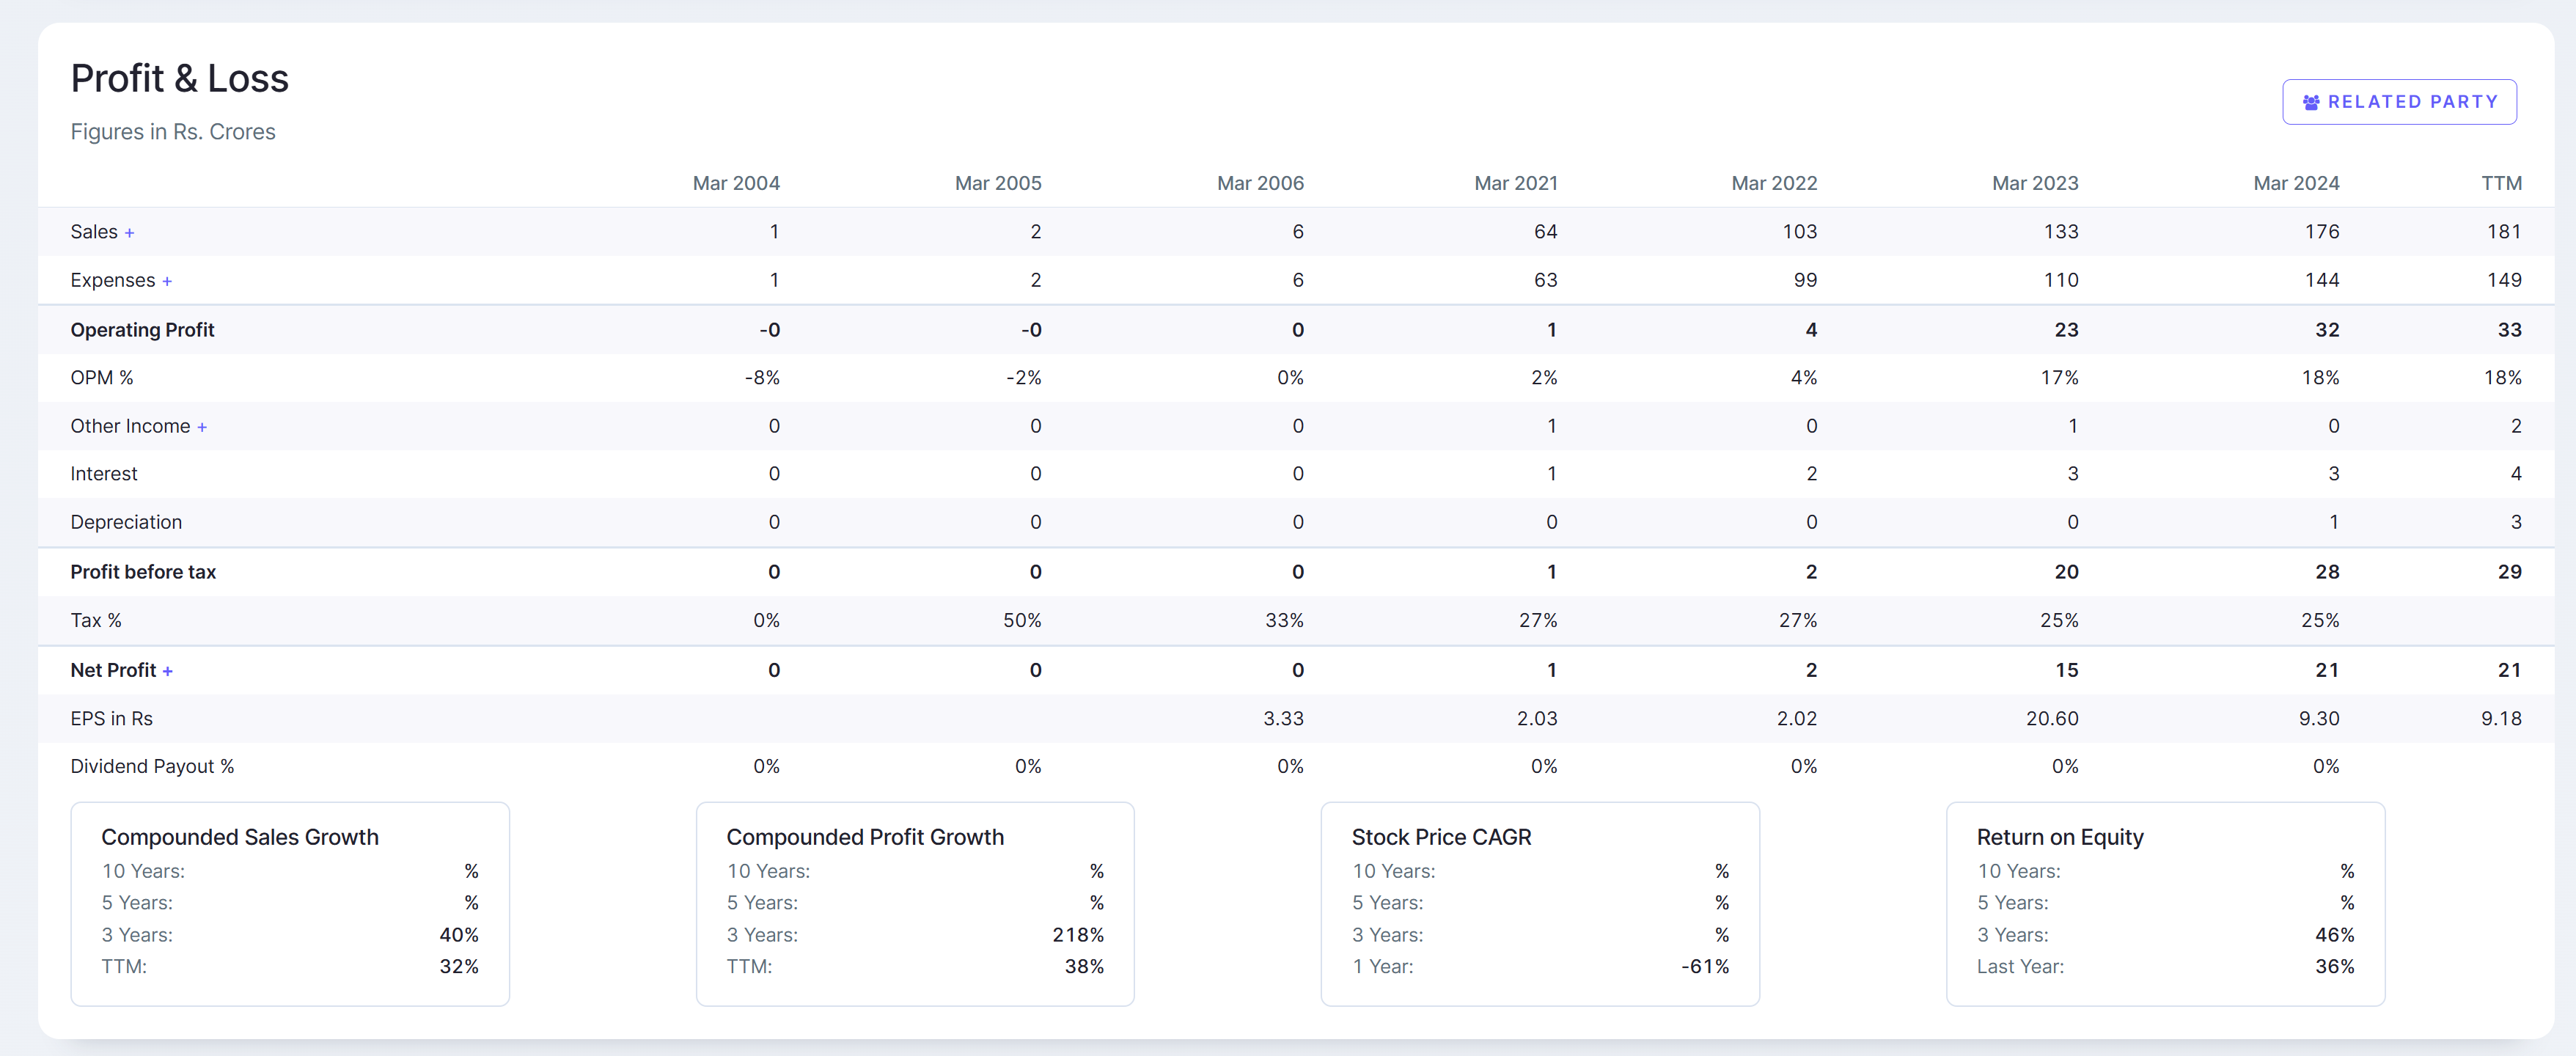
Revenue Growth: ROX has exhibited strong growth in recent years. Annual operating revenue rose from ₹64 Cr in FY2021 to ₹176 Cr in FY2024 – a nearly 3× increase in three years. FY2024 revenue grew ~31.7% YoY (₹176.06 Cr vs ₹133.33 Cr in FY2023). This growth has been driven by new project wins and perhaps expansion into new clients. Even on a half-yearly basis, H2 FY2024 was 28% higher than H1, showing momentum building through the year. However, more recent data shows growth tapering: in H1 FY2025, revenue was ~₹83 Cr vs ₹77 Cr in H1 FY2024 (only +8% YoY) – indicating some slowdown or seasonality post-IPO.
-
Profitability and Margins: The company’s profit margins have improved dramatically as it scaled. In FY2021, ROX barely broke even (2% operating margin). By FY2023, EBITDA margin reached ~17%, and in FY2024 it improved further to ~18% (EBITDA ₹32.23 Cr on ₹176.5 Cr revenue). Net profit has grown from just ₹1–2 Cr in FY2021–22 to ₹15.4 Cr in FY2023 and ₹21.2 Cr in FY2024. The FY2024 net profit margin was ~12%. Operational efficiency gains are evident: ROX’s cost structure shifted from mostly pass-through hardware costs to higher value-added services. Gross margins expanded as more revenue came from solutions/services. The company’s ROE for FY2024 was ~36–46% (depending on equity base timing), which is very high – though note this is partly because of low base equity pre-IPO; with the new equity, ROE may normalize lower going forward.
-
Balance Sheet Strength and Asset Utilization: Post-IPO, the balance sheet is stronger in equity (as discussed, ₹93 Cr net worth in Mar 2024). Total assets stood at ₹151 Cr in FY2024, up from ₹61 Cr in FY2023. The asset base primarily consists of current assets (receivables, inventory, etc.) – fixed assets are modest (₹12 Cr in FY2024) since this is a services business with limited physical assets. Asset turnover (Revenue/Total assets) was about 1.2× in FY2024, which is decent. However, the rapid build-up of current assets indicates capital is getting tied up in the business:
Working Capital & Receivables: A major concern is deterioration in working capital efficiency. ROX’s debtor (receivables) days spiked to ~112 days in FY2024 from ~74 days prior. Likewise, working capital cycle stretched from 118 days to 198 days. This means on average it now takes over 6 months for ROX to convert resource outflows into cash inflows, which is very high for an IT services firm. The likely culprits are slow collections (maybe some large clients or government projects paying slowly) and possibly higher inventory (if hardware orders were executed). Indeed, the company itself notes the increase was “due to increase in credit sales”. The trade receivables turnover ratio fell significantly, reflecting that build-up. By Sep 2024, receivables remained high (likely prompting short-term borrowing increase to ₹51 Cr). This working capital stretch is a red flag – it can strain cash flows and necessitate more debt or equity funding. On a positive note, ROX’s current ratio improved after the IPO fund infusion, but that is only useful if those current assets turn into cash promptly.
Debt and Liquidity: We covered debt in Section 2 – essentially, debt is moderate and interest coverage is improving. ROX had cash flow from operations of ₹9 Cr (in TTM Mar 2024), which is lower than net profit due to working capital soak. Free cash flow has been negative at times (e.g., -₹34 Cr CFO in FY2023 as it ramped up trade receivables and inventory). This reinforces that profitability on paper isn’t fully translating to cash yet – a typical growing pains issue. The company will need to manage receivables better or structure deals (e.g., milestone payments) to avoid cash crunches.
Operational Efficiency: Aside from working capital, other efficiency ratios are reasonable. Inventory turnover is okay (inventory days ~30-40, though it increased slightly in FY2024 as inventory grew). Payables days also increased (which actually helps working capital to an extent, as ROX likely stretched payments to suppliers to compensate). Employee cost to sales is around 3% (₹5.8 Cr on ₹176 Cr) – relatively low, which reflects the hardware-heavy revenue mix; as services grow, this ratio might rise. Return on capital employed (ROCE) was ~39% in FY2024, indicating effective use of capital for now (though this could drop with a fuller equity base and if growth slows).
Long-term trends: Historically, ROX was a much smaller entity (just ₹6 Cr revenue back in 2006, per old records). It remained low scale until a sudden growth spurt post-2020. The IPO and recent performance suggest a turning point, with the company transitioning from a micro-enterprise to a small-mid enterprise. Investors should track if this growth is sustainable. The Q4 FY2024 was particularly strong (₹61 Cr revenue, 62% QoQ jump), but one quarter doesn’t make a trend. The subsequent quarter’s modest growth hints that the big surge might have included some one-off large orders.
In sum, ROX’s financial health is a mixed bag: On one hand, growth and margins are favorable, and leverage is low. The company demonstrated that it can win business and convert it into profits (EBITDA and PAT margins are now healthy). On the other hand, cash flow and working capital management are weaknesses – a significant portion of its capital is locked in unpaid bills to customers. For long-term stability, ROX must improve its cash conversion cycle (perhaps tighten credit terms or focus on clients with better payment track records). The balance sheet has been fortified by IPO cash, but that buffer shouldn’t be eroded by poor working capital discipline.
From a business health perspective, the P&L shows improving operational efficiency, but the balance sheet signals caution: the current growth has come at the cost of stretched receivables and a one-time reliance on equity funding. Monitoring future financial statements for improvement in debtor collections and sustained profitability growth will be key to evaluating ROX’s ongoing business health.
Bottom Line: ROX Hi-Tech does present an intriguing long-term opportunity, given its growth trajectory, industry tailwinds, and low valuation. If management can capitalize on the digital boom, improve cash generation, and uphold good governance, the company could potentially multiply in scale and the stock could re-rate closer to peers. Essentially, ROX is in an early growth stage of what could be a much larger enterprise 5–10 years down the line – it resembles where some now-successful mid-caps were a decade ago.
However, this optimism must be tempered with caution. The investment is high-risk high-reward. It is suited only for investors who understand small-cap IT businesses and are willing to monitor it closely over the long term. Potential investors should be aware of the red flags and ensure those are addressed over time. In summary, ROX can be viewed as a speculative long-term bet on a small IT firm scaling up. Its fundamentals have positive momentum, but it needs to prove that the recent performance is sustainable and that management will act in shareholders’ best interests.
Red Flags and Risk Factors
Investors should be aware of several red flags and risks associated with ROX Hi-Tech before considering any long-term investment. Some key concerns include:
Working Capital Strain: As noted, ROX’s receivables have surged. Debtor days at 112 is quite high. This could indicate either lenient credit to win customers or slow-paying clients (possibly government agencies or large corporates with long payment cycles). The risk is twofold: potential cash flow crunches and risk of bad debts if any clients fail to pay. The company has essentially become a financier to its customers to some extent. If this trend continues, ROX might need debt or equity infusions just to fund its sales growth, which is not sustainable. It needs to be monitored if H2 FY2025 shows improvement here or not.
Unusually High CSR Spending: In a surprising development, ROX spent ₹15.42 Cr on Corporate Social Responsibility (CSR) in FY2024. This amount is extremely high relative to its PAT (~₹21 Cr) – about 73% of net profit was spent on CSR activities (mostly in education and disability support causes per the annual report). By law, the required CSR spend for ROX would have been only a few lakhs (given its prior years’ profits). The fact that it spent ₹15+ Cr raises eyebrows. It could be altruistic generosity or could mask something else (e.g., related-party NGOs or one-off social projects possibly linked to promoters). While noble on the surface, from an investor perspective this is a red flag because it’s an exceptionally large outlay that directly reduced shareholder earnings. The company asserts it met its CSR obligation in full and had no shortfall– indeed it went far beyond the obligation. Investors should seek clarity on whether this was a one-time donation (perhaps setting up a foundation or school) or an ongoing policy. Repeating such large CSR spends would significantly eat into future profits.
Promoter Group Transactions & Conflict of Interest: ROX has a Promoter Group entity – “ROX Technology and Solution Pvt Ltd” – which is in a similar business (the name suggests overlap). The company explicitly recognizes risk of “conflicts of interest, especially with our Promoter Group entity” that could damage client relationships. This implies there may be related-party transactions or overlapping clients. Any dealings with the promoter’s private firm need to be at arm’s length and fair. The AGM notice hints at related party transactions being put for approval. Investors should scrutinize related-party disclosures in annual reports for things like purchases, sales, or loans involving the promoter’s firm. A conflict of interest could arise if, for example, the private entity competes for similar contracts or if ROX Hi-Tech funnels business to/from it. This is a governance risk – how it’s managed will indicate management integrity.