
Biggest problem I faced when I started taking investing seriously — RS wasn’t on screener.in
Not a small problem. A daily frustration. Every time I wanted to check Relative Strength, I had to leave, open another tool, and come back.
Tonight I fixed it for good.
I built a free Chrome Extension that adds a full RS-123 Analyser panel to every company page on Screener.in. I don’t need to go anywhere. I don’t need to pay anyone. I don’t need to switch tabs.
Here’s what it gives me, for up to 3 stocks at once —
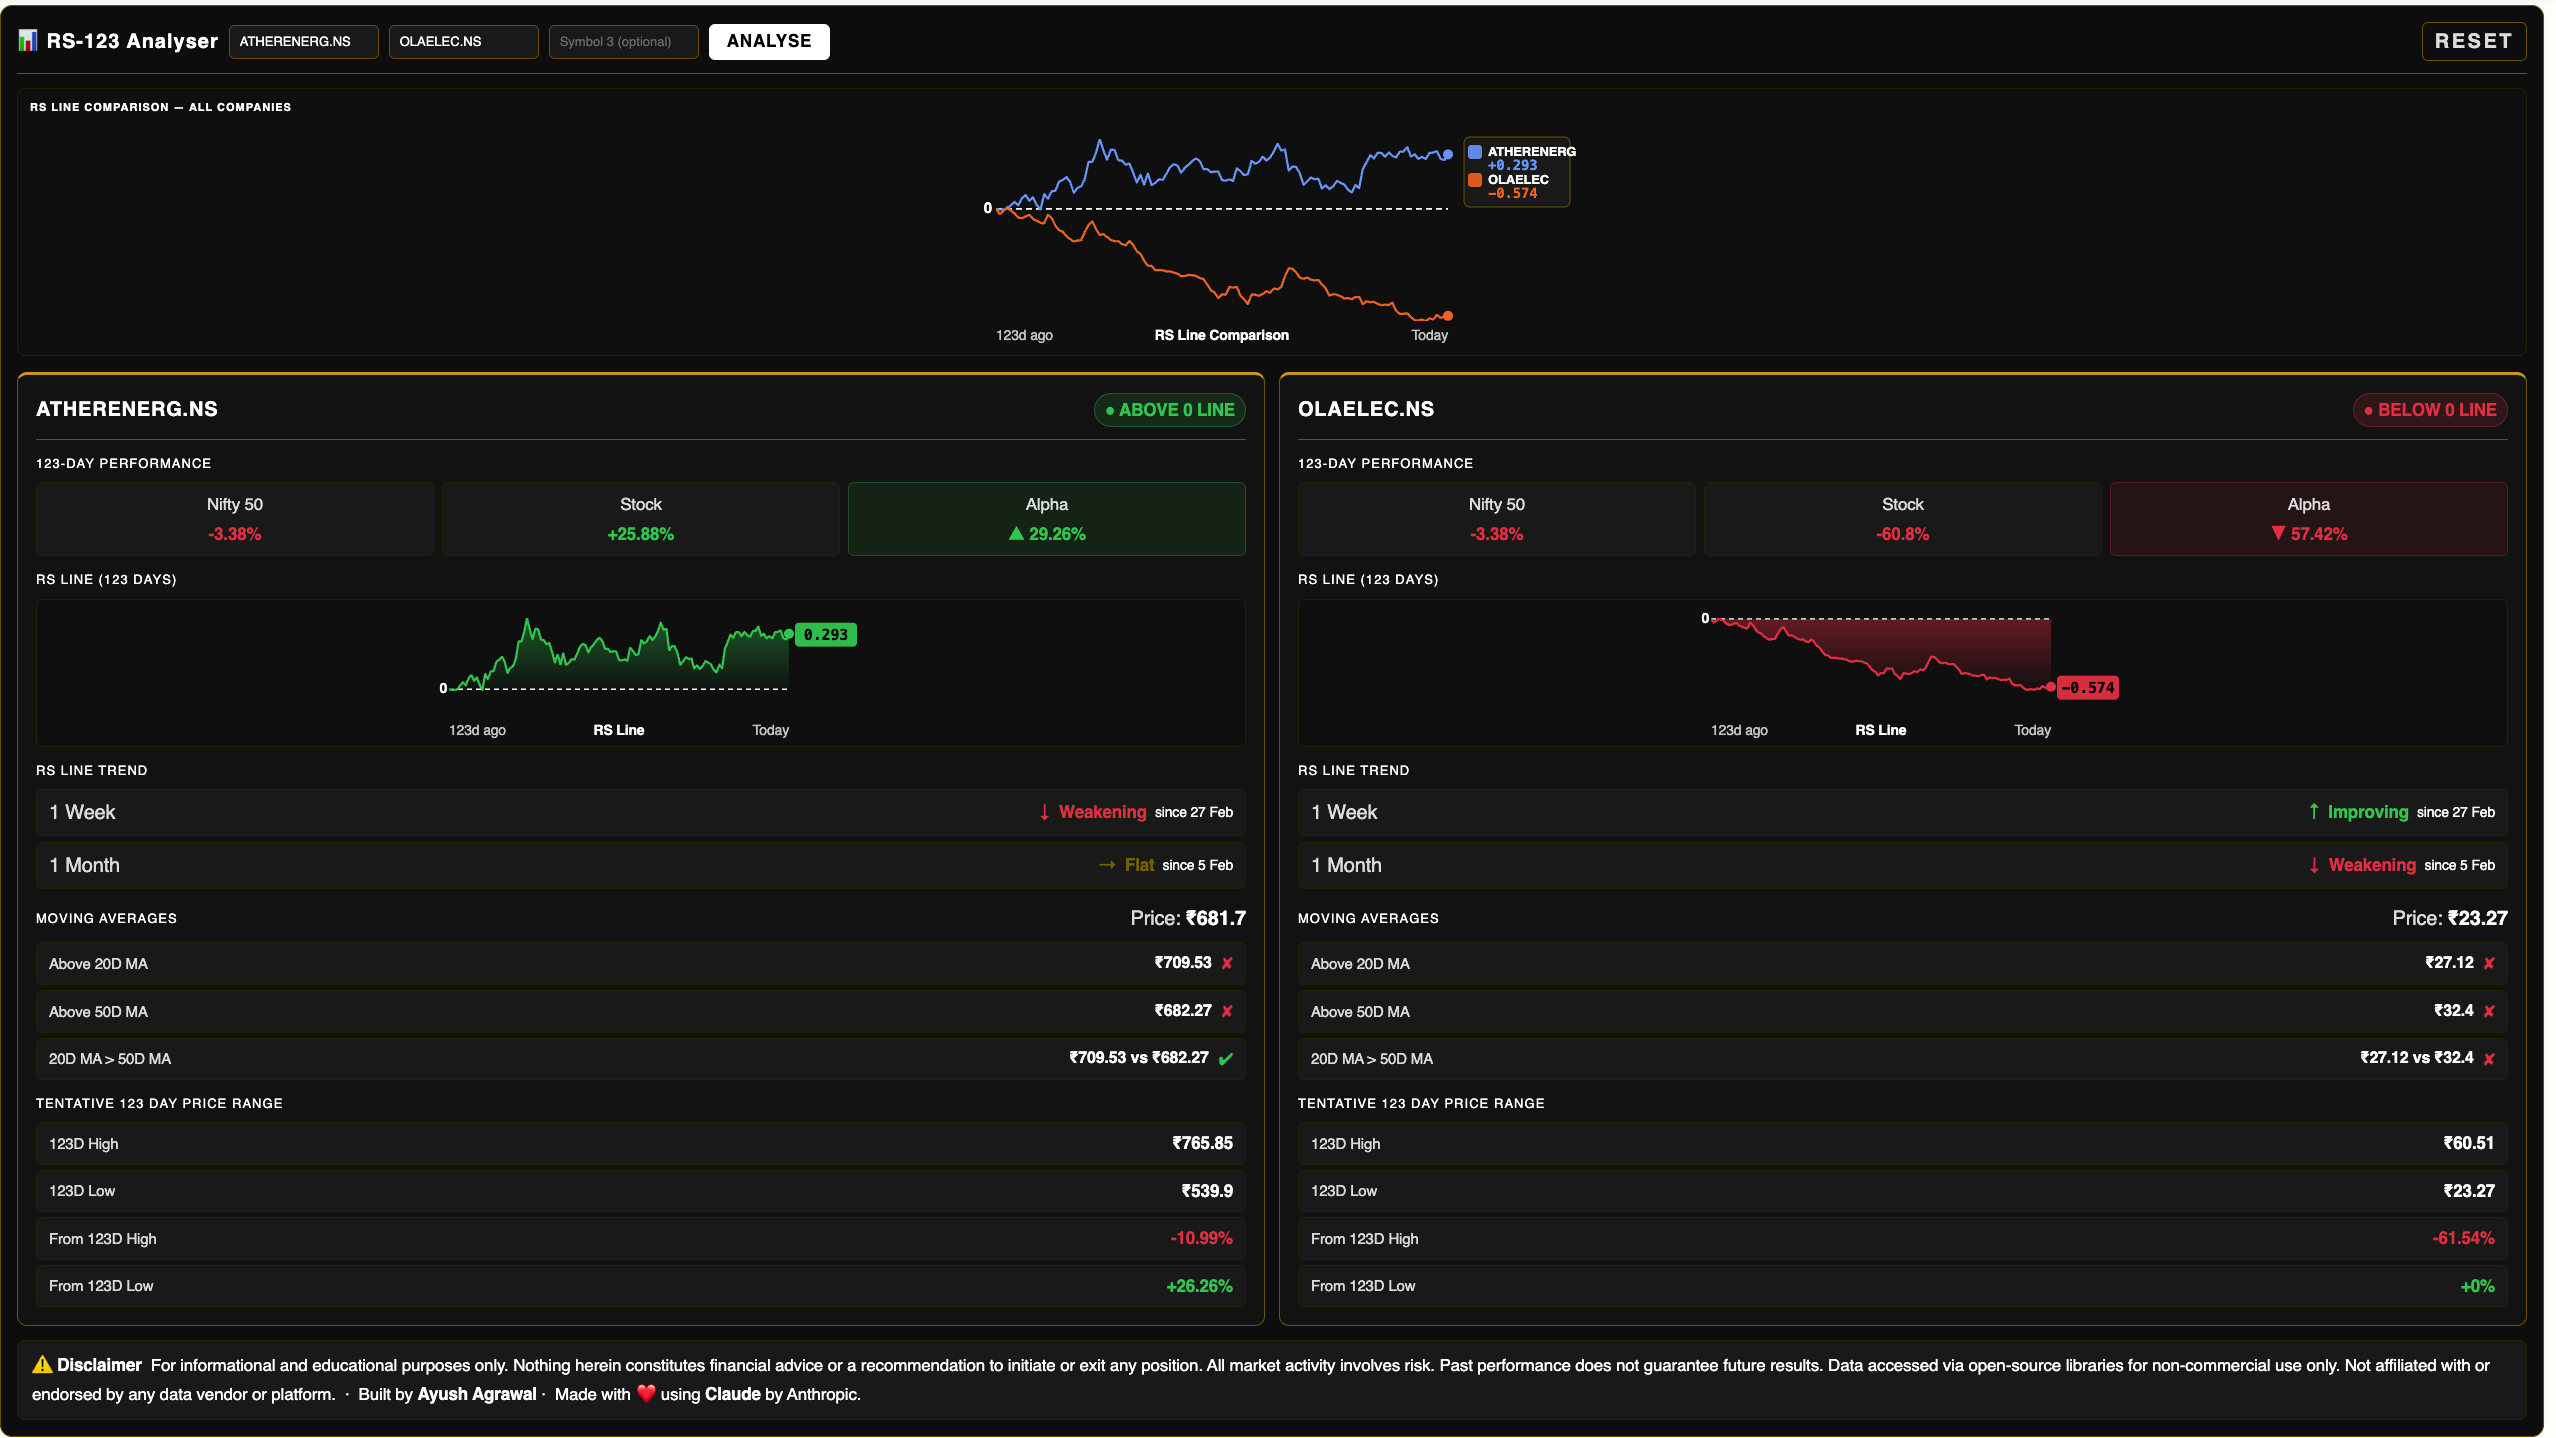
RS Line chart — 123 trading days Above or below the zero line RS trend — improving or weakening over 1W and 1M Alpha vs Nifty 50 20D and 50D Moving Averages 123D High, Low and distance from the high
Add 2 or 3 peers and it draws a combined RS chart — all lines on the same scale, colour coded. One look and I know who’s been leading the market and who’s been quietly losing ground for weeks.
This is the lens serious traders use. Now it lives inside the tool most of us already use every day.
Built entirely with claudeai by AnthropicAI — which honestly deserves its own tweet.
A short demo below. Also a note on why it’s not open source just yet.
Demo Picture:
Video Demo:

Will first try to see if I can get Pratyush Sir to implement this and then will open source the code.
Disclaimer: Demo for illustrative purposes only. Not a recommendation to buy or sell any security.