This article highlights how independent retailers and distributors find it hard to make money while selling Apple products due to its stringent pricing norms that benefits Apple itself ( own stores). The pricing rules of Apple ensures minimum profit to any seller outside of Apple often making it unviable if you don’t have scale. (Redington has scale of course).
But Apple being Apple, in order to extract as much profit from the value chain can make it more and more difficult for others to sell it’s product- this is an advantage and a disadvantage for this co
+ve : Competition reduces as players exit, leading to consolidation( Apple has however continued to have only 2-distributors for India- Ingram and Redington). Apple continues to remain Apple of customers’ eyes due to premium status and market expands (Apple mkt share in India- 4.4%, Middle East - 30%)
-ve : anti-trust fines on Apple and distributors, lower margins may erode gains of volume increase
Since Apple contributing 30% revenue of Mobility segment, what are your views on this significant risk?
The good news is that any customer Redington introduces to AWS, they are always in the picture, so the revenues will be sticky. I don’t have any information on what percentage or margins a distributor gets from distributing AWS products compared to physical products that the cloud services displace. Plus I suspect some of the larger accounts would go direct to AWS and not via Redington.
Apart from Sales Growth, what is the key metric to track here? A good answer on what to look by Raj Sharma (MD, Redington)
From what we have observed, your gross margin is around ~5-5.5%, EBITDA margin is typically around 2.0-2.3% and PAT margin is 1.0-1.3%. How should we understand a business with such low margins?
It is a very interesting question. Answer to this question lies in an understanding of how the distribution business works. The viability of distribution business rests on its ability to scale over a period of time. Scalability of business naturally brings in operating leverage and capital efficiency. Therefore, the margins in the business must be looked at in context to the scalability that a distributor achieves over a period of time. The gross margin available in the distribution food chain is typically at ~4-6%. This is fundamental to distribution business and you will observe this margin trend across all the distributors globally. We have been able to consistently deliver margins at the top end of the range by achieving superior operating leverage and better cost efficiencies.
Considering the fact that distribution is a Working Capital intensive business since we carry inventory procured from our vendors and extend channel financing to partners, one needs to assess the performance of the business by looking at the Return on Capital Employed. With scale and cost efficiencies in place, we deliver a high rotation of the Working Capital deployed in business and this ensures that our returns are commensurate with the efforts involved in doing business. For FY20, our Return on Capital Employed stood at 18.1% and over the years, our average Return on Capital Employed has largely been in the range of ~16-18%.
Mobility de-grew due to stress on supply chains & global chip shortages. Supply chain issues may ease out from October onwards.
Receivables & payables in B2B deals are high, which are keeping working capital to around 14 days; 25-30 will be normal WC days.
Apple GTM Impact -
Estimated loss of revenue: 3.2k to 3.5k(Almost 5% of FY21 revenue),(India still grew at 19%).
Currently, Apple GTM is for Smartphones only.
Mitigation for Apple GTM - Increase in Geographical, brand & product diversification. Currently operating in 37-38 countries. Of the total 240 brands, the top 5 contribute about 2/3rd of the business. Cloud business to be the main contributor in 5 years. High margins in cloud.
Cloud -
Observing and focusing on changing patterns of customers. Any customer/partner can come & configure product solutions & services.
Partner with hyperscalers like Amazon, Google, Microsoft for the cloud business.
Stress on “Everything as a service and & Customer choice” as a business model.
Many products are going online.
Business model pivoting from products towards combination of products & services.
Making heavy investments on a cloud platform.
Management is delighted with the performance of the ‘services’ segment.
Edit 1 - Cloud business to be the significant contributor in 5 years.
The company’s operating margins have improved to 2.9% in fiscal 2022 (compared to 2.43% in fiscal 2021) driven by better gross margins and a better product mix.
The profitability is expected to range between ~2.5-2.8% levels over the medium term due to initiatives to increase the share of value-added services like cloud, networking, and logistics, and the share of mobility products (lower margins) may increase as the chip shortage eases.
Return on Capital employed (RoCE) has improved to 29.8% in fiscal 2022 (compared to 21.5% in fiscal 2021) driven by better profitability and is expected to sustain at over 20% over the medium term.
However, due to effective working capital management, the ratio of total outside liabilities to total net worth (TNW) ratio increased to 2.08 times in fiscal 2022, from 1.81 times in fiscal 2021. TOL/TNW ratio is expected at ~1.9-2.1 times over the medium term.
The company’s market position in both its business segments is underpinned by its ability to rapidly grow its vendor list, its diverse product profile, strong distribution infrastructure, and well-entrenched relationships with its channel partners.
In fiscal 2022 the share of mobility revenues has declined to 29% driven by degrowth in the global smartphone market due to chip supply constraints. The mobility revenues were also impacted by the change in go to market (GTM) strategy of one of the major vendors (Apple).
While the threat of DTR models remains, REDIL is better placed to mitigate the threat due to its diverse product portfolio and presence across diverse geographies. The DTR/e-commerce model is unlikely to reduce the offline market substantially as seen in developing countries.
REDIL ventured into cloud business two years ago and offtake in cloud business has been healthy with cloud business recording a growth of 41% YoY in FY 2022. While the share of cloud business remains low at ~2%, it is expected to grow at a much faster rate than overall business. REDIL follows healthy foreign exchange risk mitigation practices such as 100-per-cent hedging on exchange rates, which helps minimise foreign currency fluctuation risks.
The quick conversion cycle and its strong relationship with its vendors also ensure limited risk arising from product obsolescence. Most of the receivables (about 75% in domestic business and about 95% in the Middle East region) are credit insured to mitigate default risk.
10.The robust risk management practices have led to the average receivable provision to be ~0.12% of revenues while the average inventory provisioning has been ~0.08% of the revenues.
Most questions were already addresses in the last two earnings calls.
I was disappointed with the generic non satisfactory answers.
They plugged in their mission and vision statement in every answer.
The MD also talked about cloudquarks, cloud reselling business’s lead generation process as well as unique selling proposition of Redington’s cloud business.
There wasn’t anything new to take away from the AGM so, I didn’t bother making notes. I believe you can download the recorded video from the company’s website.
RIL’s 5-year rolling CROICI dropped from 28.8% between 2016-2021 to -2.41% between 2017-2022 due to the cyclical working capital movement. Standalone CROICI between 2011-2022 came to 19.5% which significantly outperforms the consolidated figure during the same period. This huge discrepancy is mainly driven by the loss-making and cash-intensive ProConnect business and the recent slowdown in the profitability of the international business. I believe this gap will shorten as the international scene improves in the coming quarters. The cash return on incremental acquisition for the period between 2011 and 2022 comes to 30.32% which is commendable.
A detailed write up on Redington’s FY22 Performance. Read it if you are interested.
OPM and NPM expanded to 3.0% and 2.1% respectively in FY2022 (from 2.5% and 1.4% in FY2021) due to improved product mix, and strong IT demand amidst tight supplies.
The company’s gearing and Total debt/Newt worth ratio remained strong at 0.1x and 2.0x respectively due to low working capital debt utilization. Adjusted for cash reserves, the net TOL/TNW was ~1.4x.
The well-established relationships with vendors aid REDIL towards favourable credit periods, which reduces its working capital intensity. Further, comprehensive contracts with vendors de-risk REDIL from any risks of product and technology-related obsolescence.
To integrate all logistics entities as One ProConnect, the Automated Distribution
Centres in Chennai and Kolkata will be transferred to ProConnect Supply Chain
Solutions Limited for 90 Crs. This business unit generated 4.25 Crs in income during FY22.
Even though on a standalone basis, the finance costs went up substantially, on a consolidated basis it has only increased slightly. Similar to the standalone entity, the group’s employee benefit expenses have gone up but other expenses have come down.
SISA segment is more efficient (better ROA, ROCE -50% and ROE - 24%) than ROW (ROCE - 36% and ROE -19%).
During the quarter, Redserv Global Solutions Limited (“RGS”) acquired Redserv Business Solutions Private Limited (“RBS”). Prior to this transaction, RBS was a wholly owned subsidiary of Redington Gulf FZE (“RGF”).
Due to high WC utilisation, FCF for Q1FY23 stood at -2316.7 Crs (-13.79 % FCF margin)
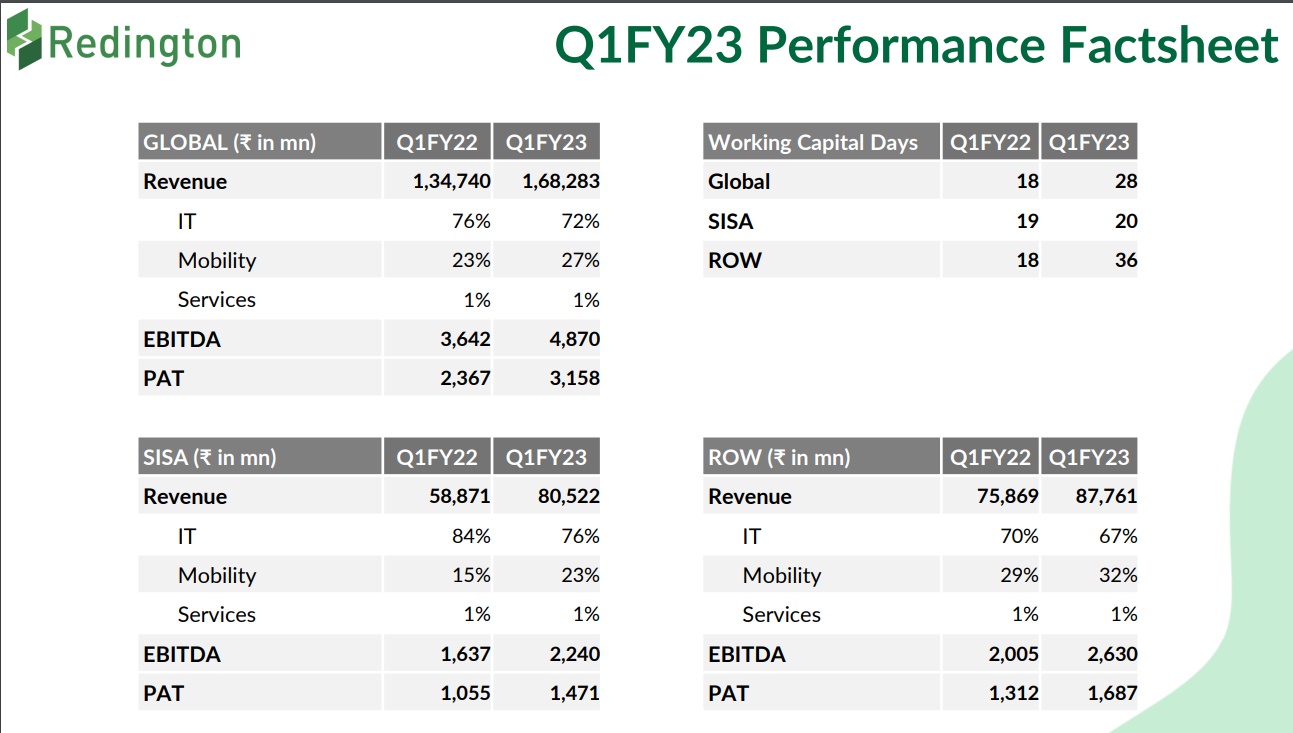
Mobility segment’s share in the revenue pie grew YoY.
WC days (YoY), SISA - from 19 to 20, ROW - from 18 to 36 and Global - from 18 to 28.
Apple’s share in revenues grew from 28% in Q1FY22 to 31% in Q2FY23
Easing of supply chain constraints. The last two years saw abnormally good WC days because demand was high and supply was constrained. So, the company was able to collect receivables comfortably. The WC is now normalising, 25-30 days is what one should expect. Few quarters will see great FCFs and some will see negative FCFs, it is the nature of the business (mainly because of reporting cut-off date).