
@borapratik03 Getting the issue sorted asap, thanks for that.
@anand76 We’re working on adding a feature similar to what you suggested. Stay tuned.
@mukesh_gt @sumit_tumba @akja @nikhiu7r Stock rating is based on the combination of both technical and fundamental rating. We’ve backtested the data and found that it is a useful indicator of stock trends. Stocks with higher rating offer a better probability of achieving gains with a lower downside risk. Stocks are rated on a scale from 1 to 99, with 99 being the best. However, we are still contemplating whether to place the rating on ratestar or not, would take a call after more reviews. Keep sending us your feedback.
1 Like
Free Cash Flow for last 10 years will be a good addon
Shareholder’s funds + Non current liabilities + Current liabilities = Total Liabilities
Non-Current Assets + Current Assets = Total Assets
Net Current Assets = Current Assets - Current Liabilities
I hope that was helpful.
I would recommend to keep the rating. There should be a question mark to show the reason of rational of rating. Historical rating with each closing month will be also good to keep there.
1 Like
read also on place of alsi
giving historical P/E for say last 3 years…will be interesting…
2 Likes
any insights into, how you are planning to monetize the site?
looks very good. thanks. looks to inspired by screener.in. i think the following two will be good to add
- ttm consolidated PE ratio in annual result column. this will be useful. today none of the financial sites provide this info. even if they give, it will not not accurate. (i think moneysights.com had this feature. but closed down)
- div payout ratio in annual result colum
is there any website where we can find average pe ratios of 5-10 years of stocks?
The look and feel, layout and user friendliness and data is superb!
Rating methodology can be detailed somewhere. Rating can create bias but if explained properly can be great tool as well. So keep it. However any filter is not available where by let’s say we select 4 star and above ratings mid cap pharma stocks ?
any thoughts on developing this in future
@kkarunakar Adding it in a bit.
@constantseeker_ We had a discussion internally about historical P/E ratios. Trying to figure out a way to fetch average P/E ratios throughout years, as P/E on a particular date every year won’t be that helpful.
@praveenV No plans to monetise this in the near future, adding more helpful features and getting regular visitors to the site is the current plan.
@amishra Adding a filter to sort through ratings is an interesting suggestion. Will discuss this internally. The thought process behind ratings should be live in a bit. Stay tuned.
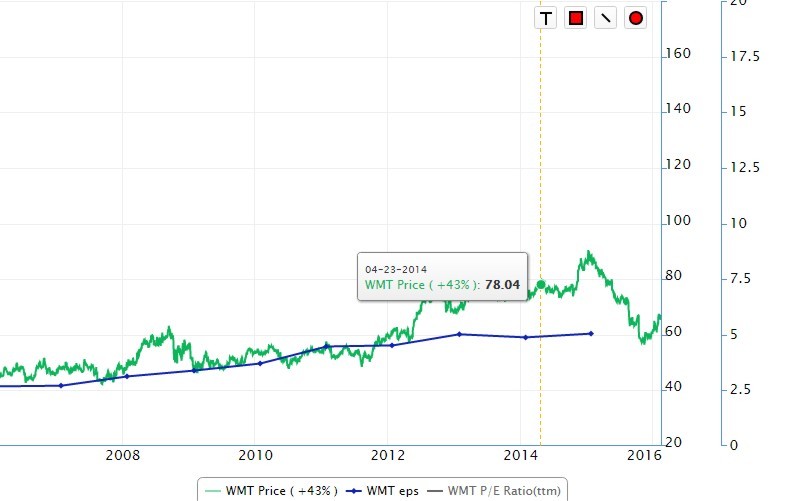
One more interesting feature, which I think could be very very useful, is the graph showing EPS & share price for the last 10 years. These type of graphs are seen in the Peter Lynch books. A P_E graph can too be added to give an investor a clear look of historic & average PE’s.
2 Likes
Hi ,
Putting below an example link . Not to discuss MIRC ELECTRONICS.
1.http://www.ratestar.in/company/Mirc-Electronics-Ltd-100279
2.https://www.stockaxis.com/analyzer/company/Mirc-Electronics-Ltd-100279
Both links show the same data, same layout. Only Logo is different .
2nd one is STOCKAXIS multibagger advisory website.
Is ratestar.in a free extension of STOCKAXIS ?
interesting. whois lookup points to the same person.
PE on a particular date would not help much and is a great feature to have.
I use a method to calculate historical PE ratios, maybe you can consider that-
For each historical quarter, I calculate avg. closing prices and then take 4 quarters TTM to calculated earnings. In this way for each quarter there is an avg. PE. Then I plot a line chart with quarterly avg PE ratios. This really helps to identify the times when the stock got re-rated, has been a good learning for me.
Yes, we belong to the same group but Ratestar is a separate division and we plan to keep it as an entirely different product.
@kkarunakar Have updated the info on ratings on desktop site.
Few more suggestions:
- Peer comparisons
- Add custom ratios
- Stock screener, would be interesting to see if there are different results than ‘screener’
- Historical shareholding patterns
- Also pl. give disclosures on each formula in the site itself
The PAT issue has been fixed. Please check…
1 Like
when i serach for “SE Investments”, it is going to “ROSE Investments”…please check this bug
The bug has been fixed. Please check. Thanks for that