Of course it is possible to have a stop loss. And nearly all “production” systems would have a “disaster management” stop loss.
The problem with stop losses is that in most of the cases (cannot generalize, but practically all cases), stop losses end up reducing CAGR returns.
Let me give an example to explain why this is so. Say, you have bought a stock at 100. And have a stop loss at 80. The stock starts falling and your stop loss gets triggered. You lock in the 20Rs loss. Now, it goes down to 70 and then rebounds. And at the end of the quarter (assume you are running a quarterly reset system), it is at 90. So, if you had held on till the end of the quarter, you would have made a loss of 10Rs but because you had a stop loss, you had a 20Rs loss.
In hindsight it is easy to say when one should have got in or got out. But when events are unfolding in real time in front of you, you do not know what to do. At 7500 Nifty, the consensus was that Nifty would go to 6000 (or lower). The reality turned out to be different.
I personally use a 2-factor stop loss in my Q30 system which I personally use for most of my quant investing. I have a stock based SL and also an aggregate portfolio level SL. In addition, I have a index overlay to check for SL. I know it will reduce some returns but the safety in knowing that I have avoided potential disaster is important for me. The other thing is in a quant system, since I am not always aware of the fundamentals of a stock, I cannot build conviction. And without conviction I cannot hold on to a stock if it is falling. So, a stop loss is very important for sleeping well at night.
Thanks Basu for the detailed share. I devised a strategy for my Portfolio and applied it from the past 3-4 months and it performed decent even in these times. I observed that mine is a kind of Quant system (i did not know this term untill i read your post )
setup a cron to download daily bhavcopy and store data in mysql. Use pandas + talib to generate signals. For e.g. I am starting to try out a basic screener like this (most online screeners signal stocks based on one indicator and very difficult to mix match from different screens)
Nifty 500 stock and macd > signal and rsi > 50 and +DI > -DI and ADX > 25 and nifty 50 macd > signal (for correlation)
next challenge for me is to find out automated support and resistance and plot the whole using matplotlib and save time on doing this exercise on zerodha.
Do we have a free datasource to pull historical scrip constituents of NSE500/BSE500 to apply few basic TA to them ? If not what alternate options are available to compute ourselves:
like (company & historical no. of equity shares) ? or
can we use current no. of equity shares and history price to compute then top 500 market cap companies ?
Is the data computed that way good enough to support & filter scrips from historical bhaav copy and apply TA filters ?
Basically, try to keep things simple. If you are unable to get NSE500, you can always select a threshold value of market cap or revenue and pick stocks above the threshold.
I understand this is just a sample screener. I found that most of the technical screeners use the daily value for RSI and ADX. (chartlink does have an option to prefix monthly etc) . If we are interested in a monthly/quarterly portfolio, shouldn’t be using the monthly RSI/ADX values in the query?. Or it should be the default daily value?
Since the tech screeners sites give pretty much all the indicators, may I know the reason for writing python code?. Is it for some custom algorithms or for back testing purpose?
For 1, you can use weekly / monthly / quarterly based on whatever you think is the most pertinent for your strategy. Before you use any statistical indicator, try to understand the logic of the indicator or how it is derived. Then tweak it as per your requirements.
I do things myself, because I need to be able to combine indicators and create my own custom indicators, which practically no own lets you do.
As Quant suggests about some portfolio level stop loss if we use portfolio level, does it also have concept of booking profit in phased manner kind off? if whole portfolio is up by 10 or 15 % then book certain percentage of profit? or it is always sell at the end of 1st or 3rd month if it does not hit stop loss?
Thanks for helping all of us to learn this,
Milind
Firstly, let me clarify one thing. Quant does not suggest anything. I am using a portfolio level stop loss because it suits my strategy. You could use something that suits you. Even not using a stop loss is a valid strategy at times.
Similarly, I do not have a profit booking strategy except at the end of the period (month/quarter). This has helped me in my strategy to ride very large percentage gainers like Adani Green for many months now. For example, Adani Green came into the Q30 strategy at Rs54 before the March crash. It again resurfaced in Q30 in May at Rs 211. And today it is Rs420. If I had a fixed profit booking strategy, i would have missed a majority of the rally.
@basumallick
I understand that quant doesn’t enforce any fixed strategy and its up to us. Also, I understand that in this particular strategy you want to hold the entire basket till the time frame. I was just thinking about a slightly modified version. Start with X stocks based on a few momentum indicators. If any stock moves out of the momentum indicator, replace it with a new stock that meets the criteria. Wouldn’t this be a better strategy?. This is not based on price based stop loss. But on the momentum indicators at a given point in time.
I don’t know if it will end up being a better system or not. It has to be tested. That is the beauty of quants. One can test and have a reasonable sense of the effectiveness of a strategy. Unlike a long term investor’s strategy where you come to know only after 3-5 years if he is good or bad, and then you can never be sure if it is repeatable or not.
I have tried literally hundreds of different momentum and trend following systematic strategies and I have found my quantamental Q30 system to be the best overall - in terms of returns, max drawdown, diversification, win-loss ratio. I have variations of this system which give far superior returns but with much larger maxDD. e.g. there is one system I tested which gives a backtested CAGR of 72%+ over the last 15 years. But it has a 70% maxDD. Now, I am sure I will not be able to sit through a portfolio drop of 70% without panicking. If I use a stop loss the returns reduce significantly to not give me any alpha over Q30.
I am not trying to chase max possible cagr returns but a reasonable mix of returns, consistency of returns and low drawdowns.
The other problem I personally have with the approach you have mentioned is I would have to be active everyday and track my screens. I don’t want to do that unless I can make substantially better returns. I am, in any case, more of a less activity person in my investing. Even my long term stocks I hold (probably) longer than merited at times. So, one of the ideas to get into systematic strategies is also that it has to mirror your likes and dislikes for it to work long term for you. That is why I did not even try to look for intraday or very short term trading systems. I started experimenting with quarterly, half-yearly and monthly ones.
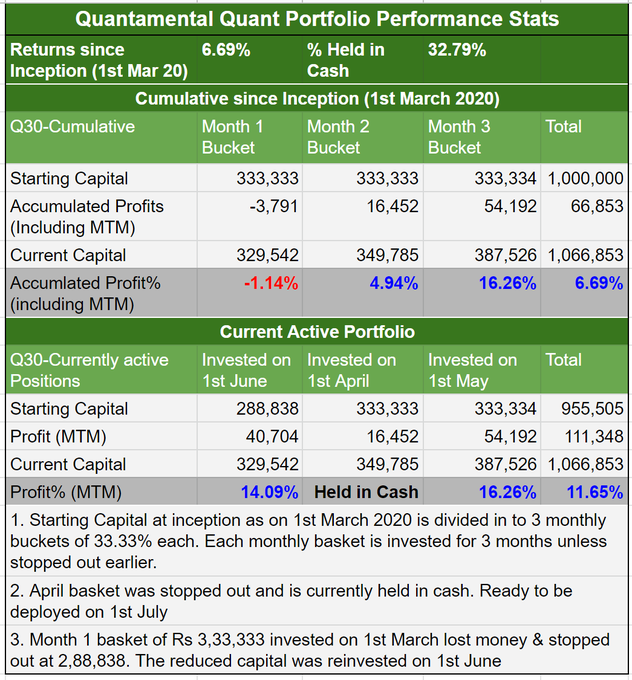
** Assuming an investment of 10 lakhs divided into 3 buckets.
I invest in Q30 in a rotating quarterly manner. That means the stock-basket invested in month 1 (M1) gets sold in month 4 (M4). Basically, I buy each basket recommended by the strategy every month and hold for 3 months. So, the stocks I bought in April, I will sell in July and buy a new lot of stocks.
This strategy is a growth+momemtum+trend following approach. The objective is to catch short term spurts in stock price movement. I have put 10 stocks in the monthly basket to diversify as much as possible. This kind of strategy will perform very well in an uptrending / bull market.
The complementary strategy to this is a mean reversion one, which I am investing now also but the strategy is not fully developed as yet. Once I am able to get it up and running, it should be a complete basket of quant strategies.
Hello, this is really a good system which will ultimately create wealth by not blocking the capital in emotional and losing trade and riding the winner. Few questions -
Basket is created on 1st day of month or it takes few days to fill?
Why April basket was stopped out?
It seems that you have a 13.33% stop loss for a basket but are there any stop loss limit for individual stock in a basket? Here if there are no stop loss for individual stock then one stock can wipe out the gain of whole basket. What kind of stop loss you keep at individual stock level - tight or wide?
If the basket which is expiring and the basket which is being bought have few common stocks, do you still sell and buy again?
Thanks,
Vaibhav
Currently, I buy on the first of every month. It could be varied, but the stock list would need to be refreshed if any other day is chosen. So, let’s say I want to execute it on the 5th of every month, I would have to run the strategy and get the stock list on the 4th evening.
The stop loss system is a complex one with dynamically calculated stop losses. I do not use a fixed percentage of stop loss either for individual stocks or for the overall portfolio.
The stop losses for individual stocks are wider compared to the portfolio-level stop losses.
I also have what is known as a regime filter. It is basically an overlay with the index.
I only buy the difference in quantities. Why would I buy and sell the basket in its entirety? My objective is to make myself wealthy, not my broker
What is the look back period that determines the top 10 each month.
Every month buy is on top 10, even if few stocks get repeated. And 4th month its holding if same stock gets repeated. But how you manage the allocation as repeat stocks must have gained a lot in 90 days time.
How to you plan fresh capital - say 5 lacs top up over initial 10 lacs investment
Thanks for explaining…just thinking if we buy say 1 st April, 1 st may, 1 June…so invest money again on 1 st July… will you sell all April stock on 30th June so capital would be available or if we sell 1 st April stock in July sometime then we need additional money to invest in 1 st July …so in total I will need around 13.33 lacs as there could be overlapping of some days in July till we sell 1 st April basket…am I missing something on this?
Regards ,
Milind
Hello Basu Sir,
I would like to thank you for sharing you insights on the forum. You are presenting a very real and practical side of the approach with both its positives and limitations. This has been very inspirational for me and I too started creating some screens and methods for screening stocks.
I have started with basic momentum and low volatility screens with a 3mo time frame for each investment set. Few screens I am using are positive to negative return days>1, low SD in daily returns over the year and past three months etc.
Few questions abt Q30 (feel free to disclose as much u want, as its your edge)
I was wondering since your strategy is a buy and hold for three months -done each month, do you provide higher weight age to the previous three month performance as compared to the whole year both in terms of technical and fundamental factors in the screen?
Since the strategy is run every month and not just after the quarterly results, do you keep tabs on news etc related to the companies currently in the basket and may decide to alter stoploss based on some adverse events?
I see that the April tranch was in the blue but you say it was stopped out and held in cash. Do you keep a trailing stop? Do you keep or plan to keep the stopped out cash in liquid fund for the remaining duration?
thank you.
With 30 stocks you can end up with only 3.3% for each stock weightage in a portfolio. The system should be robust enough to generate returns from maximum stocks to generate alpha. Why not to reduce the number of stocks from 30 to 15 or 10 to generate more returns.
The starting allocation is 3.33% and max a stock can get is 10%. You are right in the fact that once a stock repeats the following month, it usually means that the price is at the same level or higher (nothing can be generalised as there could be a scenario where everything else falls more and a particular stock falls less and thus is repeated).
In general, the allocations do not really go out of whack as its not 1 stock out of 10 which go up. It is normal in a trending market to see 6-7 stocks increasing and other remaining flat or decreasing slightly.
You can always follow the same rule of dividing the incremental capital into 3 buckets.