For individual investors, it is difficult. You can do it if you are technically oriented and a good programmer and are interested in this. That is a lot of and conditions
I don’t use zipline. I use backtesting.py and also custom mysql queries. I use python, PHP, Excel and mysql as the main technologies.
I use BSE / NSE data for fundamentals and Metastock price data.
If you honestly ask for sufficiency, ideally we need about 50+ years of data. But our market is very young and we don’t have credible data for even half that period. The other challenge is accounting practices and disclosure norms have changed so much that even if you have the fundamental data from say 1980s, it will practically be worthless other than basic revenue kind of data.
So, with the fact that “beggars cannot be choosers” in mind, we make do with what we have!!!
Yes. Actually technical quant screening is the easiest
For simple technical screening, you can use www.chartink.com. I use my own screener in Metastock and my own coding system for the portfolio level systems.
I too use similar approach, more closely similar to your TF10 (which is blend of technicals and fundamentals, hence the name TechnoFunda).
I have 2-3 different styles for each of below categories:
(a) Consistent Compounders Core Portfolio - based on fundamental factors + technical indicators on monthly and weekly charts
(b) Positional and/or momentum portfolio - based on fundamental factors + technical indicators on weekly charts (and rarely on daily charts)
The main objective of such systems are to bring objectivity to the entire process i.e. buy decisions, averaging decisions and exit decisions.
Below is the back-test results for one of the weekly indicator based strategy.
Periodicity: Weekly
Universe: BSE 500
Test Period: 2007-2018
Total return on Capital - 63x
Average return - 2x
Risk-Reward -1:15
CAGR = ~41% (without brokerage & slippage)
This is again plain vanilla backtesting. To optimize drawdown and ride winners, I use position sizing. So initial entry is with small position sizing and then I layover strategy to pyramid the allocation so that only winners get with higher position sizing while for loosing position we get out with very small loss.
Plus fundamental research adds to conviction during averaging up of position.
This enhances risk-reward further.
Also, I use long-only strategies so that risk-reward is favourable. Since downward return for shorting can be max 100% while upside could be multi-fold.
Have covered some more aspects in below video:
Key indicators I use (with further optimization around ranges):
Exponential Moving avarerages
Donchian Channels
ADX
RSI
Parabolic SAR
Volume Profiles
Disclaimer: For educational purpose only. Please do your own diligence before applying any of this.
So, here Vivek is using an advanced mechanism for the allocation part where he is adding / subtracting based on hopefully some rules.
@vivek_mashrani I did not understand the backtest table fully. What does the 2nd col (header Long) mean? Does it mean that over a period of 11 yrs (2007-2018) it has done a max of 7 long positions? Similarly did not understand the DD. Can you elaborate?
Thanks for starting this thread. I had a couple of questions and a few suggestions:
Are you backtesting the entire dataset? If you are, the backtests might be very dangerous to use in production. It is believed this leads to overfitting and confirmation bias. To overcome this, a standard technique of train-test split can be used.
The second suggestion relates to the first one. Once you have backtested and seen the winners to losers ratio, you can use Kelly Criterion to weigh your portfolio. This might further improve the quality of your returns.
Backtesting with full dataset is problematic or leads to overfitting ONLY if you have mined the data for getting the parameter set itself. If you have not, it makes no difference. Additionally, I test on different timeframes and entry exit points, also randomize individual aspects to control for bias or effectiveness checking.
I have worked with Kelly criteria and do not find it usefull at all … it cant be practically and reliably be used in real life & so have junked it for personal use!!
This is long-only strategy, idea is to maximize risk:reward. Because on short side it’s max 100% one can gain.
Now, this back-test is done individually on each company on BSE 500. So whenever the criteria is met, it will take long position and exit as per criteria. And repeat same whenever again entry criteria is met.
So, here max 7 denotes, maximum 7 long positions in one/more companies with this strategy.
On an average it’s 3 times in period of almost ~12 years, which denotes, the entry criteria is very stringent and entry is done only when it finds very strong trend to enter.
Hope this clarifies. Happy to add if required. Thanks.
Hi @basumallick . Great thread. I understand that quant investing is not the same as technical analysis. However if you look at it , all the parameters considered are related to technical analysis ( RSI, ADX, Moving averages etc) . Of course, one can also add fundamental parameters like ROE, growth etc. So I am confused as to what is the difference between the two?. I have two queries.
What differentiates quant from technical or a combination of technical and fundamental analysis?. Could you share one parameter that is outside technical/fundamental analysis?
For technical parameters, as you know there are several indicators. The result can vary depending on what you select. How did you arrive at the parameters to select?. I am not asking what all parameters you are using. But the process to select because unlike fundamental analysis, technical analysis very boring and confusing. If its something propriety, then please ignore this query.
The primary focus of technical analysis is chart patterns. The technical indicators that are used are indeed quantitative in nature and are used extensively in quant systems. Similarly, fundamental ratios and numbers are very heavily used. There are only 2 types of data about a company - fundamental and price (technical). Nothing else.
The difference between quant and technical are many:
technical focuses only on individual stock whereas quant focuses on a portfolio of stocks together
quant can be any strategy - pure fundamental, pure technical or technofunda.
Does not look at any subjective analysis - chart patterns, management or business quality etc
There are many ways to select parameters.
For example, let me walk you through a simple exercise… the framework I most often use in my discretionary investing (the non-quant style that I have been doing for the last 20 years) is QGLP. So, let’s see how we can retrofit QGLP in some quant format.
Parameters for QGLP framework
Q meaning Quality (of business & management):
ROE , ROCE, Promoter pledging, OPM, tax rate, dividend payout ratio
G meaning Growth:
Revenue growth - 1,3,5 years CAGR, PAT growth - 1,3,5 years CAGR
L meaning longevity: (this is a more subjective parameter but we can have some view by looking into the past)
Revenue growth - 10 yrs CAGR
Order book size / Annual revenue
P meaning Price:
PE, PEG, EV/EBITDA
You can also add technical factors in the price parameter. Factors like say, 200 day moving average etc.
These are parameters that I use for a QGLP strategy. You can come up with a different set or a bigger or smaller set. The values you use for filtering will also vary. There are literally millions of combinations that can occur by varying the parameters and their threshold values. You need to tinker and come up with your own for create a strategy for yourself.
So, there is no hard and fast rule as what parameters to use. You need to think of a strategy and there has to be a rationale for having that strategy. Then try to quantify it. One of the biggest challenges in quants systems these days is people are using too much on ML (machine learning) and are trying to find patterns in large data sets. Once they find a pattern, they think it can be utilised. But unless there is an underlying logic to that pattern, it usually fails as it ends up being a random pattern.
@basumallick Just wanted to understand, if your algo has shortlisted 10 stocks and you have invested 1Lakh in the same with equal weightage then the max drawdown will be for that entire 1Lakh amount?
For backtest you are mentioning Max DD of 63.3%. Does that mean the 1Lakh invested will be down by 63.3% in that period of 3 months if it is having quarterly reset
Thanks for initiating the quants thread at VP.
I see twin advantages for someone like me to get better at my own craft
a) stay on top of Emerging themes (been Mr D’s directive from 2015 to us)
b) use the output of your screens, and increasingly of other savvy folks (of this craft) like Hitesh Patel, Vivek Mashrani, and others as an objective shortlist for further investigations
Now what I found intriguing as I started going through your TF-10 and Flipper Screen Outputs was some obvious names were missing, and I thought to compile a list of my own and throw these at you.
Now these are all probably good names, were there is sustained price-volume-action for last 3 months. (this is my own amateurish first attempt - not more than an hours time spent looking up some names and charts, and manually capturing the price action; so please excuse if i have got any numbers wrong; no volumes dat used)
Point is, while the screen outputs are good to have, it is even better to understand the thought-process behind each individual screen of yours. So the purpose of my throwing these names at you, is to get you to discuss more on the thought-process, progressive filters used - as much as you are comfortable sharing.
I am envisaging the day - when we have more and more refined screens - from more and more practitioner screens at VP - and we use commonality patterns of the best screens - as the most time-sensitive objective shortlists, to work fundamentally more with. Also sort of have a rolling, more prioritised, focused Actionable list - for us deep-divers to concentrate on.
In your mind, what kind of progressive filters we fundamental investors can/should use to refine even better? (though I know that is NOT the objective of your quants system)
Good question @Donald. All my strategies throw up multiple stocks at a given time and I select the top 10 only based on some particular sorting criteria. So, it is very likely that some great stocks will be missed out.
Let me give an example of a simple system I was testing today. It is a variation (and simplified) version of Mark Minervini’s system. Here I am just looking at stocks which have crossed over the 50 day moving average and also where the 50d MA > 100 d MA > 200d MA. Thats it.
Here are the details.
Backtest results for Modified-Minervini-10.
Periodicity - Quarterly reset. i.e. Buy and hold for 3 months.
Universe - Nifty 500
Test Period - 2007 - 2020
CAGR = 40.04% (without brokerage & slippage)
Max DD (drawdowns) - 51.3%
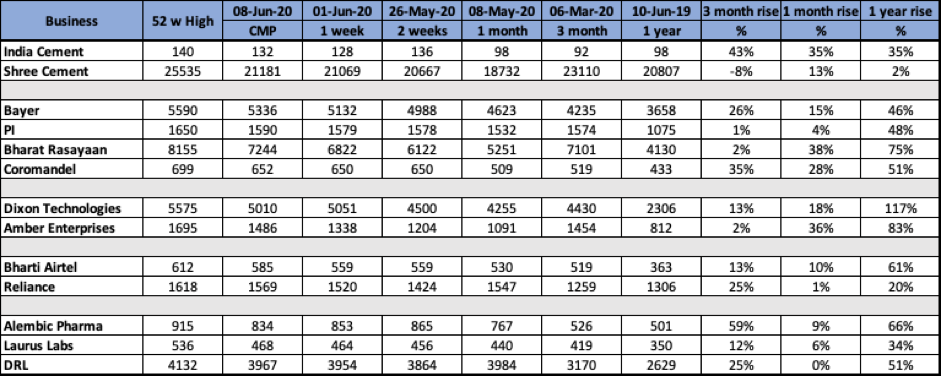
Top Stocks from 7-Jun-2020
Adani Green
JB Chem
Navin Fluorine
India Cements
Escorts
Divis
Bayer
Granules
Dixon
Shilpa
Indostar
Midhani
DrReddy
DMart
FDC
Tata Consumer
Cadila
Muthoot
Astrazeneca
Sanofi
Now, in a system you need to decide how many stocks you will want per bucket. I have done some testing and decided that 10 is a decent number as it gives a good diversification. Also, since I buy monthly for the quarterly strategy, I end up having 30 stocks in a quarter. It makes it like a Sensex - a basket of 30 stocks in a quarter.
It is possible that the 11th or 13th stock actually does better than any of the top 10 in a given month / quarter. The logic is that if any stock continues to do well, it will end up in the top 10 the next period.
The above list has a lot of stocks that you have highlighted. In fact, my Q30 system also has a number of overlaps from the stocks you have mentioned.
The point to take away is that you can design a system that works for you. Also, if you are able to follow the system without any discretion, knowing that at times, it will not work, then you will probably get close to the historic tested returns. I have given the month wise and quarter wise breakup of returns for the Q30 system on the quantamental.in website. It shows how the system would have performed “raw” in both good and bad times.
In the system in this post, you can actually do a lot of fine tuning to improve results (not necessarily return CAGR). A simple index filter and a stock + portfolio level stop loss would have prevented the massive drawdown in 2008 and probably delivered much better CAGR returns.
Thank you @basumallick for starting this useful thread. As a beginner in this field, what would be the necessities for setting up a quant investing system? From what I could understand one must have an exposure in the following:
Fundamental ratios and various aspects in B/S and income statement
Technical indicators and their applications
Some software background to implement ideas
Access to historical data for backtesting results
Automate trading strategies
Apart from these, what are some other requirements that come to your mind?
You have pretty much covered everything. You probably dont need pt 5 to start with. You also need a good understanding of portfolio based quant strategy.
I am using below Screens to keep track of stocks hitting 52 week high and mark Minervini system. I study/buy stocks which shows up multiple times in these screeners.
These are good technical systems. But unless you are buying and selling it as a basket of stocks, I would hesitate to call it a full fledged quant “system”. Picking individual stocks from any screen does not constitute a quant system.
Investing using quant requires a slightly different mindset. It is not the normal fundamental or technical trading mindset that works here.
Why we cannot have a Stop-Loss for the same. Why we should have a more draw-down in that case. If the stock price is not behaving as per the strategy then it should trigger the sell of the stock. Then we can have less draw-down and improve the overall returns using Quant. Can we have this kind of algo design or it is not possible?