
H1 FY27 results came out today and there is no thread on Prime Cable yet, so starting one.
Thesis
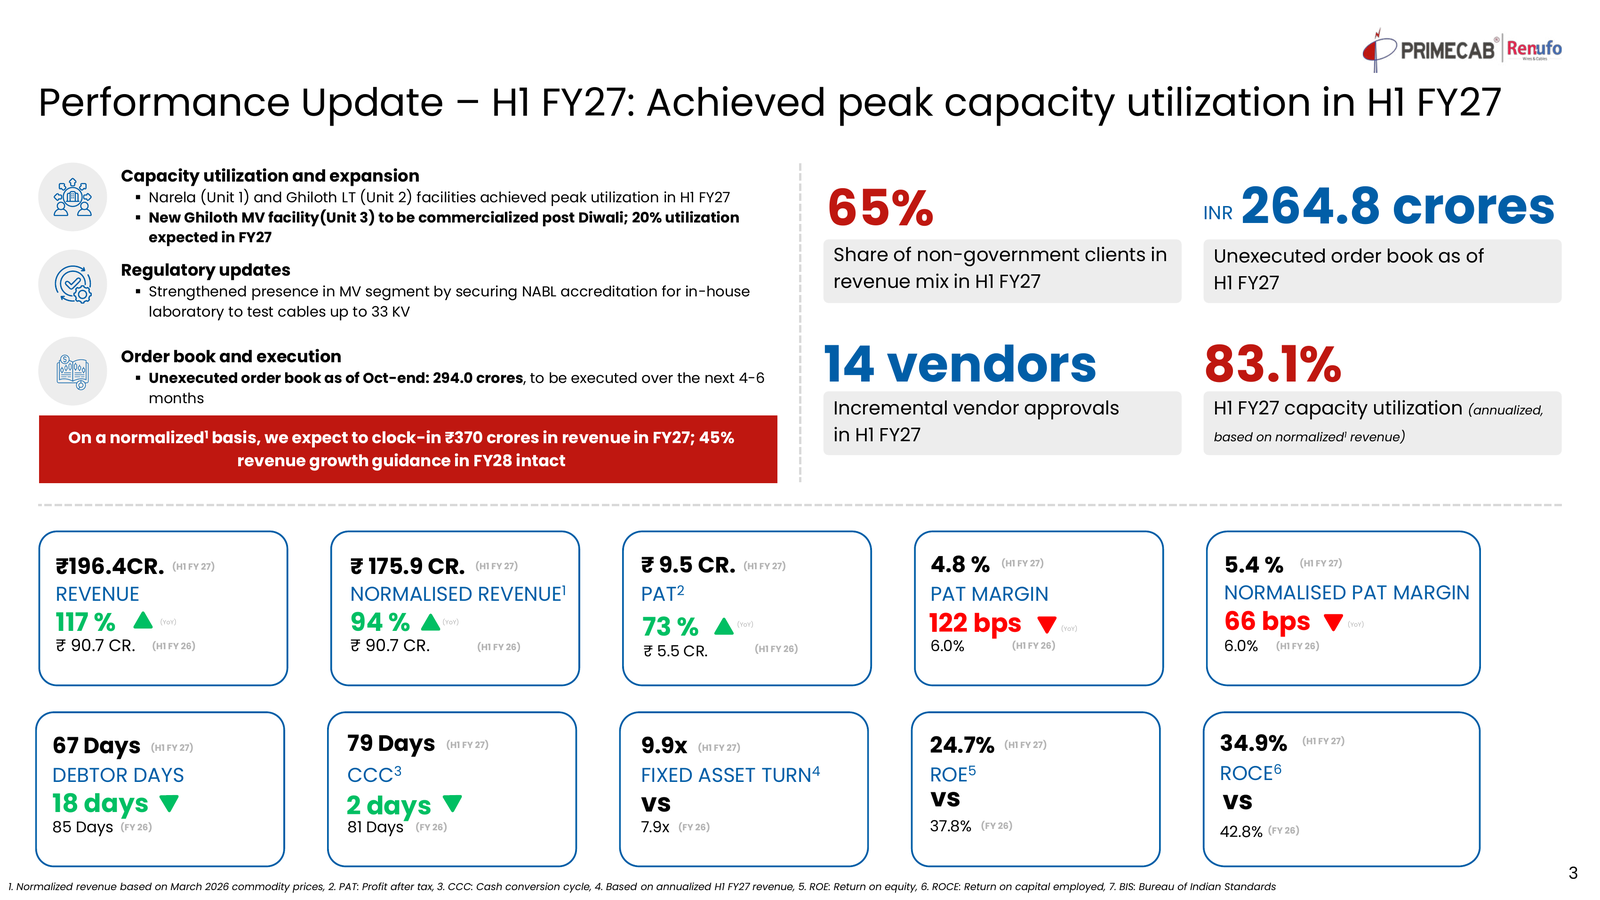
I own Prime Cable because I think the founder’s sons are turning a small Delhi LT cable maker into an LT and MV supplier to India’s power grid. Revenue went from Rs 82.5 Cr in FY24 to Rs 196.4 Cr in H1 FY27 alone, MV went from nil to 21% of sales in a year, and peak revenue capacity goes up ~70% by April 2027. At Rs 183 it trades at ~16.5x FY27 guidance. If Unit 3 fills as guided, I think EPS can reach Rs 20-24 by FY29 and the stock can be a 2-3x in about three years. Main risk: cash flow, which has stayed negative while it grows.
| Snapshot | |
|---|---|
| CMP | Rs 183 (4 Nov close, before results) |
| Mcap | ~Rs 336 Cr |
| TTM P/E | ~20.7x (EPS Rs 8.86) |
| Net debt | ~Rs 71 Cr (Sep-26) |
| Promoter holding | 68.47% (Sep-26) |
| Listing | NSE Emerge, Sep 2025 |
| Results | Half-yearly |
About the company
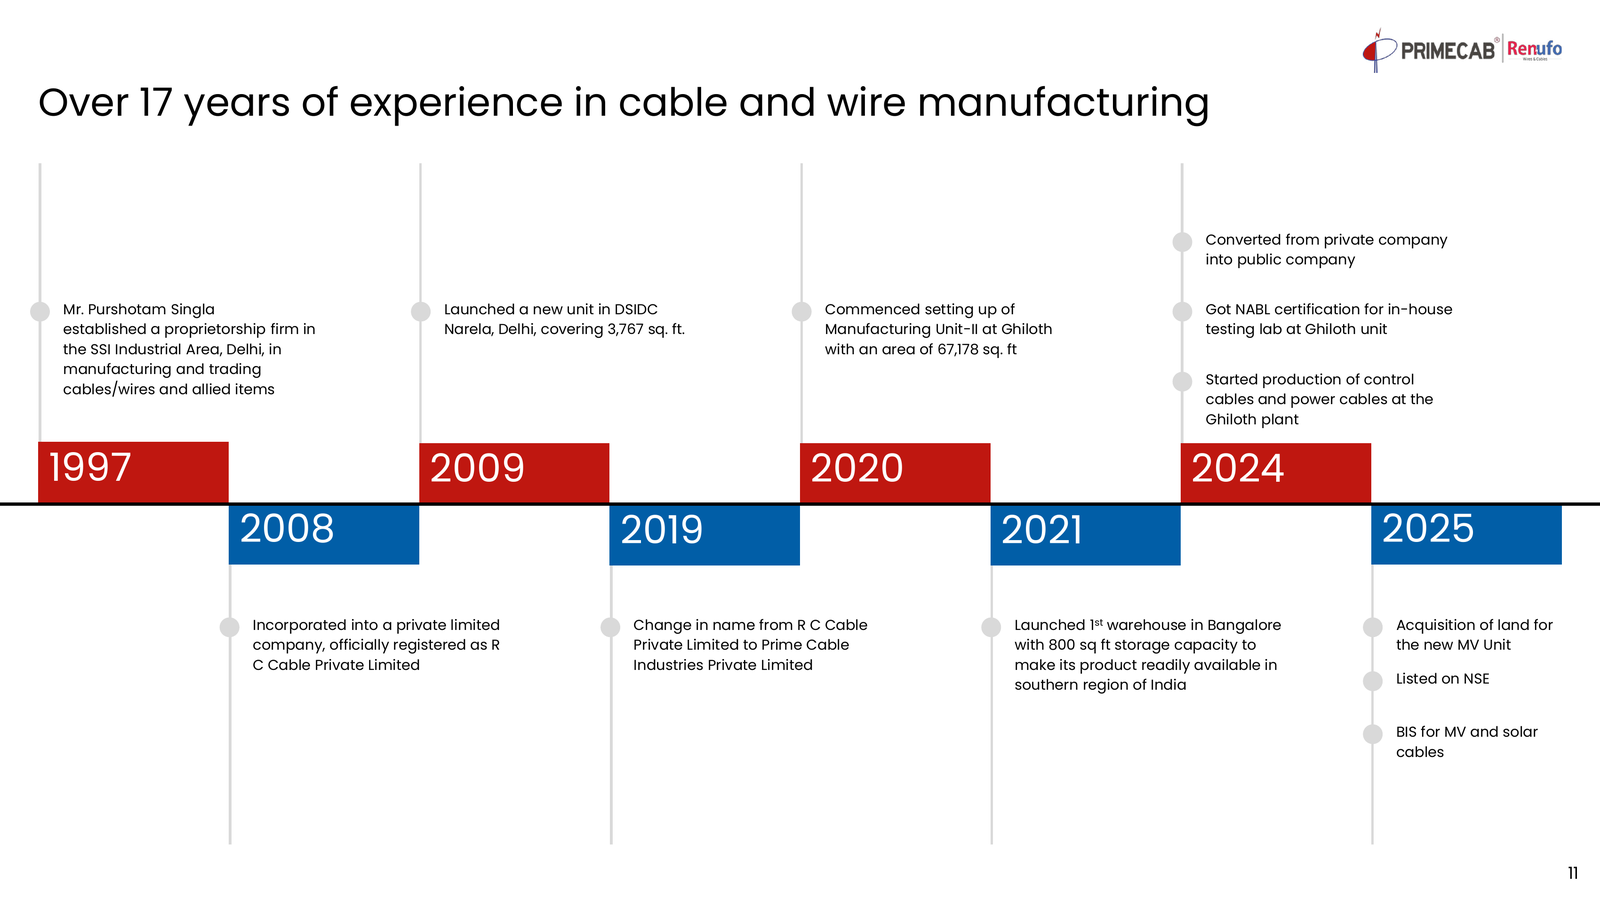
- Started in 1997 by Purshotam Singla as a proprietorship in Delhi’s SSI Industrial Area, making and trading cables and wires. Incorporated in 2008 as R C Cable Pvt Ltd, renamed Prime Cable Industries in 2019.
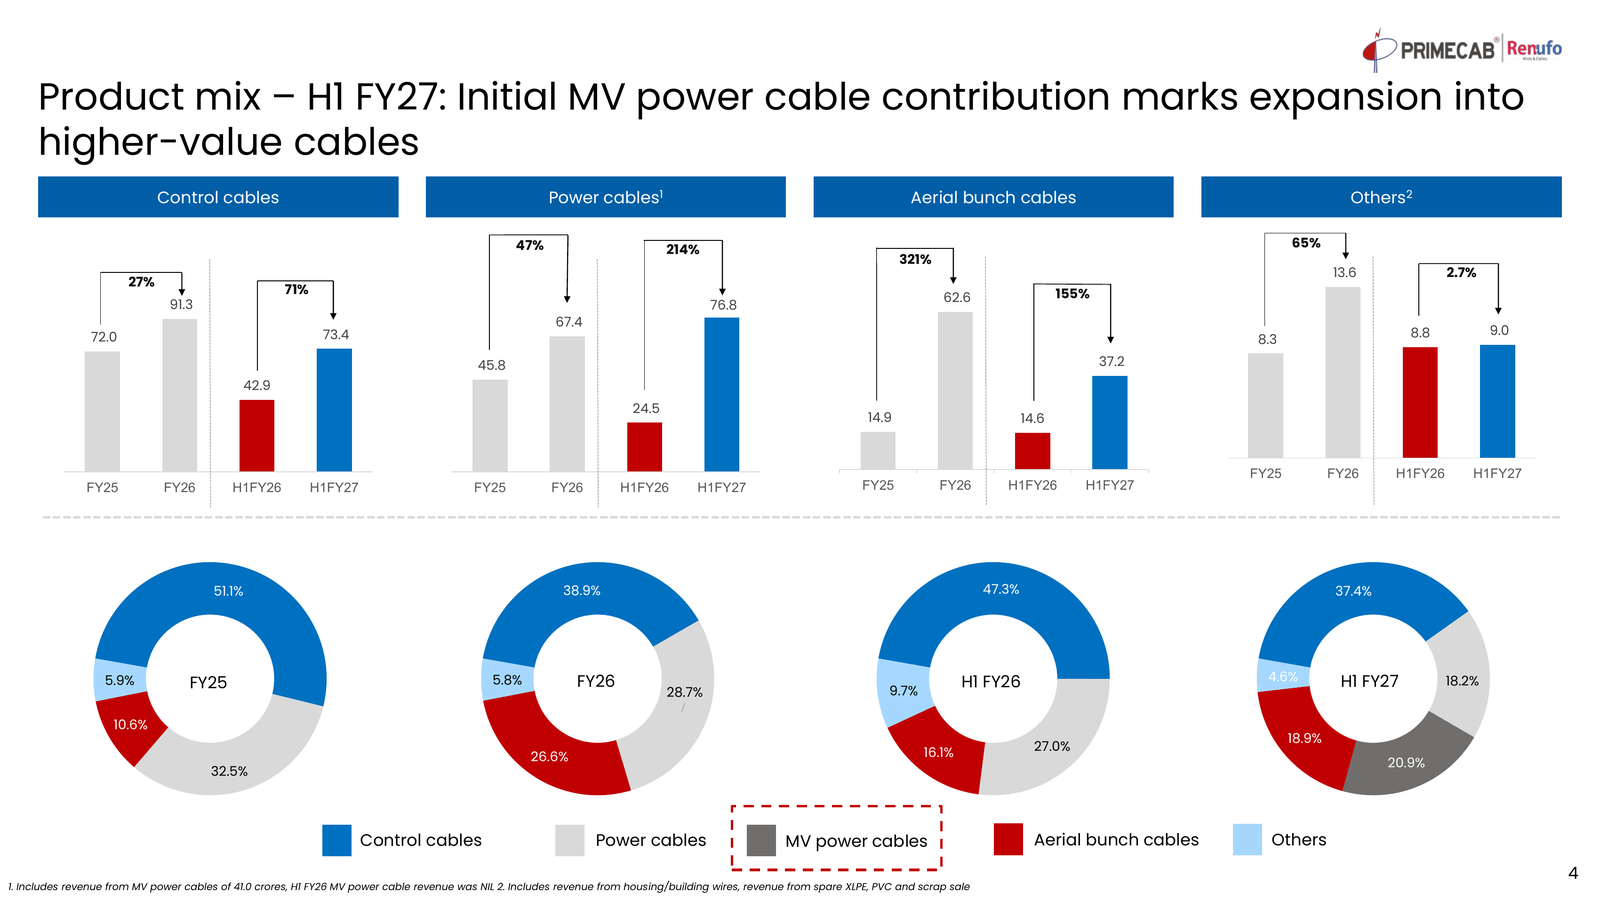
- Makes B2B cables and wires up to 33 kV: control, LT and MV power, aerial bunched and instrumentation cables, house wires, conductors and solar DC cables. Brands PRIMECAB and RENUFO.
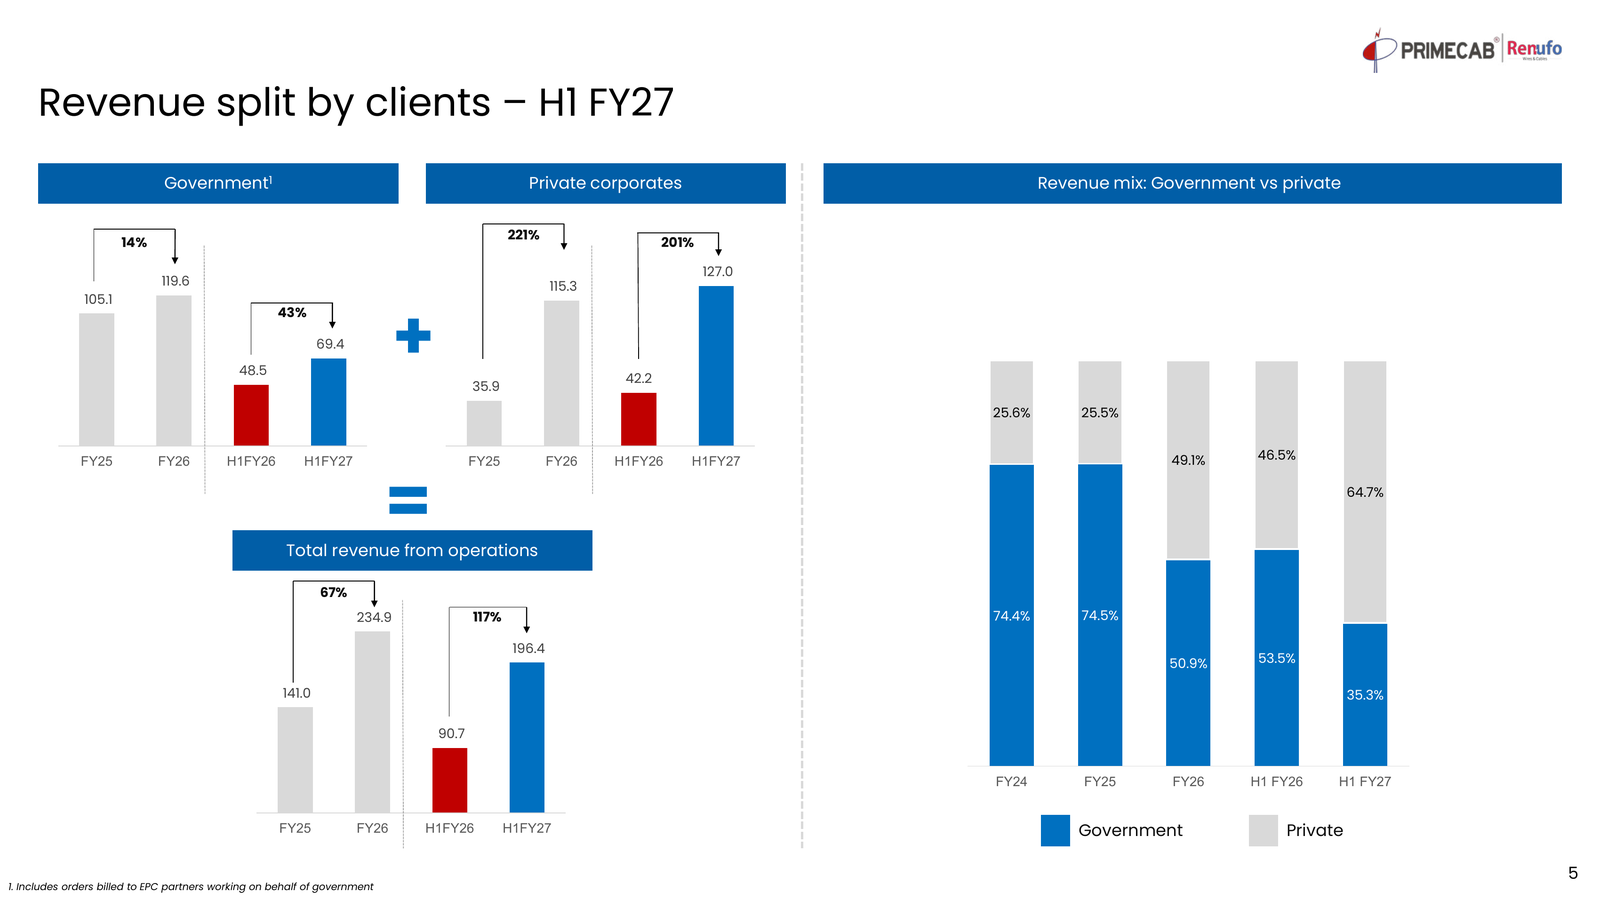
- Sells to state utilities and DISCOMs, PSUs, EPC contractors, oil & gas and industrial buyers. 96 clients, approvals in 20 states, 66 vendor approvals.
- Plants at Narela, Delhi (13,000 km) and Ghiloth, Rajasthan (24,000 km). NABL-accredited lab at Ghiloth that tests up to 33 kV. Unit 3 at Ghiloth starts on 21 Nov 2026.
- Run by Purshotam Singla (MD) and his sons Naman Singla (B2G, business development) and Nikunj Singla (B2B, manufacturing), both whole-time directors.
- Raw material is ~87% of revenue. ~80% of the order book has price variation clauses, so metal costs pass through but the rupee margin per order stays fixed. The company reports “normalised” revenue at March 2026 metal prices to show volume growth.
IPO: why it listed
- IPO on NSE Emerge, 22-24 Sep 2025, price band Rs 78-83. Issue size ~Rs 40 Cr: fresh issue Rs 35.05 Cr and offer for sale Rs 4.99 Cr. Subscribed ~8x. Anchors put in Rs 11.39 Cr.
- Listed on 29 Sep 2025 at Rs 81, below the Rs 83 issue price.
- Objects of the issue (amounts per the auditor’s utilisation certificate):
| Object | Rs Cr |
|---|---|
| New factory for MV (up to 33 kV) cables and covered conductors | 14.46 |
| Repayment of borrowings | 4.48 |
| Working capital | 7.05 |
| General corporate purposes | 4.93 |
| Issue expenses | 4.13 |
| Total fresh issue | 35.05 |
- So the listing was mainly to fund the move into MV (Unit 3) and cut debt. The auditor certificate filed with the H1 results shows no deviation in use of funds.
Timeline: how it got here
| When | What happened | Numbers |
|---|---|---|
| 1997 | Proprietorship started in Delhi | |
| 2008 | Incorporated as R C Cable Pvt Ltd | |
| 2009 | Narela unit opened, 3,767 sq ft | |
| 2019 | Renamed Prime Cable Industries | |
| 2020 | Started building Unit 2 at Ghiloth, 67,178 sq ft | |
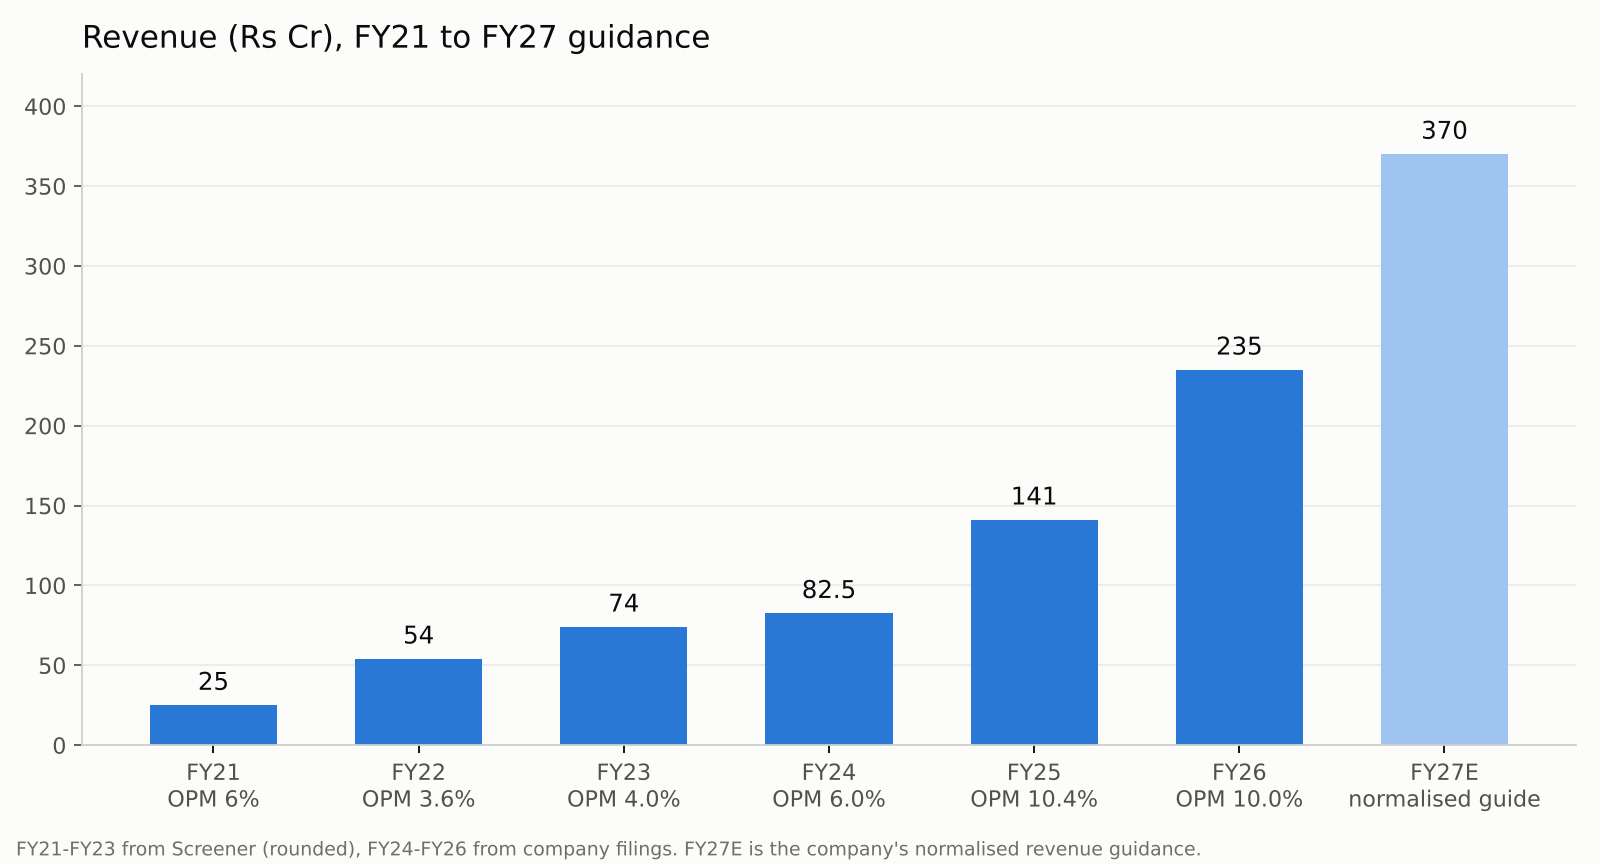
| FY21-FY23 | Small and thin-margin. Bangalore warehouse in 2021 | Revenue Rs 25 Cr to Rs 74 Cr. Operating margin 3.6-6%. PAT under Rs 1 Cr a year. Borrowings ~4x equity by FY23 |
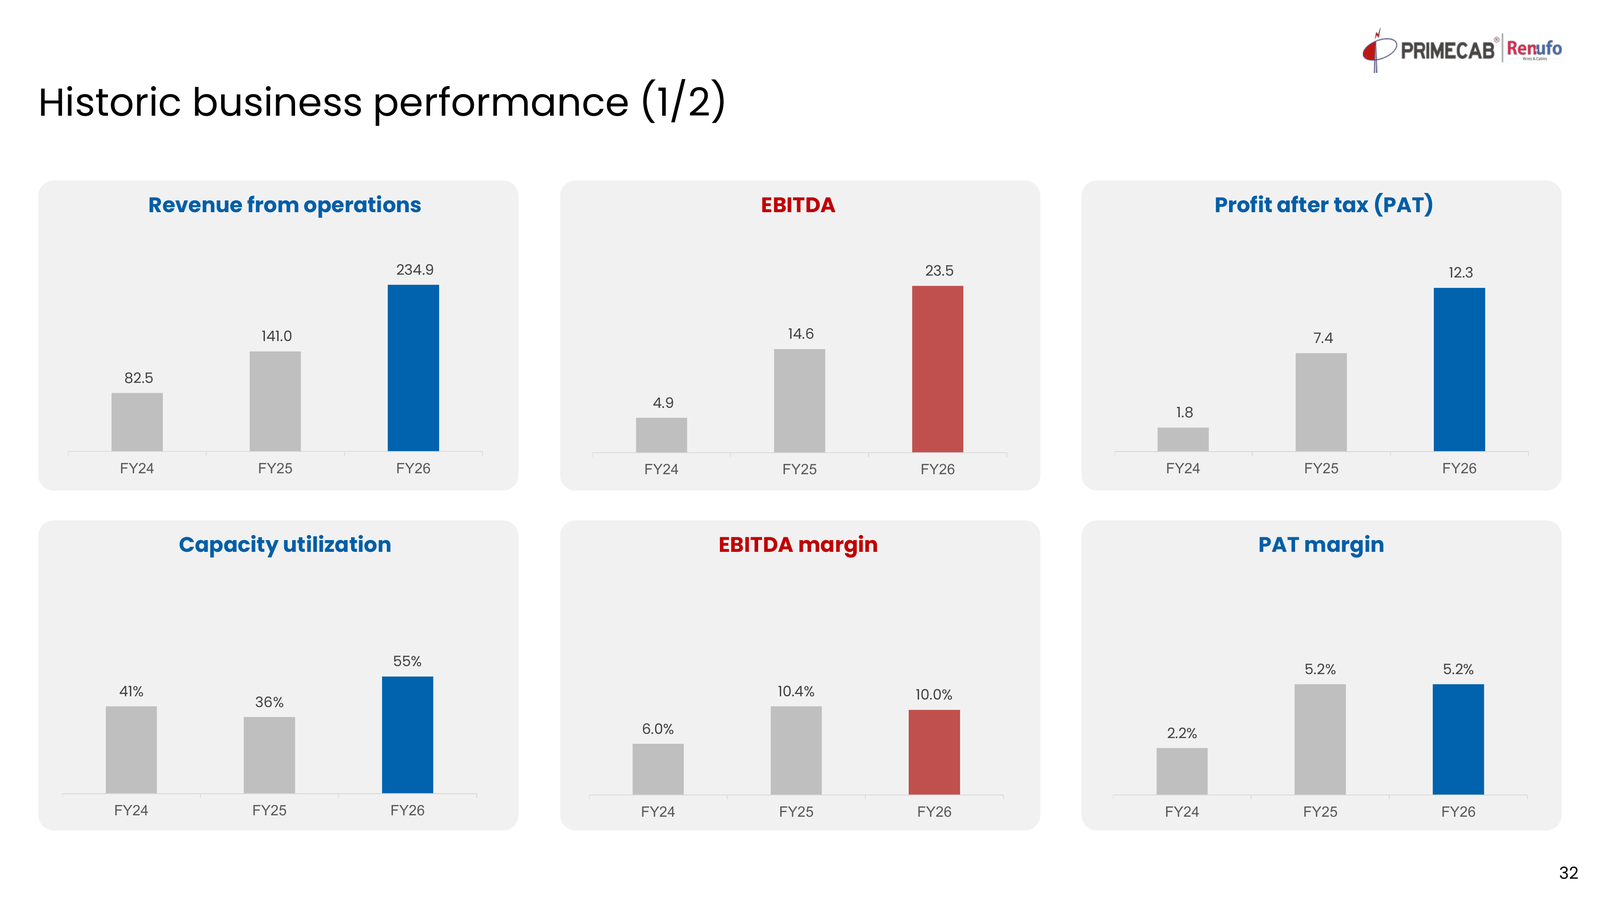
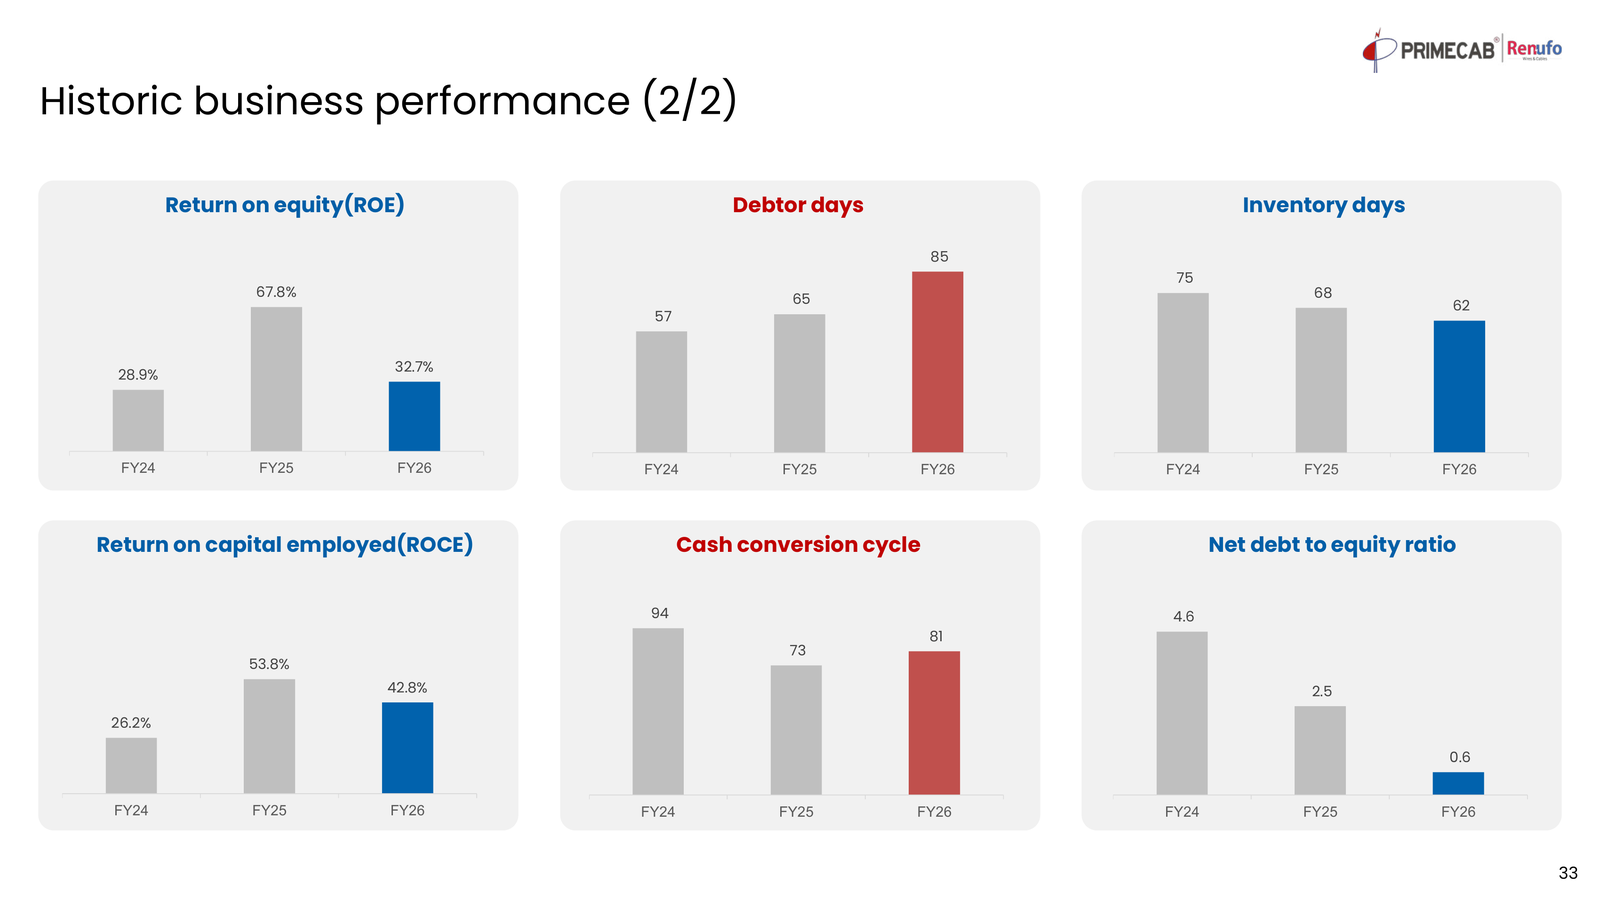
| 2024 | Ghiloth starts production. NABL lab at Ghiloth. Converted to a public company | FY24: revenue Rs 82.5 Cr, EBITDA margin 6.0%, PAT Rs 1.8 Cr, net debt/equity 4.6x, utilisation 41% |
| FY25 | Ghiloth ramps up | Revenue Rs 141 Cr (+71%), EBITDA margin 10.4%, PAT Rs 7.4 Cr, net debt/equity 2.5x |
| 2025 | Land for the MV unit. IPO in Sep. BIS for MV up to 33 kV and solar cables | |
| FY26 | Plants close to full by March | Revenue Rs 234.9 Cr (+67%), PAT Rs 12.3 Cr, net debt/equity 0.6x, utilisation 55% (~85% in March) |
| Feb 2026 | HT extrusion line for 3.3-33 kV cables | |
| H1 FY27 | MV starts to scale | Revenue Rs 196.4 Cr (+117%), PAT Rs 9.5 Cr. MV Rs 41 Cr, 21% of sales (nil a year back). Private customers 65% of sales. MV buyers went from 1 to 7 state utilities. NABL extended to 33 kV in Sep. MV orders from listed companies in Sep and Nov |
| FY22 | FY24 | FY26 | H1 FY27 | |
|---|---|---|---|---|
| Revenue (Rs Cr) | 54 | 82.5 | 234.9 | 196.4 (6 months) |
| Operating margin | 3.6% | 6.0% | 10.0% | 8.4% |
| PAT (Rs Cr) | under 1 | 1.8 | 12.3 | 9.5 |
| ROCE (Screener) | 9% | 13% | 28% | |
| Net debt/equity | 4.6x | 0.6x | ~1.0x |
Where it is going
- FY27 guidance (H1 press release): normalised revenue Rs 370 Cr, of which Rs 340 Cr from existing lines and Rs 30 Cr from the new MV line. Normalised PAT margin 5.5%, so PAT ~Rs 20 Cr and EPS ~Rs 11.
- FY28: 45% revenue growth guidance kept, which is ~Rs 535 Cr normalised.
- Unit 3, line 1: 5,000 km of MV capacity from 21 Nov 2026. Rs 150 Cr a year at peak. Guided utilisation 20% in FY27 and 85% in FY28. Target run-rate ~Rs 12.5 Cr a month by March 2027.
- Unit 3, line 2: 8,000 km from April 2027. Rs 100 Cr a year at 85%. Guided 50% utilisation in FY28.
- Unit 3 costs Rs 39.9 Cr (land on lease Rs 10.5 Cr, construction Rs 11.0 Cr, plant and machinery Rs 18.4 Cr), funded by IPO money of Rs 14.5 Cr and accruals and debt of Rs 25.4 Cr. Target asset turn 6-8x.
- Mix and margins: LT:MV of 50:50 by end of FY28. Blended EBITDA margin of 12-12.5% once all three plants run at peak (Sep conference). The new line starts at margins close to the LT plants.
- Products: AL59 and HTLS conductors in development, solar DC cables, MV covered conductors.
- Geography: revenue is concentrated in 5-6 states and approvals cover 20. Plan is to go pan-India. Exports are being explored.
- Order book Rs 294 Cr at Oct-end, of which MV Rs 66 Cr, executed over 4-6 months.
- Long-term aim: 40%+ growth a year (Sep conference).
- After line 2, capacity tops out around Rs 590-610 Cr of normalised revenue (my calc). Nothing announced beyond that yet.
Valuation
At Rs 183:
| TTM P/E | ~20.7x |
| P/E on FY27 guidance (EPS ~Rs 11.1) | ~16.5x |
| P/B (Sep-26 book ~Rs 38/share) | ~4.8x |
| EV/EBITDA, TTM (EV ~Rs 407 Cr, EBITDA Rs 30.2 Cr) | ~13.5x |
Listed peers on trailing P/E (Screener, late Sep 2026): KEI ~43x, Polycab ~43x, V-Marc ~39x, Dynamic Cables ~23x, JD Cables ~13x.
Basic DCF (base case)
Normalised revenue Rs 370 / 520 / 585 Cr for FY27-FY29, then 15%, 12%, 10% and 8% growth to FY33 with capex to match. EBITDA margin from 10% to 11.5%. Tax 26%. Working capital at 24% of incremental revenue (H1 FY27 level). WACC 14%, terminal growth 5%. Net debt Rs 71 Cr.
| Rs Cr | FY27 | FY28 | FY29 | FY30 | FY31 | FY32 | FY33 |
|---|---|---|---|---|---|---|---|
| Revenue | 370 | 520 | 585 | 673 | 753 | 829 | 895 |
| EBITDA | 37.0 | 56.2 | 66.1 | 77.4 | 86.7 | 95.3 | 102.9 |
| Capex | 25.0 | 12.0 | 6.0 | 18.9 | 18.4 | 18.2 | 17.4 |
| Working capital build | 32.4 | 36.0 | 15.6 | 21.1 | 19.4 | 18.1 | 15.9 |
| Free cash flow | -29.6 | -5.7 | 28.1 | 18.5 | 27.9 | 36.2 | 45.2 |
That gives an EV of ~Rs 260 Cr, equity of ~Rs 188 Cr and ~Rs 103 a share. 81% of the value is in the terminal year.
| Rs/share | g 4% | g 5% | g 6% |
|---|---|---|---|
| WACC 12% | 137 | 159 | 189 |
| WACC 14% | 90 | 103 | 118 |
| WACC 16% | 60 | 68 | 77 |
If working capital comes down to 18% of incremental revenue, the base value goes to ~Rs 127. The DCF is well below the price because the next two years of cash go into working capital and Unit 3. The price is paying for earnings growth, not current cash flow.
Bull, base and bear
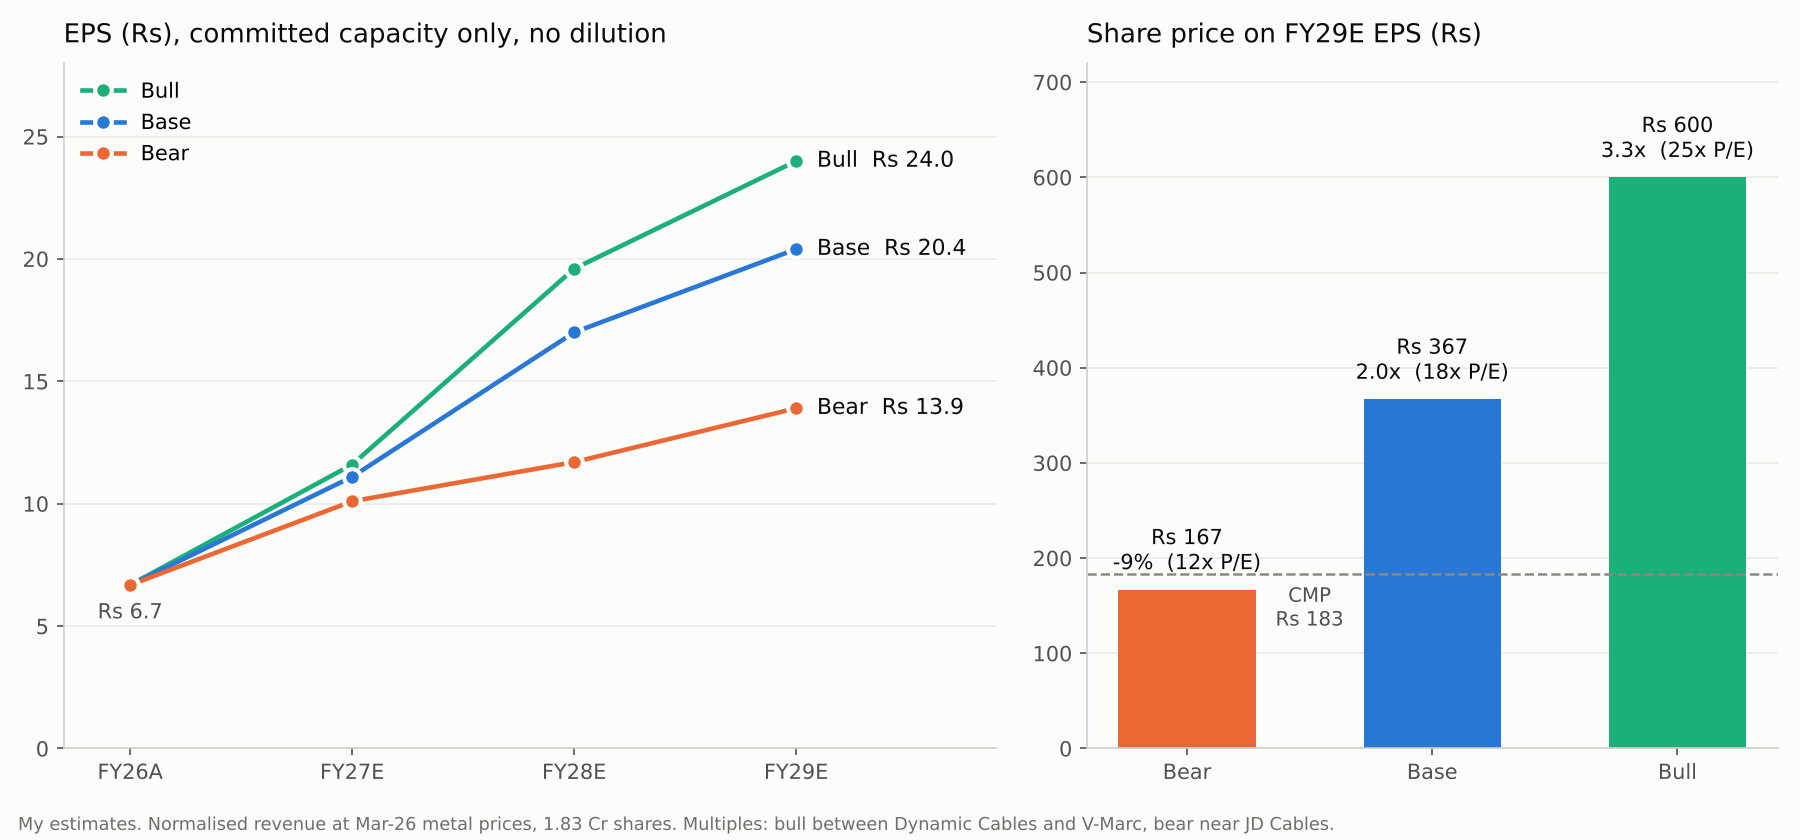
Normalised revenue, 1.83 Cr shares, no dilution, no capacity beyond line 2.
| FY27E | FY28E | FY29E | |
|---|---|---|---|
| Bull: revenue (Rs Cr) | 380 | 545 | 610 |
| Bull: PAT margin | 5.6% | 6.6% | 7.2% |
| Bull: EPS (Rs) | 11.6 | 19.6 | 24.0 |
| Base: revenue (Rs Cr) | 370 | 520 | 585 |
| Base: PAT margin | 5.5% | 6.0% | 6.4% |
| Base: EPS (Rs) | 11.1 | 17.0 | 20.4 |
| Bear: revenue (Rs Cr) | 355 | 430 | 490 |
| Bear: PAT margin | 5.2% | 5.0% | 5.2% |
| Bear: EPS (Rs) | 10.1 | 11.7 | 13.9 |
| On FY29E EPS | Bear | Base | Bull |
|---|---|---|---|
| P/E | 12x | 18x | 25x |
| Share price (Rs) | 167 | 367 | 600 |
| vs Rs 183 | -9% | 2.0x | 3.3x |
| Mcap (Rs Cr) | ~305 | ~670 | ~1,100 |
- Bull: line 1 hits 85% in FY28 as guided, line 2 starts on time, MV becomes a third or more of revenue and PAT margin reaches ~7%.
- Base: FY27 guidance met, FY28 growth ~40% (a bit under the 45% guide), PAT margin creeps up.
- Bear: Unit 3 ramps slowly, MV margins do not show up, PAT margin stays near 5%.
- Multiples: bull 25x sits between Dynamic and V-Marc, base 18x is a discount to Dynamic for size and debt, bear 12x is around JD Cables.
Latest management commentary (investor conference, 25 Sep 2026)
- MV: a year ago one state utility (MP) bought their HT cables. Now seven do, and performance certificates are coming in. The plan was utilities first, then EPCs.
- New suppliers face quantity caps on MV tenders. Their LT track record helped get these relaxed.
- Margins: LT EBITDA 9-12%, MV 14-15%. Blended 12-12.5% once all three plants run at peak. LT:MV 50:50 by end of FY28.
- Pricing: ~80% of the order book is on price variation. Rupee margin stays fixed and % margin dips when metal rises. Firm-price orders are hedged back-to-back or on MCX.
- Working capital: customers pay in 40-60 days and MV takes 40-45 days to make, so the cycle is 80-100 days. Target ~70 days as EPC share rises. EPC share was ~30% two years ago and is now over 50%.
- Receivables: no bad debts so far. State utilities pay much better than 5-6 years ago.
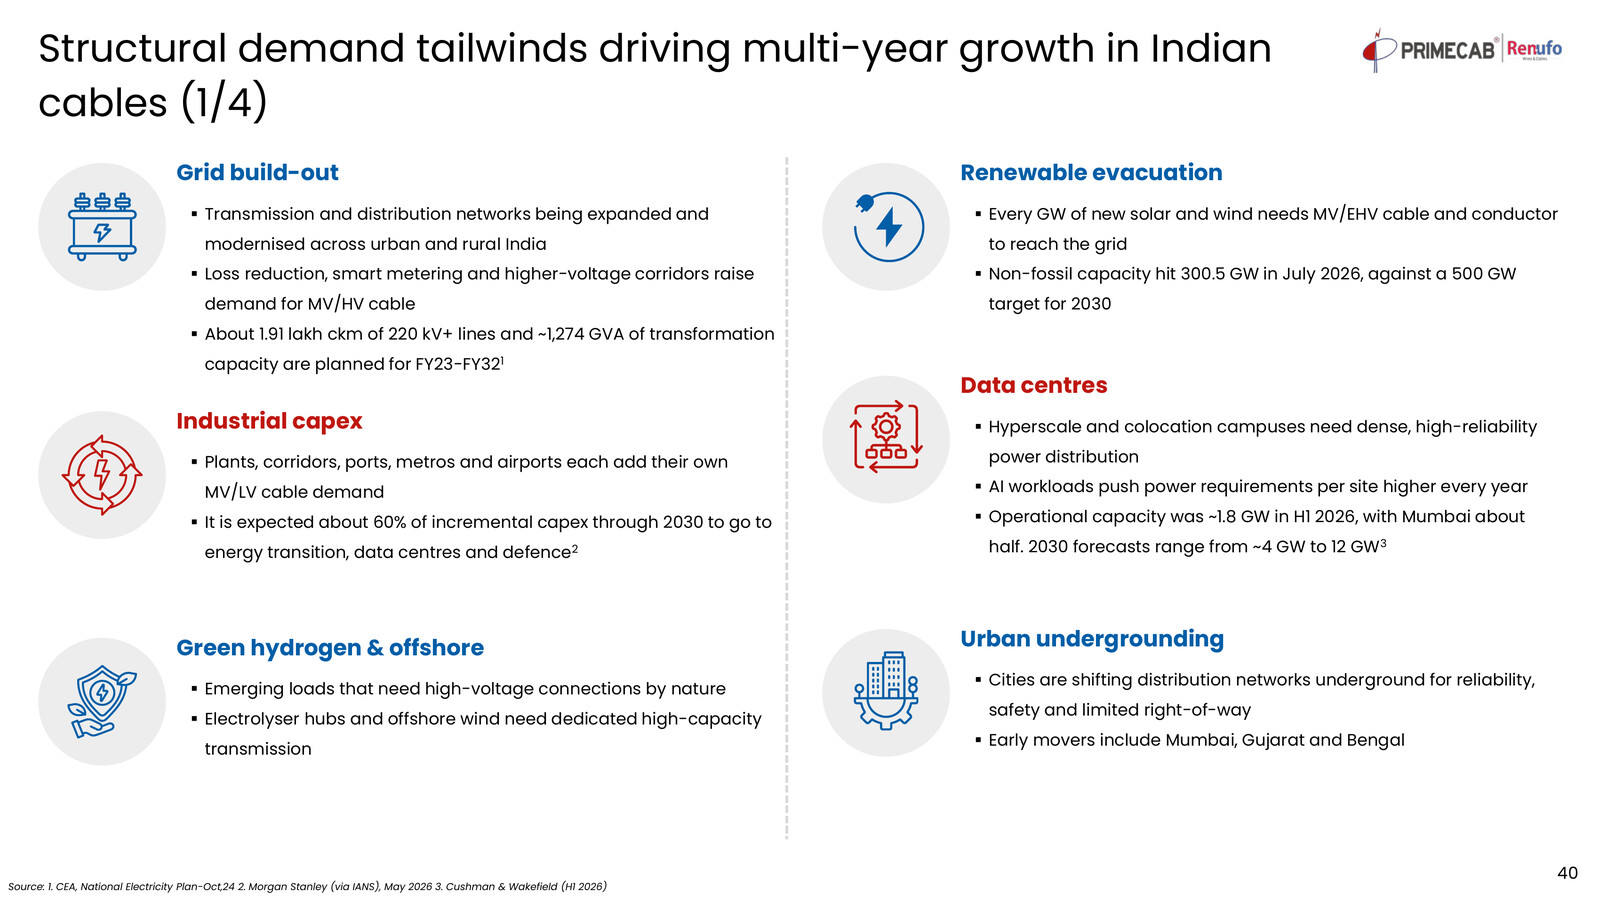
- Demand: ahead of supply at every voltage, expected to last ~5 years. Gujarat’s coastal undergrounding needs ~Rs 22,000 Cr of MV cable.
- New products: AL59 and HTLS conductors in development. The solar cable licence took a year because of a 365-day UV test. Rs 7-8 Cr of solar orders since.
- Competition: Aditya Birla’s Ultravolt is going into retail wires. Approvals in B2B power cables take 3-5 years to build.
- Guidance: stuck to 40-50% growth for FY27. ~80% utilisation in Q1. Long-term aim of 40%+ a year.
- Asked about operating cash flow and a debt/equity ceiling, no numbers were given.
What I am tracking
- Unit 3 start on 21 Nov and the ~Rs 12.5 Cr a month run-rate targeted for March 2027.
- H2 operating cash flow and inventory. Inventory went up Rs 24 Cr in H1.
- PAT margin vs the 5.5% FY27 guide, and MV margins as Unit 3 runs.
- Borrowings, which went from Rs 51.5 Cr (Mar-26) to Rs 75.5 Cr (Sep-26).
- MV and EPC order flow, and the order book against Rs 294 Cr.
- Any capacity plan beyond April 2027, and how it gets funded.
What I am not tracking
- Reported revenue swings from metal prices. I look at normalised revenue and rupee PAT.
- Market-size headlines like the MV market growing 5x by 2030 that came up at the conference. The company’s own deck uses ~15% a year.
- Individual order announcements. The order book tells me more.
- Short-term price moves. The float is small, so circuits and big swings are normal.
What is missing
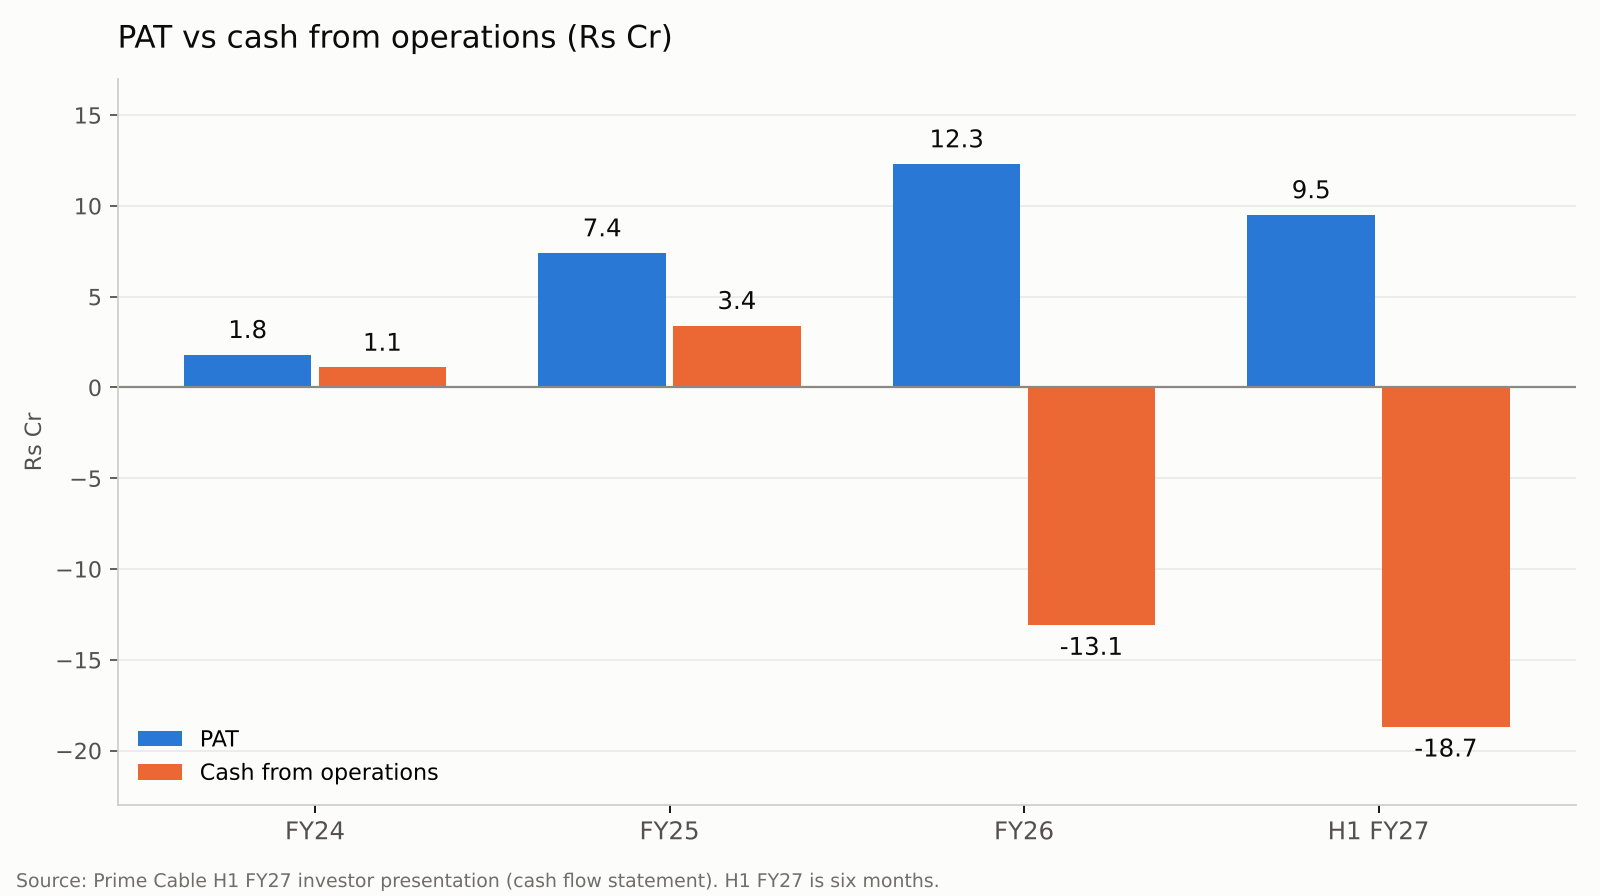
- Cash. Operating cash flow was -Rs 13.1 Cr in FY26 and -Rs 18.7 Cr in H1 FY27. From FY24 to H1 FY27, cumulative operating cash flow is -Rs 27 Cr against Rs 31 Cr of PAT. No operating cash flow target has been given.
- Funding after FY29. The next leg needs new capacity, and with negative operating cash flow that means debt or equity. My numbers assume no dilution. Every 10% of dilution cuts EPS by ~9%.
- Volumes in km by product, and actual MV vs LT margins.
- Receivable ageing, and the split of the order book by government and private.
- Names of the listed companies behind the MV orders.
- Quarterly P&L. Only half-yearly results.
- FY28 capex.
Disc: Invested, so read this with that bias. Not a buy/sell recommendation. Questions and corrections welcome.