Hey Guys,
As every new kid in the block, i would like to start with saying that this is my first topic in ValuePickr and would like to apologize in advance for any mistakes from my end.
I have been working on Power BI (PBI) from last couple of days to convert the data of several companies into meaningful visuals, so that it becomes easier to compare data across companies in an given industry. In this example, i have taken the data of 5 Agro-chemical based companies for comparison with the intent on seeing how Bharat Rasayan is performing against its peers. This is “draft 1” of the analysis and i would like to improve the tool with the inputs from fellow community members.
So to start with, there are 5 sheets within the PBI file, each having 4 visuals in it. Some of the visuals might be repeating in couple of sheets. To play around with the data we also have two filters, one to slice the periods or years and other to select the companies. You can select all the companies or few of them based on what you are looking for.
-
Summary
-
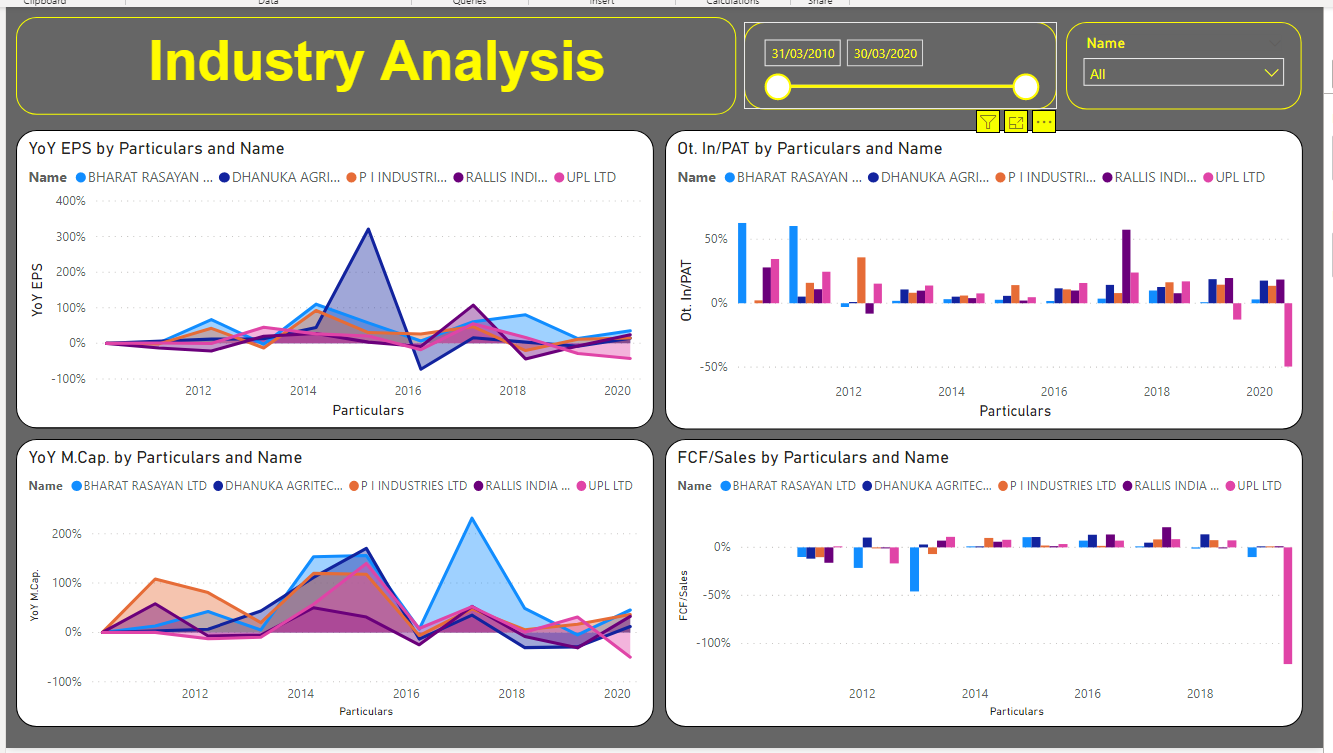
Profitability
-
Return Ratios
-
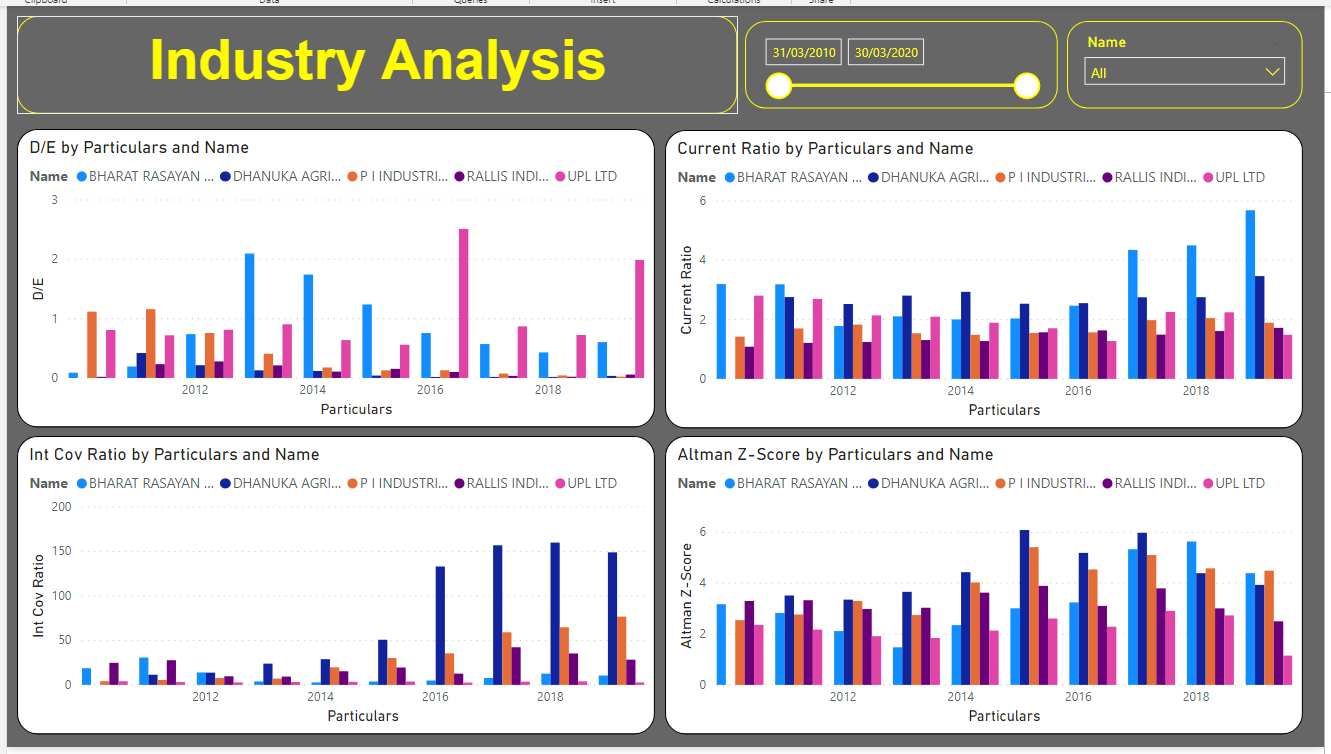
Debt
-
Valuations


Link to the files: https://1drv.ms/u/s!ApsL3QLWJQrAhE3VRX_8qpSrhmo5?e=EucTU4
You will find 1 excel file and 1 .pbix file in the above link.
The excel file is the customized screener.in file and you will have download the data in this format from screener if you intend to use this tool. Download the excel files for all the companies you want to compare and place them in a folder. The number of companies depends on you and does not have any limitations. Please do not keep the PBI file along with the excel files. Keep it somewhere else.
To install PBI software, make sure you have Windows 10 . Install the Power Bi desktop on your system from app store (very important). You need not sign in to PBI and it would not allow you to do also, unless you have an corporate account. We do not need the sign in feature, since we are not going to publish the report and it is purely for personal use. PBI is free for personal use.
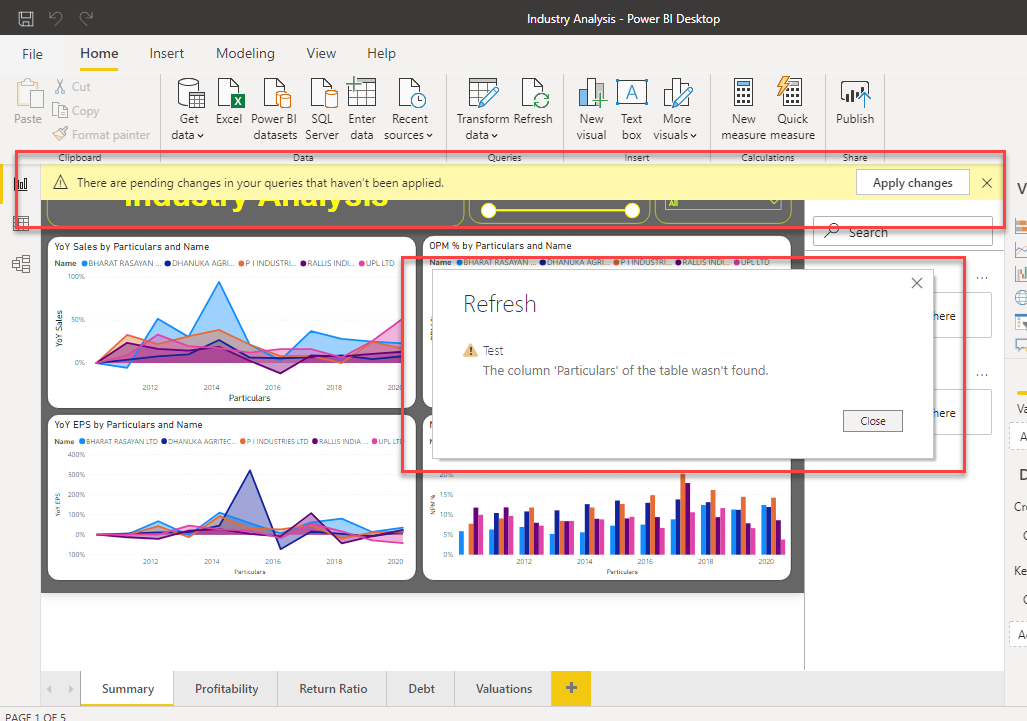
How to refresh the report with your own data:
- Place all the excel files (as mentioned above) in one folder. Make sure you have opened all the excel file and click on “Enable content” and confirm the numbers are flowing.
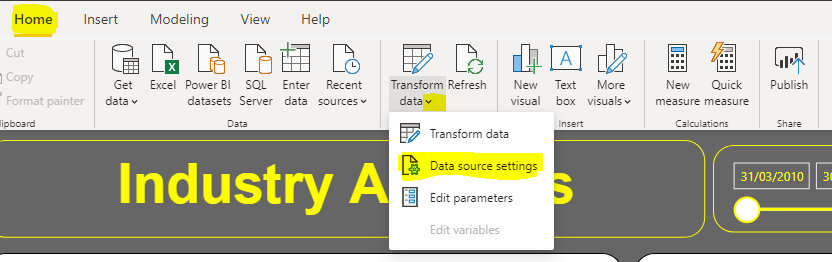
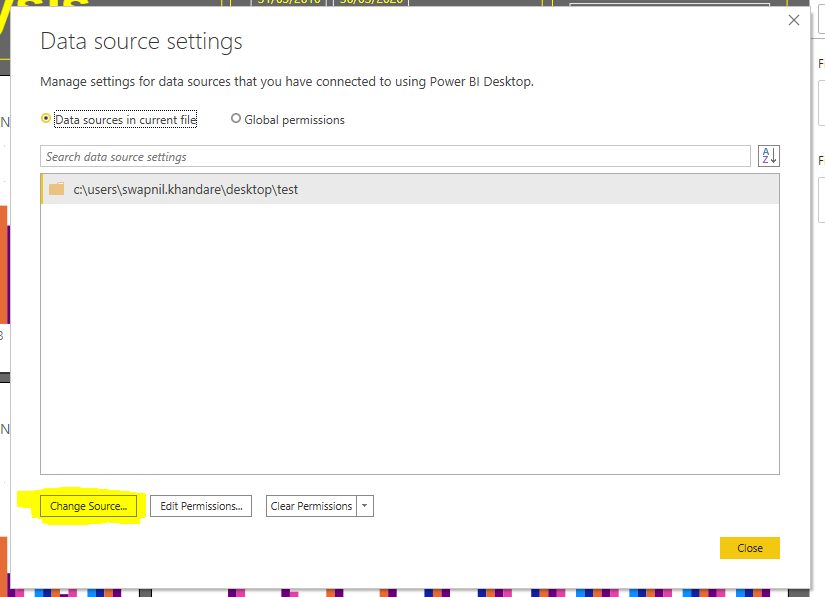
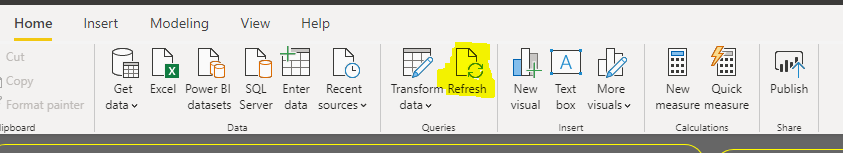
- Open PBI, go to Home > Select drop down from Transform Data > Data source settings.
- At the bottom left of the next screen, click “Change Source”
- Select the right folder where the files are saved in point 1. Select the folder and not individual files.
- Hit Refresh
And you are done. You would have all the visual refreshed with your data and you can go ahead and play with it.
I would like to give credit to @Donald and @hitesh2710 for providing their version of the screener file from which i have taken a lot of cues.
Looking forward to inputs from the community members and point out where i can improve my analysis.
Thank you
Swapnil