It converts dense concall/disclosure text into crisp, structured insights with a scoring framework to track what is improving, weakening, or changing.
You can quickly compare companies via leaderboards, see trend shifts (latest quarter vs prior 4Q context), and review growth outlook scenarios (base/upside/downside) in one place.
Goal: reduce noise, improve consistency, and make quarterly review faster for serious investors.
@Pranav_Yadav
Congratulations on developing a tool which would help the investor community as a whole.
Few questions & few suggestions:
1.) Try clearing out your monetisation strategy/outlook (if any) upfront without keeping the community guessing/doubting & repeatedly asking going forward.
2.) Do a short walk around video so that community knows how to extract best out of the tool & know every feature instead of having a D.I.Y.
3.) Regarding the tool, Try emphasizing quality of management.
Coz Giving guidances & showing rosy pictures is one thing- adhering to it, surpassing & fulfilling it without revisions is altogether a different ball-game.
4.) How conducive or non-conducive is the macro economic factor to the company.
Is there a headwind/tailwind to the company in terms of policies, market demand, raw prices, currency fluctuations, etc - whatever suits that particular company’s metrics.
If any of this is already addressed, do let me know. Yet to explore the tool in full depth.
Congratulations the tool looks impressive and will definetly be helpful for the larger community.
What i would like to ask:
How often, post every quarterly results the scores will be updated? and to how many previous quarterly results we can see the ratings.
Hope there is a reference for every score to actual “concall based transcript section” if that is the source for the data points and score. This is to be sure what we are looking at is actually what is it.
For now this is it, yet to explore more on the tool. KUDOS!
Thank you @vivek_lakhani for your questions and interest, I appreciate it, it makes me feel supported.
Here are my answers :
Monetisation outlook - No plans for 2026, this is a free tool until I can see value and results for myself. There might be a fund me feature sometime later to cover the tech and LLM costs
Great Idea. I want to use the company pages for Youtube videos and I will use this as motivation
Noted - a section on management and Walking the Talk. I have gotten this feedback elsewhere as well and prioritise
Noted - I initially added an industry block inside the growth section of the company but removed it for simplicity and I wasn’t happy with it. I will work on it for sure as it needs more and wider variety of input data to create an industry / macroeconomic section relative to company sections
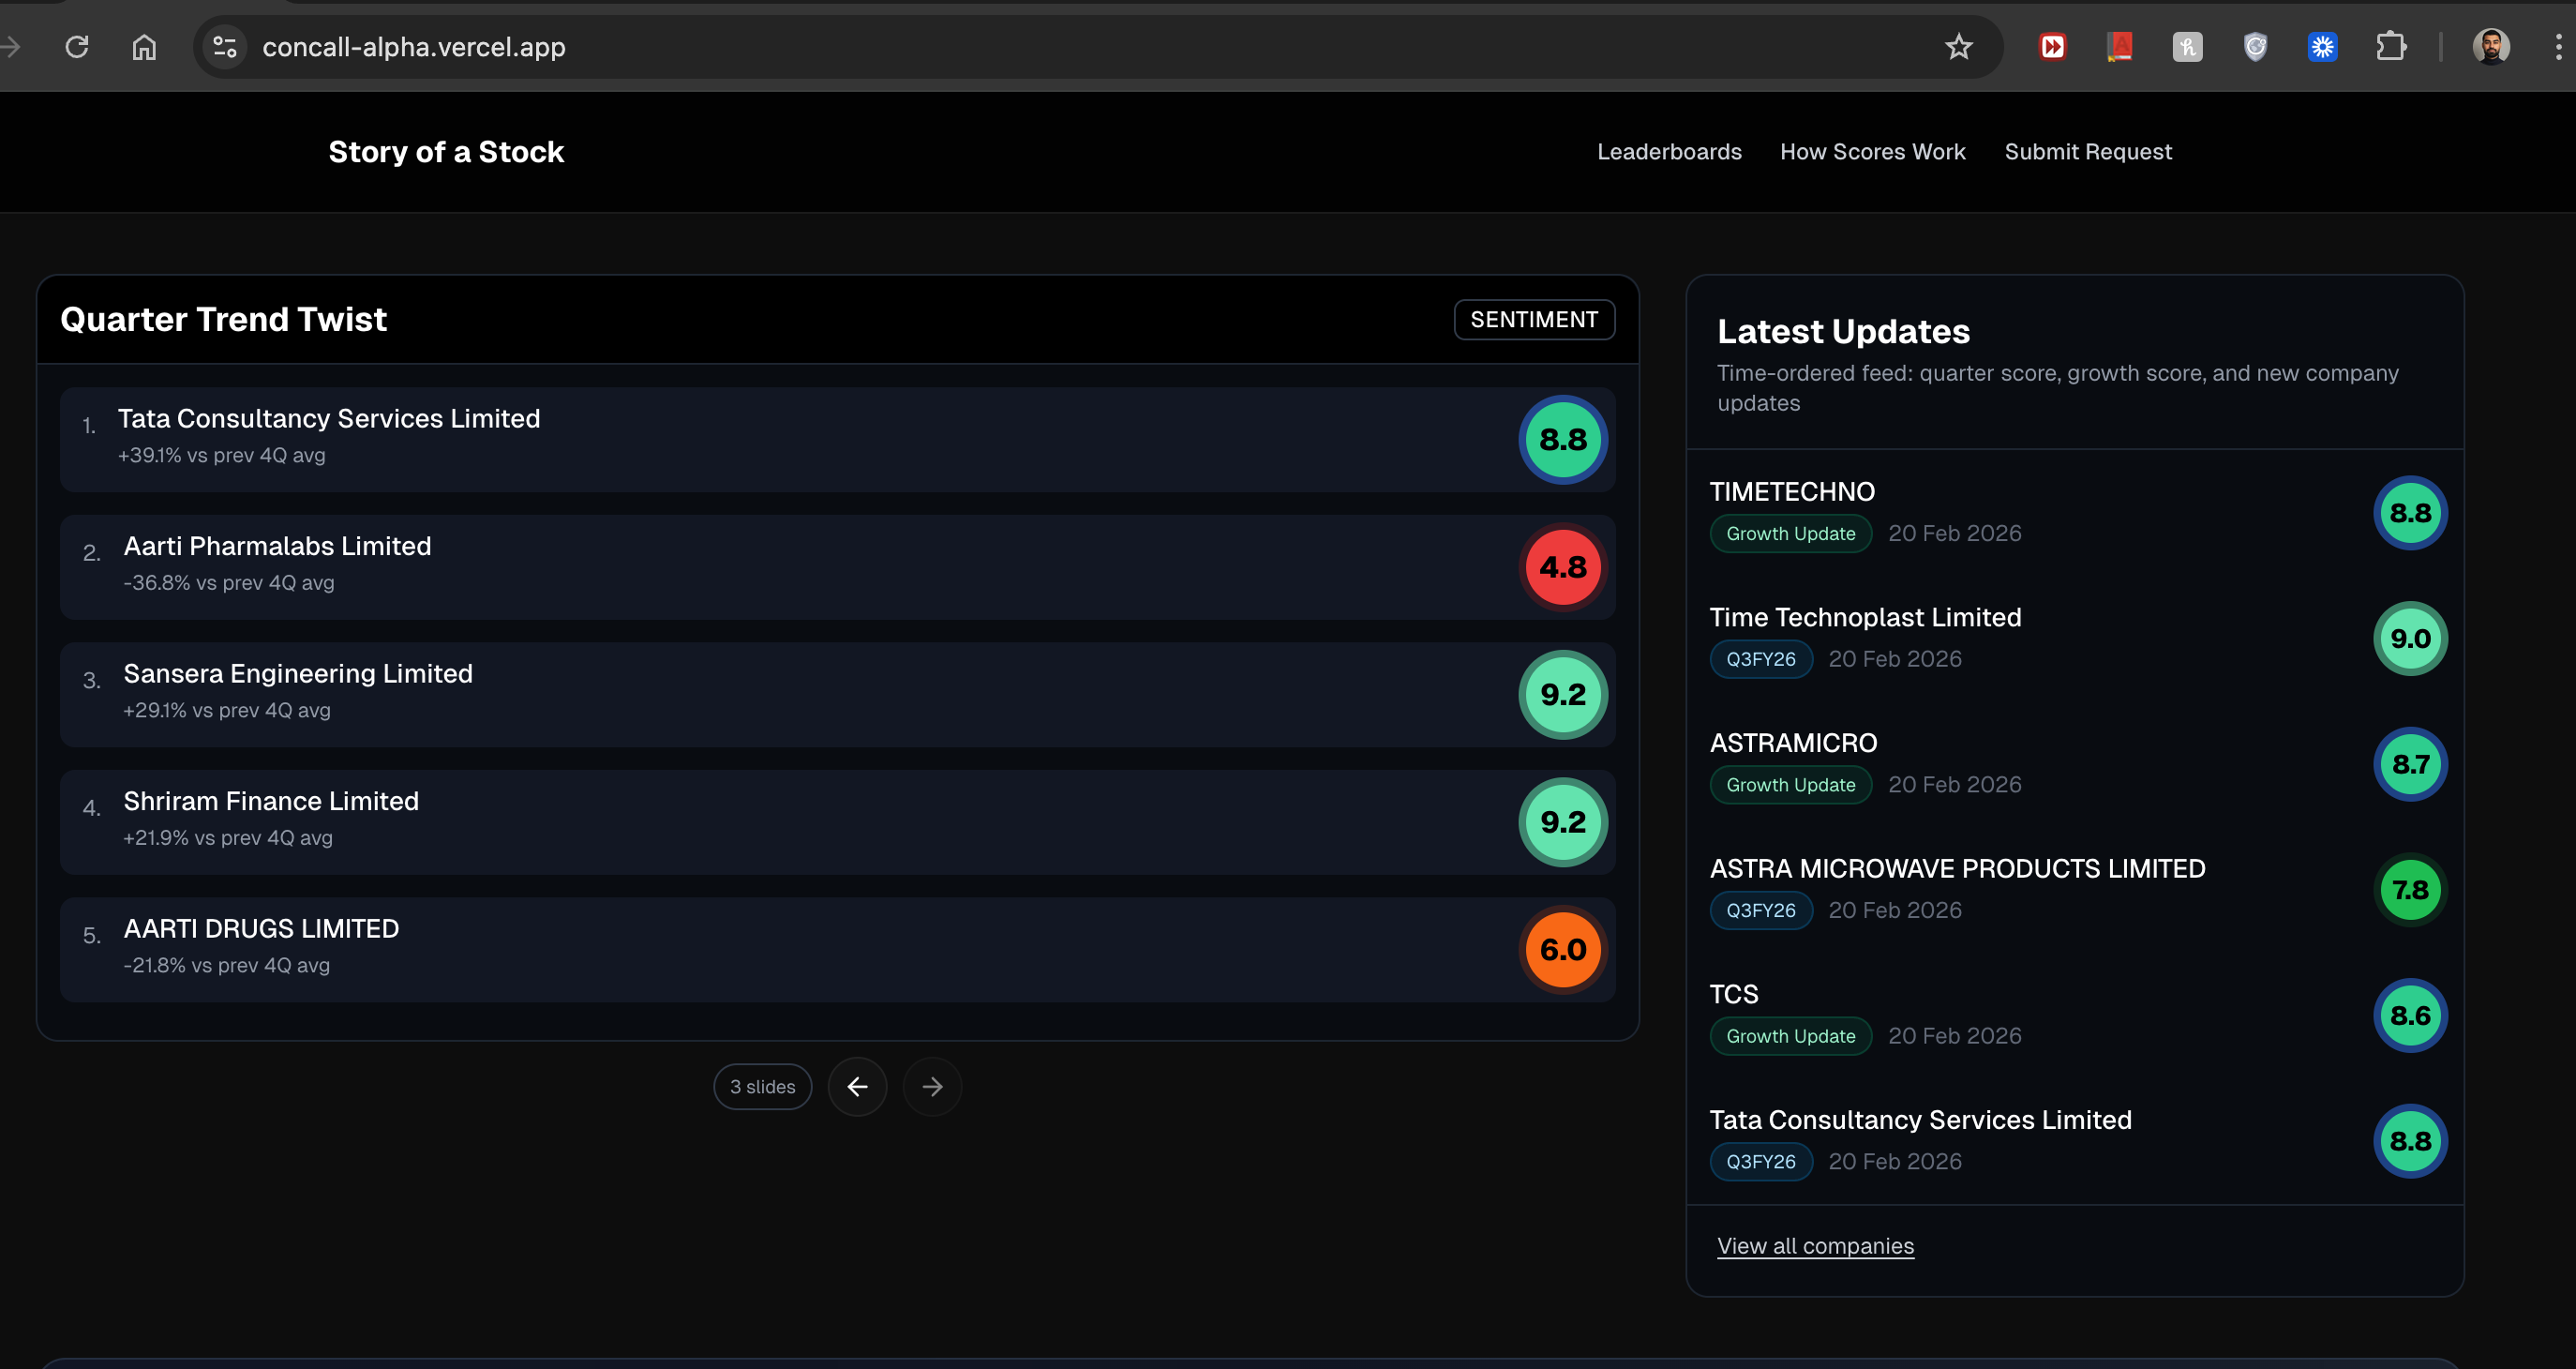
@imurlovish The declining pill tries to capture the trend of the quarterly score, comparing the latest score with the 4 qtr average. Since latest score(8.8) is less than 4qtr avg (9), the trend is declining
What I would like to see is the reason for historical one offs. Lets say stock x has in 2017-18 a major loss/profit or maybe major step change in earnings downwards or upwards whether quarterly or yearly. I would like to know why whether through concall notes or MDA part of the AR.
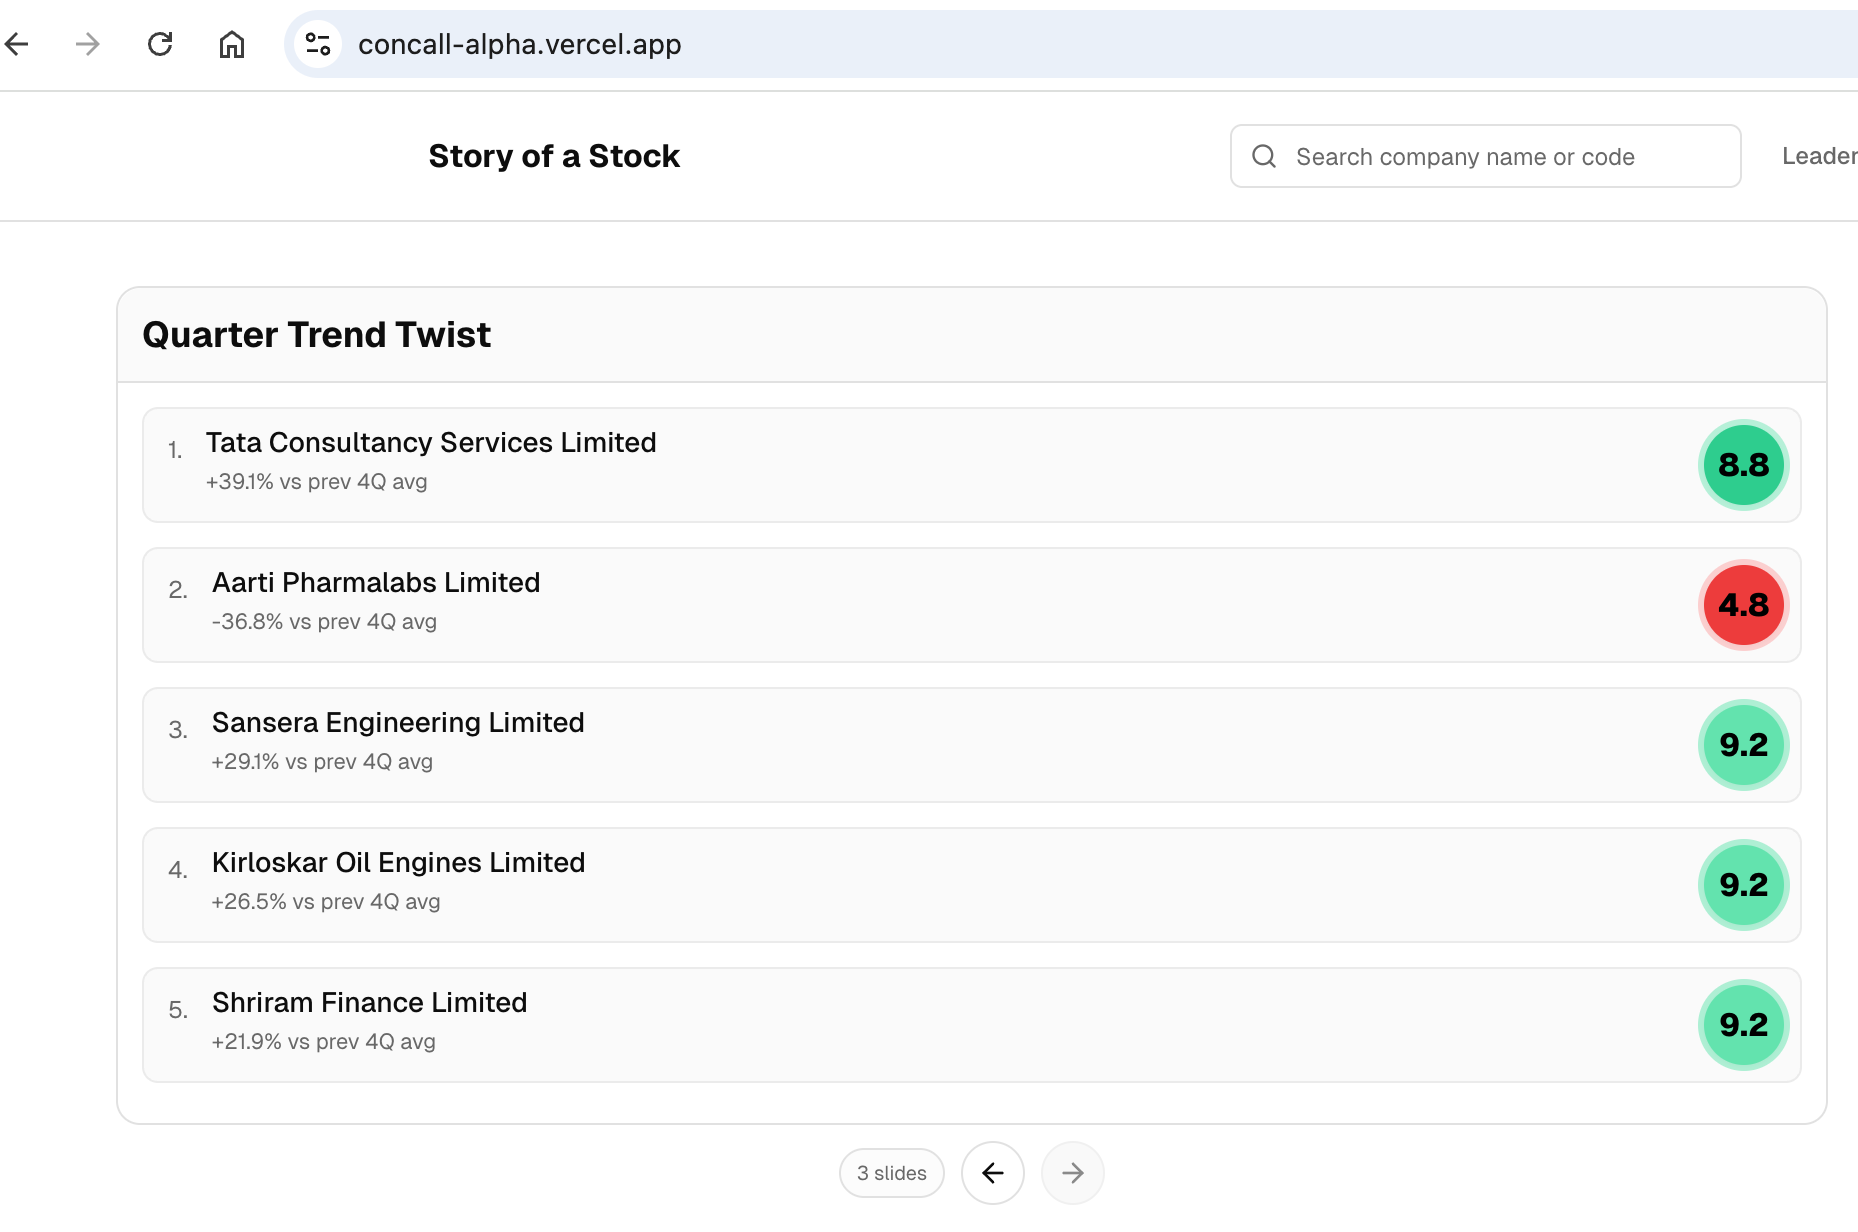
@hardik_shah1 Quarterly trend twist might be of interest to you, it shows the companies where scores diverged from the average the most in the latest quarter, giving a way to capture step change - can be either in earnings, outlook, guidance. The rationale is provided in the quarter score details
Theme: Currently the platform theme is based on default theme of the browser, will add a way to toggle this on the website soon
Couple of reasons for 66 companies as of now -
LLM restrictions - since I use free tier of Gemini, I have limitation of 20 request per day
Building phase - the portal is growing and I already added multiple new features last week, so right now the focus is on quality. Once that is achieved, I can scale it across all companies.
ps - You can request companies on the portal that you’d like added
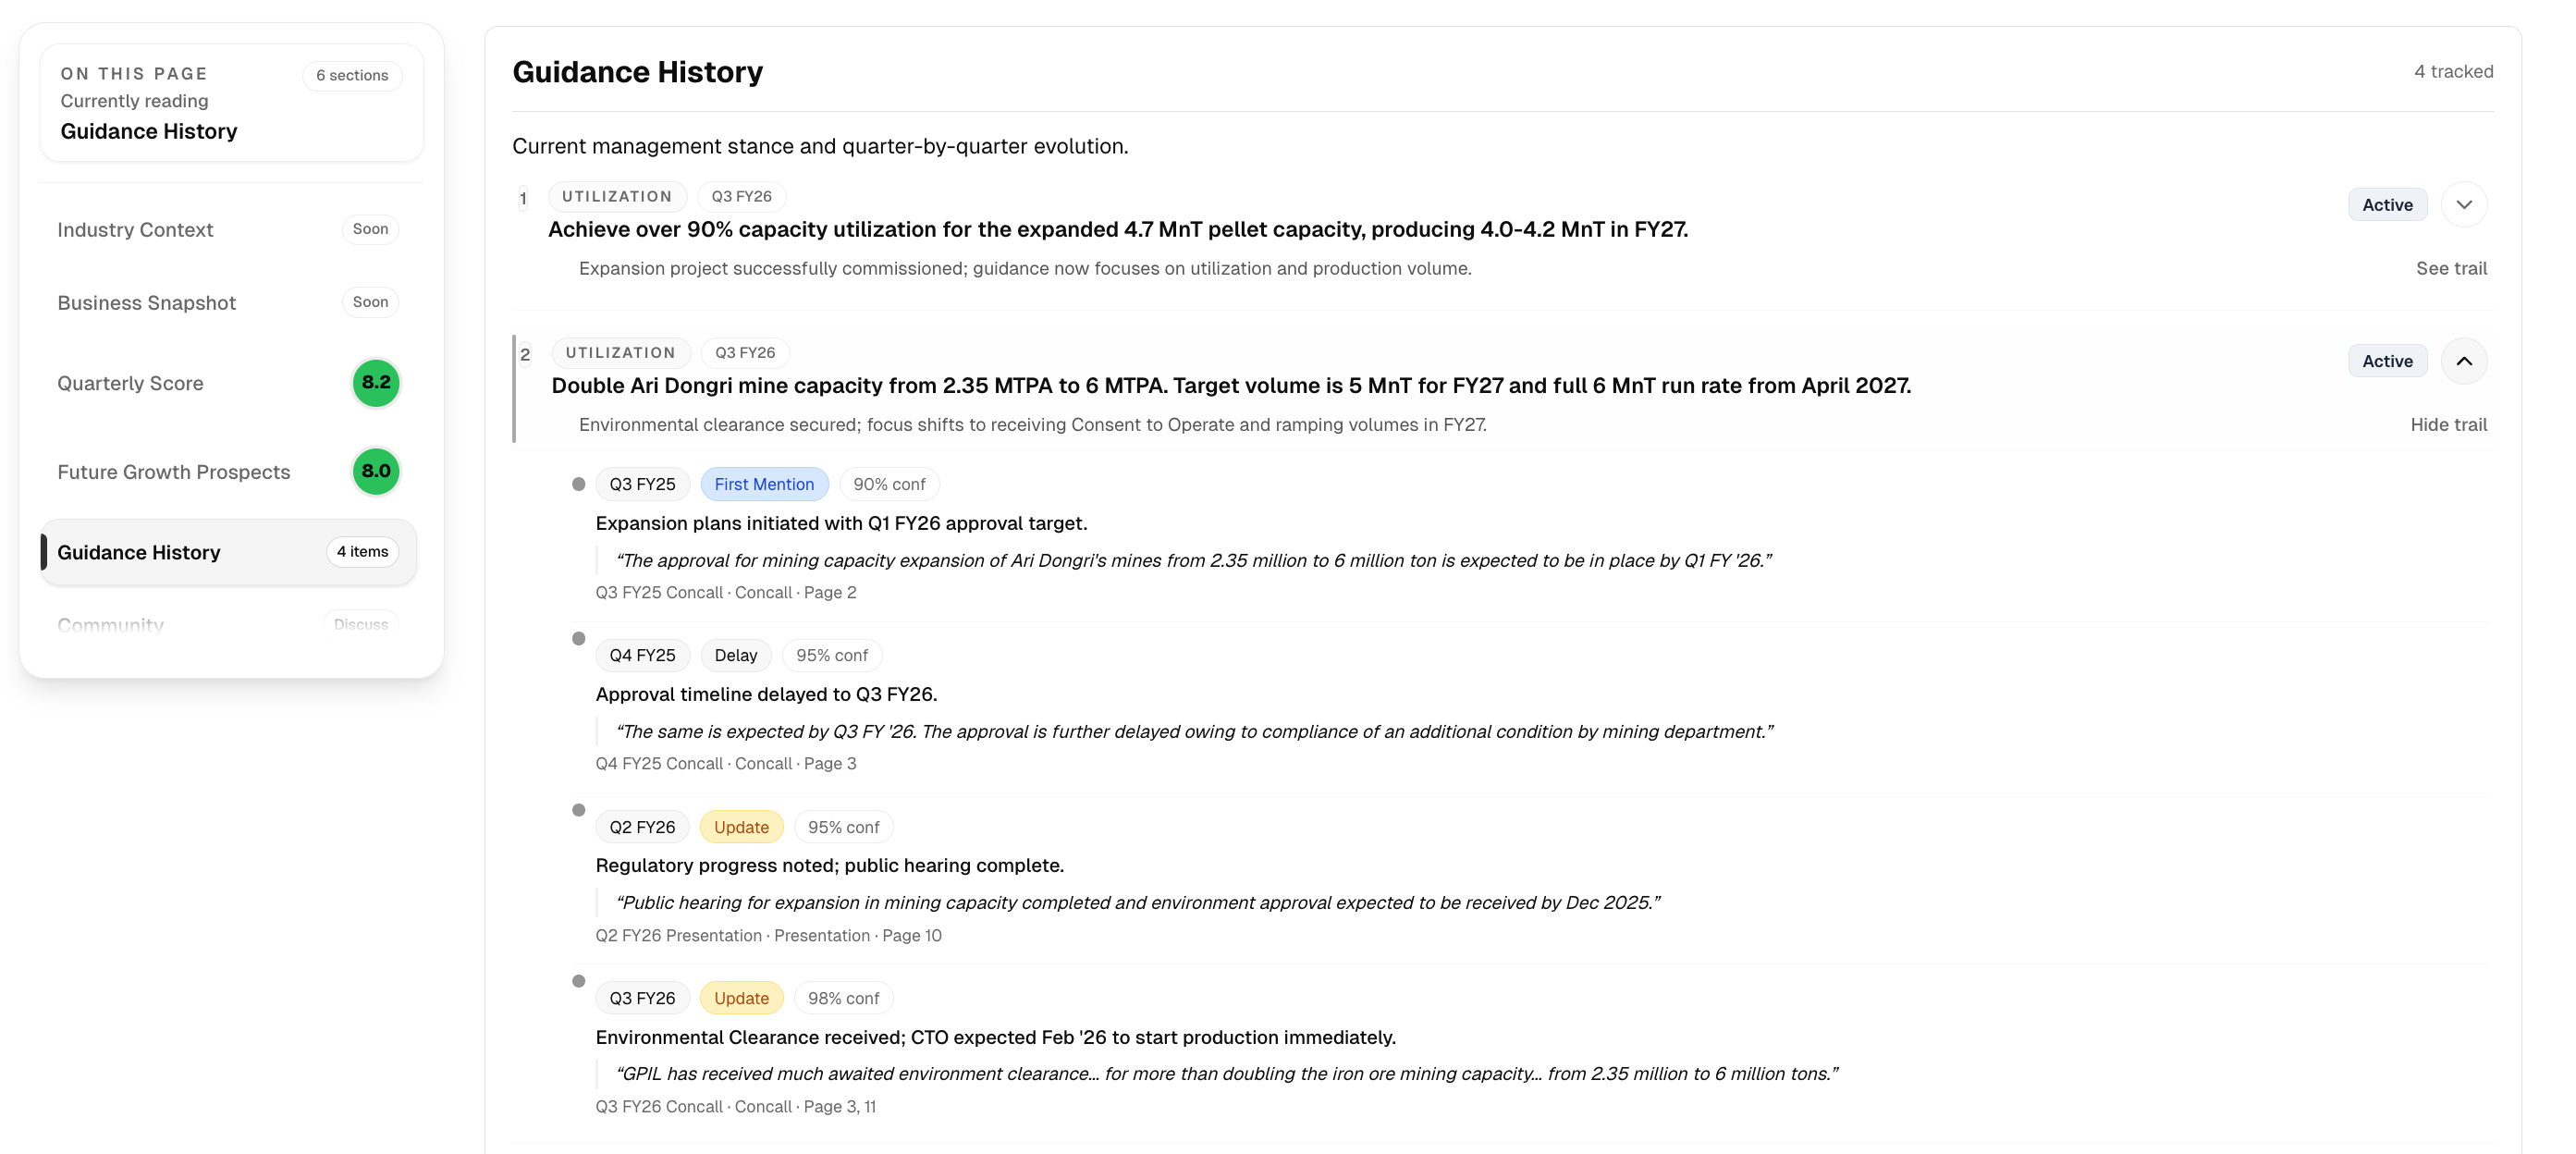
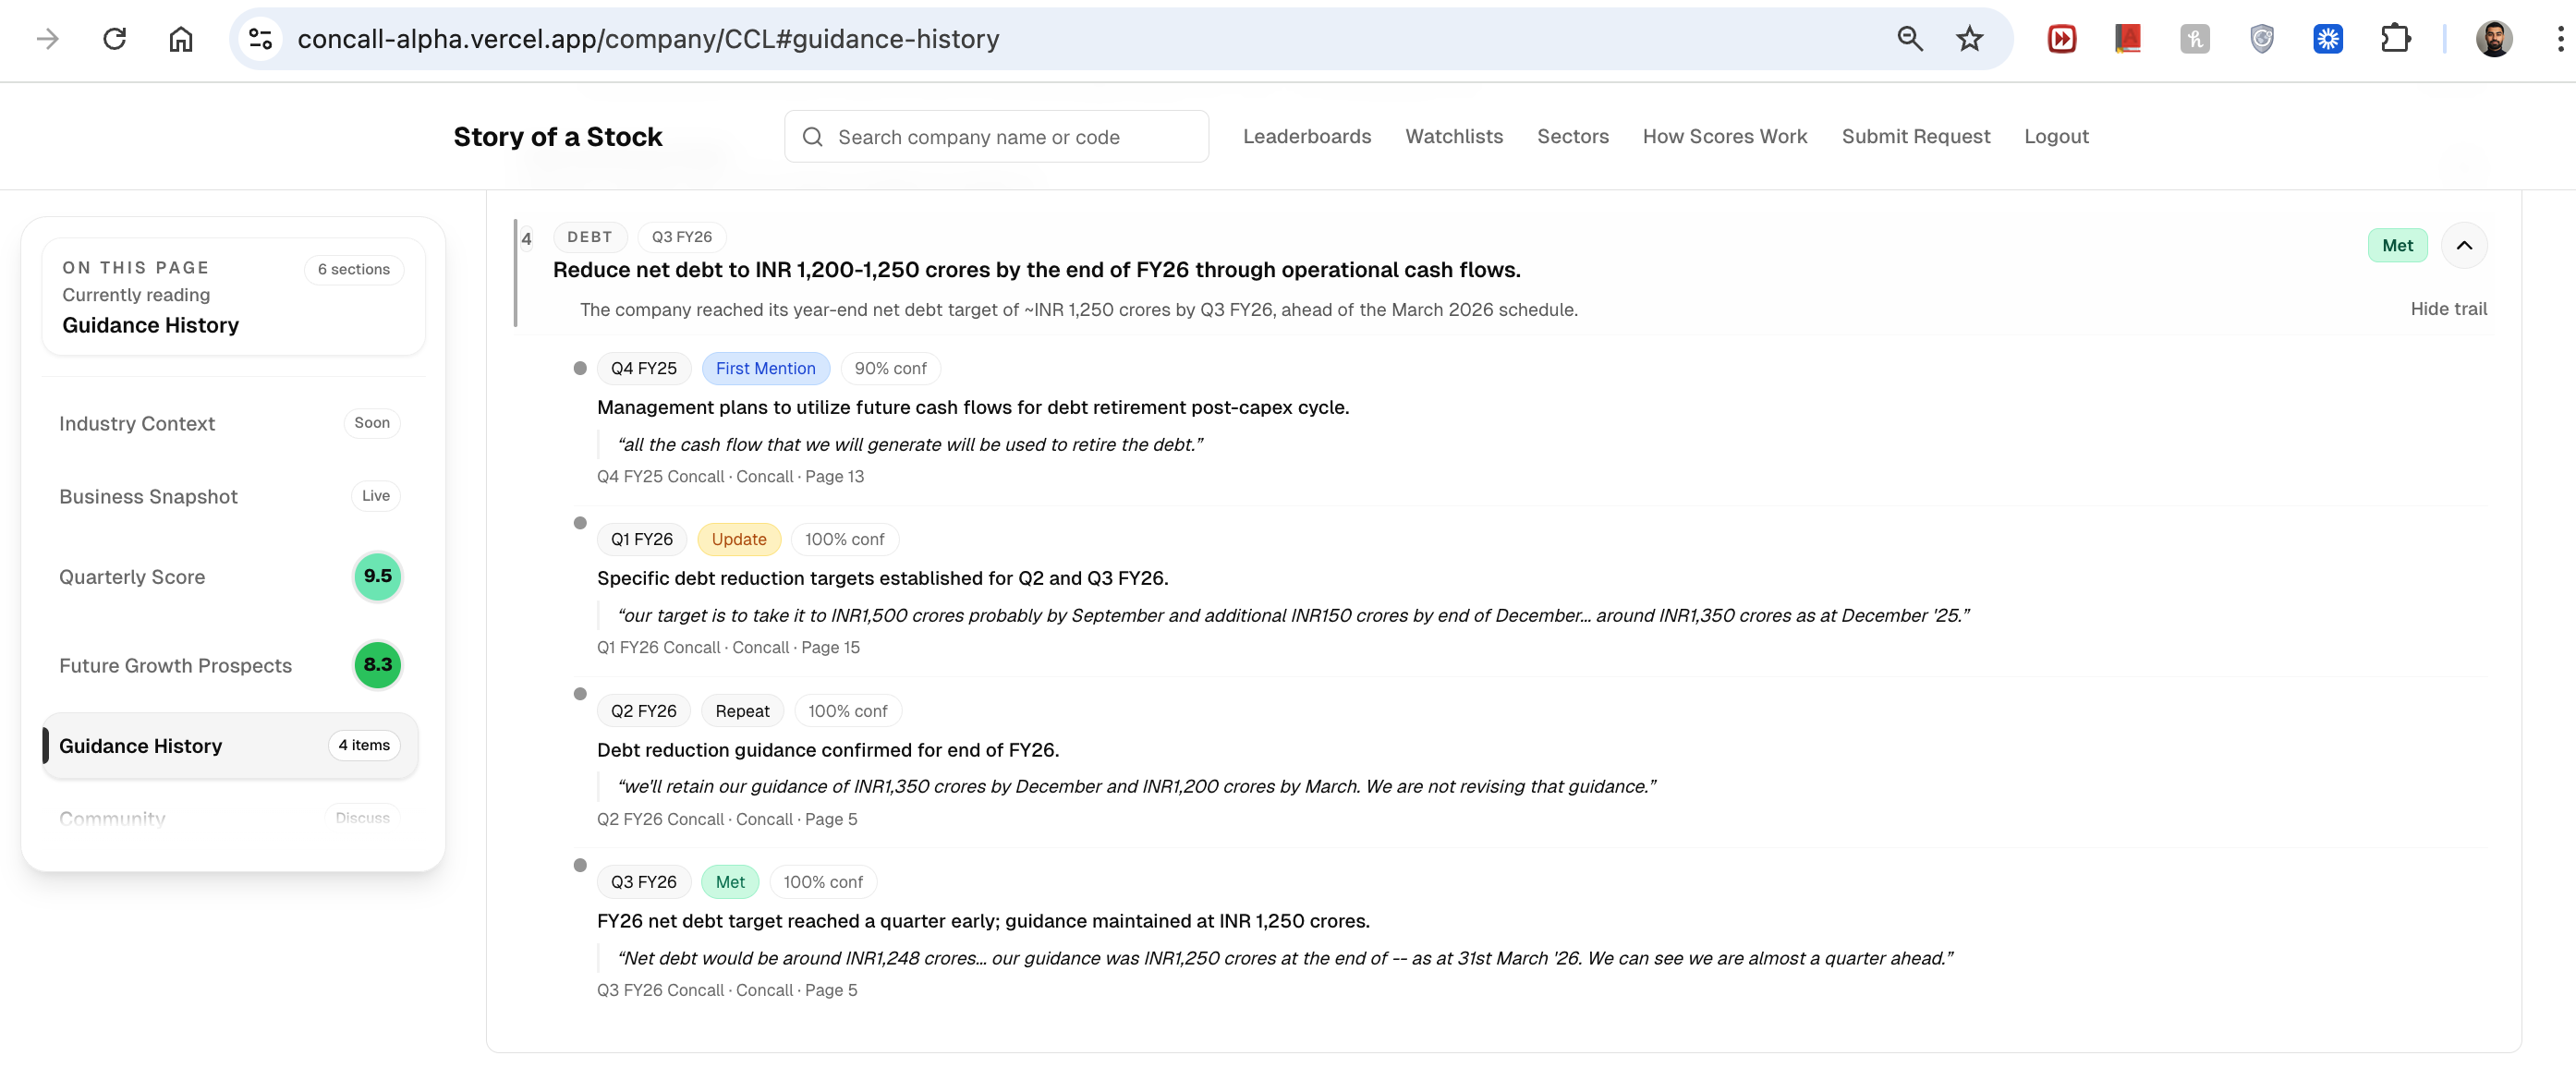
New feature release: Guidance History / Guidance Tracker
This is one of several features shipped over the past week, and honestly I’ve been quite impressed with how useful this has already been on the companies updated so far.
The idea is simple: instead of just reading the latest concall or PPT in isolation, you can now track management guidance across quarters — across things like revenue, margins, capex, utilization, commissioning timelines, debt reduction, etc. — and see whether guidance was maintained, delayed, revised, or met.
A good example is GPIL. Over the last 5 quarters, you can clearly see how the mining capacity guidance first appeared, then got delayed, and then saw two major updates in the latest quarters.
Added a new layer to the portal: Tracking Key Variables.
The idea is to track the few operating variables that actually explain whether the business is moving in the right direction — not just whether the reported quarter looked good.
For example, on Tata Consumer, one useful variable is growth businesses as a % of India business.
in Q4 FY24, management indicated it was moving toward 30% of India business growing at 30%
by Q3 FY26, growth businesses had reached 30% of India business
management also said this milestone was achieved ahead of timeline
Lots of additions but the biggest value add I’m feeling is from the MOAT assessment.
Moat Analysis — Coverage Snapshot
We’ve now analyzed 52 companies through the moat framework.
Distribution:
Wide Moat — 7 (13%)
Narrow Moat — 40 (77%)
6 Strong-narrow, 26 Mid-narrow, 8 Weak-narrow
No Moat — 5 (10%)
The 7 Wide Moat companies:
TCS — IT Services
Bharat Electronics (BEL) — Defence Electronics
Adani Ports — Port Operations & Logistics
MCX — Commodity Exchange
Max Healthcare — Tertiary Hospitals
Narayana Hrudayalaya — Multi-Specialty Hospitals
Navin Fluorine — Specialty Chemicals
The analysis is based on Pat Dorsey explanations in the book - The Little Book that builds Wealth. We look at 4 moat sources, identify strength and durability of each and test the thesis against historical returns to come up with the final value.
Would help anyone wanting to own quality businesses. I have only 1 No Moat company in my portfolio watchlist, but 4 wide moats - good hit rate :)