Motilal Oswal uses a proprietary payback ratio to identify potential multi-baggers, and is defined as current market cap divided by estimated profits over the next five years. Stocks which have payback ratio less than 1, are more likely to be multi-baggers.
Has anyone backtested this or used for stock selection. Do they use PBT or PAT for this ratio?
4 Likes
How can you possibly estimate profits 5 years into the future? Even if you say you could, its highly unlikely because you would need to practically be an expert in every field to even get an inkling. Usually even businessmen can’t with full surety tell you how a business might perform in the future. And market cap is subject to market volatility, I’m surprised your even looking at something like this.
1 Like
Let us assume profits remain the same over the next five years… That means, PE multiple of 5, will ensure a multi bagger?? This is just another way of reading the PE ratio, with a growth factor added. Nothing really new or proprietary according to me.
3 Likes
This is a good ratio. It is simple yet effective way to gauge valuation of a stock and find potential winners. It is forward looking, takes into account current earnings, current value and expected growth. All the important variables in finding future winners.
Thanks for sharing.
1 Like
I would say PAT is more appropriate as this represents cash that is left to be distributed to shareholders. But good luck finding stocks with a ratio of less than 1. Even a stock at reasonable PE of 15 and earnings growth of 30% will not have ratio less than 1.
2 Likes
Market cap should be Rs225Crs on a PAT of Rs15crs. So like I said the ratio will be 1.5 which is more than 1.
Right, my bad. Ratio will be 1.28 not 0.57.
Maybe potential candidates could be turn around stories or cyclical stocks at the bottom of the cycle. Will be very interesting to see what kind of stocks could qualify this test. Such stocks will offer good margin of safety. Can anyone run a screener and post stocks which qualify this test?
Excellent read. This ratio also helps in identifying and ignoring overheated stocks and go after stocks which did not participate in the recent rally.
Sounds simple. PE of less than 10, P/B of less than 1, P/S of less than 1 and payout ratio of less than 1! It would be of great help to all if other boarders could share some stocks that they know which qualify this criteria.
Rural Electrification Corporation LTD is one such stock !
Not exactly matching, but IRB and Vedanta gets close too.
If you are taking current market cap and future profits (PAT) then it’s not comparable…one should take present values of future profits in the ratio…
Or even better if you take FREE CASH FLOW in place of PAT…
So it is similar to DCF Method…
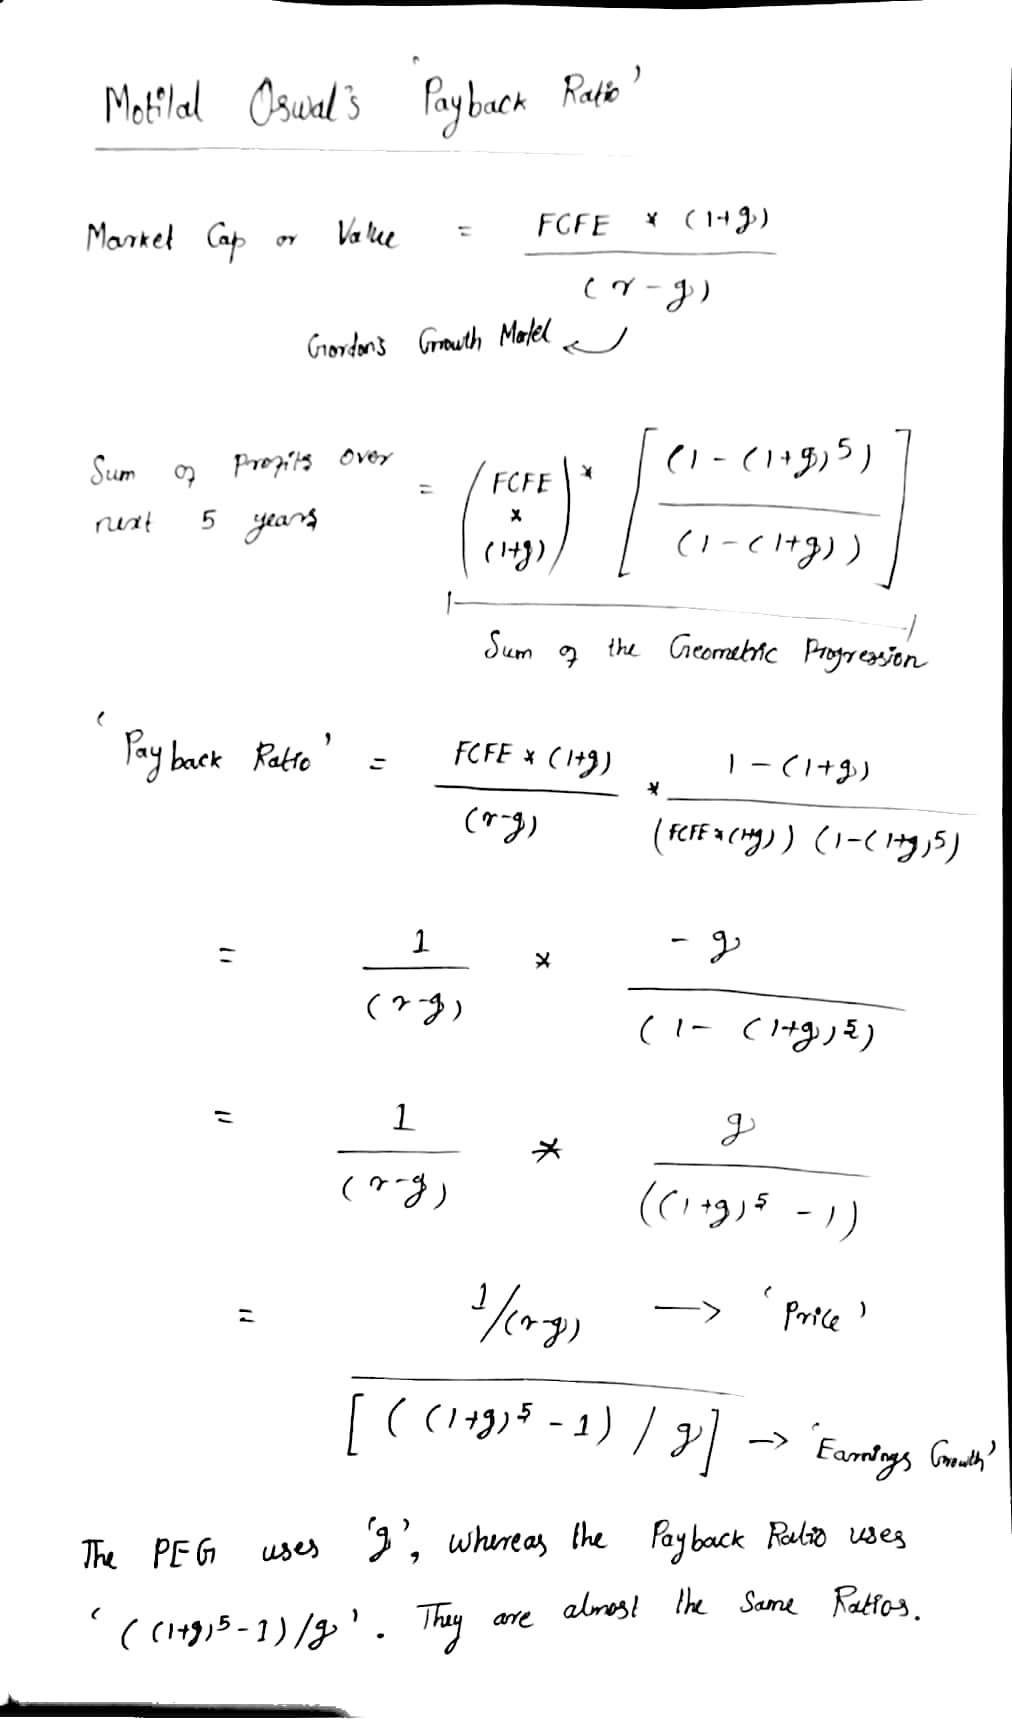
This is an approximate breakdown of the ‘Payback Ratio’ (Again, approximate, not accurate):
So, really the “Payback Ratio” is just another fancy variant of the simpler PEG Ratio, propounded by Peter Lynch. Even the PEG uses Accounting Profits, which is not correct. Accounting Profits can vary wildly from Free Cash Flows.
I personally use the EV/EBITDA or the Price/Owner’s Earnings multiple to filter for stocks, because these are comparable across industries. Even then, nothing is definitive. The only question that matters is the question of Value. And Value does not confound itself to just 1 or 2 parameters.
1 Like
On a side note, Motilal Oswal mutual fund returns have been quite mediocre esp for a fund house that claims big in equities. The four MFs that they have in the market, the 3 year CAGR returns are 10.6%, 10.7%, 17.5%, 20.35% respectively.
I think 17.5% and 20% are very good. What is the theme of 10% yield. It could be large caps or dividend yield with lower risk which would explain lower return
@SlownSteady not really. one of them is the midcap 30 fund and other is focused 25 fund. neither pays dividends.