Path of a "Phenomenal Speculator"

Hi All,

Initiating a thread to mark an individual’s transition from:
a. spray and pray method ( later most fall prey) or shall I say buy on rumour sell on news method to buy in pyramiding style?
b. go beyond reading broker reports and see how the footprints of Biggies when followed results in huge gains
c. Marking once move in to buy value , sell on hysteria. Fascinating isnt it?

About me:
I am a novice in investing but have accepted the truth that the oft repeated “buy and hold” dictum just doesn/t work. Always.
Even when you have blue chips…
Consider the following:

  1. Cisco-the market darling of US tech stocks. went no where from 2000-2016!!
  2. HUL-Indian FMCG major. Consider its non-cooperation from 1999-2009 period.
  3. AIG fell from 103 USD in the peak of 2007 to a few CENTS in sub-prime crisis…

What keeps our investment ticking?
As mentor said clearly and so simply, most of us here on VP have not seen a true bear run where blood is on the street… So no death by 1000 cuts due to a well diversified portfolio

Besides, consider another thought: For every Bull to bear run transition where a % of investors swear never to return to the market…A fresh breed of investors AKA fresh passouts emerge out as new roosters… Kudos to young India…

Are we really investing?

Those who think they are investing are speculating. Those who think they are speculating are actually gambling…

In a simple but useful book by Jim Paul titled- What i learned losing a million dollars?"

Strongly recommended to read to understand how an “Individual” investor invests and behave like a crowd. Consider, sitting on a terminal with very limited exposure to mass how we are vulnerable to mass thinking!!

How did I stumbled upon speculating?

I am a children of subprime crises. As a timely pass out from a better business school and
coming from a typical 300 Million strong classic Indian middle class, my exposure and awareness to market then was ZERO!

I saw markets crashing in 2008 eating food in the canteen and was just unaffected.

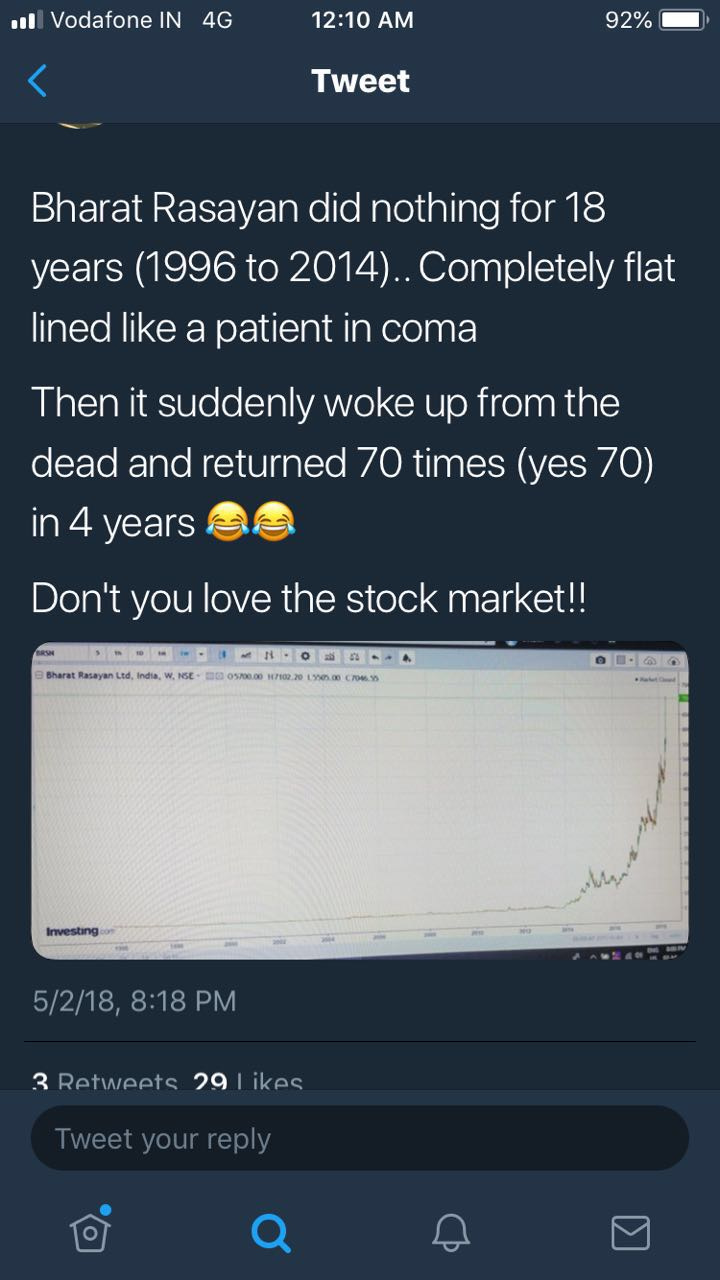
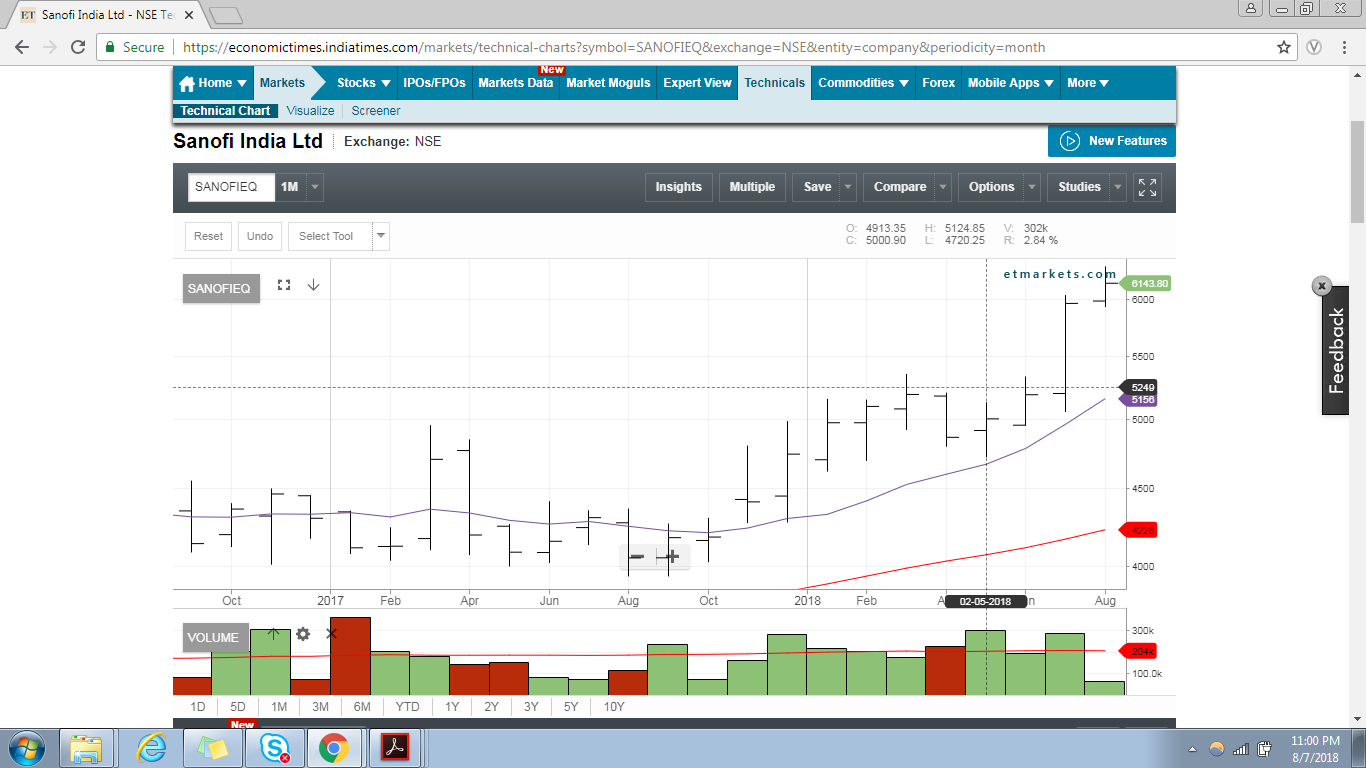
The investor in me says now,I should have bought an MRF for 3500. Look its 70000 now, your investment in grocery’s amount of 2008 could have turned into your starting salary in 2017!!!

The speculator in me ask, hey should I bet on horses (Read HDFC group, Murugappa group, Centuryply, Sundarams, and offcourse RPG)

Or should i bet on jockeys? Consider the solid run by Shree cement, Uniply, inimitable Maithan and now an Everest industry promising to eradicate poverty of fresh investors…

Then comes pure gambling thought train too. Am sure many have considered cloning. This was endorsed by a great cloner Mohnish Pabrai ji.
Once we consider the legend, RJ and his fan website-http://rakesh-jhunjhunwala.in. where you come across a great Vijay Kedia, Ashish Kacholiya and not to forget Dolly Khanna Ji making 4x,5x in a small or mid cap in an year and wonder if copying (gambling) will make you sit next to them (philosophically).

But does closing AKA (gambling) really works? My belief is cloning (Gambling) is an art too…
Although like dolly the sheep-clear and successful cloning took years. My fav childhood teacher once said NAKAL+ AKAL=SAFAL.

Cloning fails cause we know when these big guys enter but with a lag… Further, only following the share holding pattern which publishes once a quarter, we came to know of exits either late or sometimes we miss since shareholding by these people above 1% only gets reported.

Lastly, mathematically innumeracy is the only innumeracy, we are proud to showcase. Hence the clear cut need of record keeping… Makes my journey as a speculator-difficult.

Lets again take a dig at this term speculating… which actually means, viewing from a vantage position… so, no guesswork but reach a vantage position to act.

And I asked my mentor-whats a vantage position?

well, its not just a position…

P.S. more to add soon…

4 Likes

“Buy and hold” is a risk management paradigm, in which you are willing to risk 100% of your position. It does not prohibit speculation, rather it can be used in tandem with speculation. A good trader needs both, an edge in speculation and a sound risk management strategy.

PS: I am not recommending “Buy and hold”, as I don’t follow the same.

Finally someone is talking sense . The holy grail of being successful in speculation is RISK MANAGEMENT . Strategy is over rated and its relevance in success is just 10% , 90% is risk management …which in simple terms means how much capital you are willing to risk in any single particular trade factoring in a worst case scenario of stock or index movement on a overnight basis .

1 Like

Continuing from the last thread…

I asked my mentor-whats a vantage position?

Mentor: well, its not just a position…its the way of looking at how to leap and attack and when to hold but the key is when to FOLD?

And confusion initiates. He is further hinting at two crucial angles:

  1. Money management and position sizing–> Expectancy and accuracy
  2. Risk Management…

I will attempt at these thoughts soon.

For now a short sweet story will help set the context on the vantage position.

John Bernoulli, published in June 1696 a challenging problem, which he addressed "to acutest mathematicians of the world’’

`To find the curve connecting two points, at different heights and not on the same vertical line, along which a body acted upon only by gravity will fall in the shortest time’.

On 29th of January 1697 the challenge was received by Issac Newton from France and on the next day (according to his nephew’s memoirs) he sent to Montague, who was then President of the Royal society, his solution. The only other solutions were sent by Leibniz and l’Hôpital.
https://www.math.purdue.edu/~eremenko/bernoulli.html

On receiving the solution, Bernoulli exclaimed! “I have identified the tiger by his claws”

2 Likes

Coming back with few thoughts on money management and position sizing

Think of holding 100 rs. and a stop loss of 1%. Now, market needs to throw you out atleast 100 times to ensure you are bankrupt. lets see it in detail…

capital 100 rs. position size=capital/Risk%*stoploss
If my stop loss is 5 %,

my position size will be-100/1*5
=10

1 Like

On 2nd may, a master speculator MarK Minervini conducted a webinar with another US Investing champion David Ryan on the topic-How to Spot Leading Stocks Coming Out of a Correction?

Here are my notes.

Key lessons:
Bad start-Looking for market -->Group–>stock to invest-More mistakes,
Good start-Look for stock–>Group–>Market-Lesser errors.
key is to make small losses. Inevitable they are.

Reasons?

  1. Every bull run throws new leaders and make public forget the previous bull run leaders because the last lot will lose its shine.ex-Avanti in current run up, TTK prestige in previous one! We will forget avanti before the next bull run!! like we forget symphony.
  2. Leaders usually bottom out little before overall market bottoms out.
  3. Leaders run up even before the broader market recovers and catch up.

Tips to identify leaders/strong players:
Run utility screens
#1. Relative strength gives a great idea of the stronger stocks people dont wanna exit. say market is correcting for 6 weeks. Run an RS for 6 weeks-MS to identify this. look for RS line hitting new high-first list of stocks, if its a 12 week correction find a 12 week RS screener to find the outperforming ones-those which are in a long term uptrend. Ex- see apple in 2004. I dont want stocks down more than 20% below 52 week High…
#2 Nothing really changes in the market, only the names of the player changes. Those stocks which are going out of stage 1 with a strong and long period of consolidation matters
#3 if I came across a stock on an uptrend-and it clears my fundamental screener also, i wouldnt wait for market to catch up. I prefer to end before its pivot assuming its forming a base and volume is down to needle. Good earning report will allow retail investors to catch up.
#4 Look for low risk entry points and then manage the risk-Pivot is the name but is perceived differently for each one of us. No clear definition. Once convinced of an uptrend-entry before pivot reduces error margin. Risk is high volume up-a higher volume down…

Some thoughts on Market direction:
1 Do note that a rising GDP and a flourishing economy has no correlation with a rising market. Market runs faster on signals then on manifestation/acknowledgement of faster growth rates.
2. Current market trend can be compared with era before 1987 big crash. However-its expected to be range bound for some more time.
3. when the market is choppy-keep checking for stocks forming base and evaluate their fundamental screeners and create a watch list.
4. Look for positive moves after a run like pullback consolidation etc if the market corrects, their is another opportunity to enter again.

Last few topics:
Stops: marks changes stop very frequently.
Take small positions to test water
Never hold till earnings unless sitting on profits.

4 Likes

My next note begins with self slapping-I started shorting market losers and bled badly!! :frowning:
However, learnt to console self with two concepts-

  1. Financial capital-AKA net worth. lost a good % of it.
  2. Human capital-AKA Ability to generate wealth for longer period. Saving grace.

What I am planning to recover the shorting loss? Discipline. How?
Hence forth-the pithy appraisal that comes should be aimed for SIPs in Bajaj Finance, HDFC Bank and Britannia on annual basis. My inspiration is again the great Jesse Livermore who wanted to save his family from himself. Offcourse I will plan for checks not to take his route.

Is your first question-Why these three companies are chosen for parking salary hikes? Kindly wait.

Next what I wanted to share are two things. which again are the foundation of 3 milestones I want ti achieve.

First is a revealation after speaking to mentor (GOD for me). Revealation is mine :slight_smile: but mentor has confirmed it so no more doubts.

Indian promoters are very talented. So talented that they can make a mockery of every accounting standard, investment principles, money making opportunities like demerger/merger, split, rights bonus etc.
Case in point- Omkar Lasa demerger 180- to combined entity value of 65 now, , Can fin splits and rights. Dont even want to comment on the drastic falls. Please check for yourself.

Second finding is the alarming difference between informed buying/selling vs being the crowd… Look at how well informed ,smart,calculating and if I can say great decision making this limited group is and how they chipkaowed these GEMS to retailers. Let me give more examples-does rain industries sound the bell? Capital first -IDFC merger-974 combined value to 629 now… Does Avant from 2850 to 1400 appeals to the above?

What appeared to me is a set of lessons. Please bear with me for the next few minutes.
Lesson#1. Informed buying and selling is way different from retail buying.
Lesson#2. There is always an imbalance in buying and selling to realize/gauze if a stock is going to move up or down.

Lets pause and think on what is informed buying and selling and how is it different from me?

Lastly, had a discussion with my small beloved group of friends who rile and question me. I convinced them finally on 3 Milestones of investment life.

  1. Total clarity on money management. Money Management and MONEY MANAGEMENT. To know how much pain (loss) can I bear, how much can I stand before one brakes down. becomes rash and rude and cry is of paramount important. Besides, this gives lifetimes clarity on position sizing and stoploss levels. (remember the title of this thread).
    Guiding principle-
    There are two primacy says we make money trading, catching a big price move with a small
    position or having a large position and catching a small move.
    -Bill Meehan

Effort Needed: TO be UPDATED

  1. Speculative income generated based on How I/we identify trending sector and trending stocks. In other words what is the market direction.
    Rule I was taught by a 22 year old swashbuckling trader (offcourse a Gurjati charm) is this-look for 50% market 30 % sector 20% company. Did you notice this run up in midcap IT companies? Noticed even a Sonata had a run up… Here is a live example I need to validate. Please do your homework-Pharma sector is warming up now. There are tools to validate. i will come to that soon.

Effort Needed:
large-range up close days usually open close to the low and close on
the high. Large-range down close days open around the high of the day and close near the low.

1. Don’t try to buy big dips below the open on expected up close days.
** 2. If long and prices fall much below the open on expected big up close days, “get out.”**
** 3. Don’t try to sell big rallies above the opening on expected large down days.**
** 4. If short and prices rally much above opening on expected large down days, “get out.”**

  1. The dream position is to park the profit managed by money management milestone andspeculative income (source of speculative income is offcourse salary-20% of money max) in where? Constant compounders-AKA Dull Boring Shameless companies which are less likely to give me sleepless nights. Remember again what happened in canfin, marksans, Ricoh India Capital first- I have a list of self sabotages…

Effort Needed:

my rules:

  1. Don’t try to buy big dips below the open on expected up close days.
  2. If long and prices fall much below the open on expected big up close days, “get out.”
  3. Don’t try to sell big rallies above the opening on expected large down days.
  4. If short and prices rally much above opening on expected large down days, “get out.”

Markets bottom with price closing on the low of the daily range, while they top out when closes are at or near the high of the daily range.

The uninformed think “smart money” comes into the market with buying thus reversing the trend.
Nothing could be further from the truth. As MY long-time friend Tom DeMark says, “Markets don’t
bottom because of an influx of buyers, they bottom because there are no more sellers.”

that sellers in any time period are represented
by the price swing from the high of the day to the close, while buying is represented by the close -low.
distance price closes off the low tells us the power of the buyers, the
distance from the high to the close illustrates the impact sellers had on prices

  1. Most all market highs can be found to occur at or shortly after a market closes right on the
    high of the day.
  2. Most all market lows can be found at or shortly after a market closes right on the low of the
    day
    The closer the daily close is to the high of a bar, especially if there are several such bars together, the closer we are to a market high.
    Market lows, in all time frames are just the reverse: the closer the closes of the bars are to the low then the closer we are to a market upturn. This is market reality; this is how the world of speculation works, always has, always will.

4 Likes

Could you please write in detail on this. There are companies which are perceived growth+compounders (names that u mentioned), however then with sudden change in mkt environment and they fall from glory. What do u do in such situations.

Hello Sarabjeet,

Loved the question and I am sure you will love the answer now.
Here are few things to consider first:

  1. Over sold vs over bought-
    Look at a typical bar chart. You will see 4 things. open (LHS) High (RHS) LOW (RHS) Close (RHS).

Buyers are strong if the gap between high and close is less. thats buying pressue to lift the price.
Sellers are strong if the gap between low and close is less. thats selling pressue pulling the price down.

Shall add more details if needed. Learning this as its the key.

  1. Accumulation vs distribution-Accumulation is marked by informed buyers buying in big chunks and their inability to hide the footprints. at times research firms too join this trickery. See last year end’s MOSL report on DMART being costly and them cornering the stocks. Where do these large firms get where to enter and how can we join them? Hint-Remember Columbus and his crew-Next post…

So whats a distribution? Imagine a JPMC/Pabrai losing faith in Rain or Warbur Pincus hating Capital first or can Fin? what will they do ? Build promising stories to entice the retailers , huge seminars to attract large retail buyers -affect crowd mindset and then chipkaofy the rut and wash their hands slow.
See can fin fall from 650 to 320 after housing boom story, ditto for PNBHF from 1700 to 1000 now. Remember RamDeo Agar se PNBHF is a 100000 crore ki kahani headlines? what happened to followers?

Can fin even announced a rights issue last year… No effect. my take-after long distribution usually story gets over. A guess if I may take-Avanti feeds story is over… Open to argument. but mentor showed its story done @ 2800.

long distribution examples coming in the same post.

  1. Informed buying vs rush of FOMO…Informed buyers have access to differential disclosures ahead of us poor retailers who just rush for the tip from doctors barbers (pun intended)…

Retailers and informed buyers mostly differ in crown psychology and behaviour.

I have seen small retailers working and emulating like informed buyers in accumulation too. Heres a question ? What happens if large informed buyers make a mistake? Rain for example? or if they see a problem developing later? Again they are strong smart and shrewed enough to either right the wrong and pull the price OR they will chipkaofy the mistake to retailers who were left licking their wounds and waiting.

Now some examples: Whats wrong with Capital first ,Ricoh Rain etc. see the long periods of distribution where prices were closely range bounded and retailers were lured -its CHEAP-come take it!!! see the periods , price range and low volume combined story -confirmed distribution. rest is only our wounds and us regretting why cheap was costly!!

Feb to may for capital first


See sep end to december end 2016

see feb to april 2018…

6 Likes

Shriram transport fall by 13% today. thats attrubuted to corporate governance!! Lets dissect it-
Corporate governance-for such an old group where the great Ajay Piramal had invested?? is there truth lying some where else? Cant we be vigilant and see this in advance and save our selves? Answer is yes. Will I apply it next time. I hope yes!

SO what happened?
see the STFC chart from week of 10th may to 22nd june. What do you see? tight ranged prices, minimal volume below 50 DMA and hardly any big price correction. What do we infer-Again the power of informed buyers and sellers. Look how beautifully in this period they sensed or should I say used their powers of differential disclosures and wash their hands by chipkaofying. For diggers, please refer to the MMB messages and reports saying how investment worthy it is in recent period.

In Last 30 days, hope you all have learnt many lessons. I was made to realize these by mentor.

Nothing is working
_ Short it, get trapped. Strides, UPL,
_ Go long market spins u.
_ Chase value and it crashes 70%
_ Growth guys are clueless_-Avanti Feeds :slight_smile:
_ Choppiness at highest Divergence_
Result–>All sorts of confusion

one lesson learnt-being too greedy in choppy market makes one regret-scalping-taking a bite and running away is the key!!-

Now some food for our eyes. Mentor asked to create a separate document for
a. quality of base- detailed reason with why like contraction, accumulation pattern, time, shake outs etc
b. quality of prior consolidation- same parameters
c. entry strategy- buying on day 1 breakout, day 2 or subsequent, Study historically what would happen with late entry. See what other possibilities are there in chart. Like gap up opening, early morning high volume etc.
d. Pivot- put your own hat were lesser number of trapped buyers exist. Triangulate with chart, volume, fundamentals, any other news.

Companies to Add:

Everest
Orient Electric-New stock
Eveready
Marico
ITC
Astral
GOdrej consumer
Maithan
HDFC Bank
Bajaj FInance
India toners
Karur
Bharat Rasayan

I will come with rationale for entry and perhaps exit for each of these.

let me invert and begin with the last one first.
See this message below on Bharat Rasayan:

Let us dissect Bharat Rasayan now?

Before we begin, lets recall one lesson from Great Larry Williams-
Speculation is a thinking business. If you are not good at thinking, or at least at getting correct answers, I suggest that you look for the off ramps.-

What all shall I triangulate?

  1. Stage analysis-Basically what stage the company is in? Price volume and time continuum!

  2. Entry of big guys. Do I really need to know which ones entered? Let us see.

  3. Float and Results. We will also see if float really matters?

  4. Stage analysis: Most critical part in stock selection actually. Over valued, under valued, falling knife everything can be understood from here. Lets see how?

See Bharat Rasayan on ET charts again. Consider price volume and time movement.
Stage 2 definition and time to consider -First Stage 2 session started March 2014 onwards

  1. 150 DMA blue line is above 200 DMA purple line. Check #1
  2. Rising 50 DMA. Red line .Check #2.
    3 Rising volume. Check#3. Problem is very low float to watch it clearly.

We get another stage 2 here-watch the time between 18th may 2015 to 8th august 2016. 14 months of long consolidation in same base. Did you notice the volume and price jump after that?

see another chart for monthly price moves now. # of positive months dominates the negative months. Clear uptrend.

  1. Entry of big guys. Here I see an issue? Float is so low. Any how do take a look at the highs and green in volume. BTW did you guys notice that there was hardly any selling ever?


3. Float and Results- 10 Lakh float- Do you know in a rare case of a JPMC or CLSA entering it what will happen?
Market Capitalization-INR 3,121.23 Cr
Sales- INR 795.31 Cr
Shares in Float-10.62 L ONLY.
Date EPS %Chg Sales(Cr) %Chg
Mar-18 83.60 +193% 193.4 +51%
Dec-17 54.35 +106% 188.7 +43%
Sep-17 56.68 +45% 244.1 +26%
Jun-17 36.83 +8% 169.2 +1%
Mar-17 28.57 +146% 128.0 +29%
Dec-16 26.36 +75% 131.9 +35%
Sep-16 39.02 +16% 193.9 +35%
**Jun-16 34.18 +76% 166.9 +45% **
**Mar-16 11.63 -11% 99.3 +4% **
**Dec-15 15.09 +34% 97.5 +4% **
Sep-15 33.66 +24% 143.8 +9%
Jun-15 19.37 -16% 114.9 -2%
Mar-15 13.06 +92% 95.5 +8%
Dec-14 11.30 -18% 93.7 +4%
Sep-14 27.23 +28% 131.9 +22%
Jun-14 23.14 117.7
Mar-14 6.80 88.6
Dec-13 13.86 90.2
Sep-13 21.32 108.0

Closing this exercise for Bharat Rasayan with answers to Mentor’s Questions:

a. quality of base- detailed reason with why like contraction, accumulation pattern, time, shake outs etc
Look at the beauty of this stock. it never came below 50 DMA. Between 17th july to 6th november it was range bound with very low volume and very tight gap between open and close for preceding 6 week. shake outs happened on 15th and 29th Jan but with volumes comparable to 50 DMA. Hence a positive sign.
b. quality of prior consolidation- Look at two periods 1. 10th july to 13th Nov and 8th Jan to 16th april. in both cases towards the end of consolidation check is are the ranges very close (less gap between open and close-YES). Good quality. Also check if the volume is thin comparable to a needle towards the end of base? If yes. time to enter are dates like 13th Nov , 16th april etc.
c. entry strategy- buying on day 1 breakout, day 2 or subsequent, Study historically what would happen with late entry. See what other possibilities are there in chart. Like gap up opening, early morning high volume etc. SORRY I am not clear now on this and shall get back with more clarity here. WIP
d. Pivot- Can you put your own hat were lesser number of trapped buyers exist. Triangulate with chart, volume, fundamentals, any other news.
What is a Pivot-Breaking out of base is pivot. Volume and price too should be closely watched.
Last Pivot price is 7100 with 6x 50 DMA volume on 30th april. Hypothetically, as a naive buyer I can say I bought at this high price and I get stuck on this price… I prayed and managed and exit only on 9th july when price passed 7500 with 3X 50 DMA volume!! Worst

4 Likes

Lets us play an exercise of prediction.
While Keynes said in economics -prediction is a waste of time if its about future. Speculations inspires us to attempt and benefit from it.

Remember what Jim Paul said? Be wary of the losses and profits will look after themselves. Hence posing two stocks to see where do I go right. No positions no paper trading purely an exercise for the eyes.

We will also try and dispel the popular myth of how even after good results most stock correct?

Chart #1 Astra Zeneca weekly charts

weekly 5 year charts

Monthly charts:

Interpretations:

  1. not an investment worthy stock. many times go below 50 DMA-Red line. At times even before 50 DMA…
  2. Never forms any constructive base. A good number of times below 50 DMA
  3. Refer monthly charts-8 weeks of consolidation from 2nd feb to 2nd april. And we see a breakout with volume. Stock is up 50% in two months. Up 75 % in 4 months.

Quarterly Earnings (INR) of Astra Zeneca- Noticed lack of consistency?
Date EPS %Chg Sales(Cr) %Chg
Mar-18 1.29 +212% 150.7 +35%
Dec-17 -4.14 -165% 128.5 -14%
Sep-17 10.95 +3432% 164.3 +19%
Jun-17 2.32 -45% 127.5 -9%
Mar-17 -1.15 -623% 111.6 -30%
Dec-16 6.39 +84% 150.3 +4%
Sep-16 0.31 +112% 138.2 +8%
Jun-16 4.23 +288% 139.5 +6%
Verdict-I would avoid it in general conditions.

strong textLets see another MNC pharma stock
Chart #2 Sanofi.

Weekly 5 years chart

2 year monthly chart:

  1. From 26th oct 2016 to 30th october 2017- Such strong consolidation. Price moved no where.
    Can I say, to hell with this buy and hold nonsense? But what happened after that? A 50 % gain in 9 months!! What happened is this: Check on the recent quarterly earnings. See how big guys entered it in volume.
  2. Same story- Can I really buy and hold it? its like an FD. Wont fall wont rise. Then when should I buy or shouldnot ?
  3. Refer two year monthly chart-stock is mostly positive.
  4. Lastly 10 DMA is constantly above 50 DMA for a long period.
  5. Can a fresh entry be made? Let me revert tomorrow.

Quarterly Earnings (INR)Noticed how consistent results are? Even bug guys want stability and peace of mind!!
Date EPS %Chg Sales(Cr) %Chg
Jun-18 43.30 +35% 683.6 +14%
Mar-18 35.87 +37% 617.7 +12%
Dec-17 33.05 +51% 670.4 +13%
Sep-17 50.57 +44% 667.5 +7%
Jun-17 32.04 -14% 600.6 -1%
Mar-17 26.09 -26% 552.9 +2%
Dec-16 21.96 -58% 592.0 +4%

Verdict-

  1. Look for constructive base.
  2. Look for consistent results
  3. Look for consolidation and time.
  4. Look for big guys entry -thumb rule-entry above 50 DMA only.

Happy speculating.

2 Likes

The Difference Between Income and Wealth Source-https://www.getrichslowly.org/income-vs-wealth/?curator=alphaideas&utm_source=alphaideas

Now, I’m not here to explore income equality — that’s a subject for another day — but I want to talk about the difference between income and wealth…and why they’re not the same thing.

First, let’s define our terms.

Income is earning money. Yes, it’s the primary piece of wealth creation, but income itself is not wealth.
Wealth is having money. If you have a lot of money, you are rich. If you don’t have much money, you’re poor.
Income and wealth are related, but it’s a complicated relationship.

hi Annapurna,
i have been using charts of Zerodha but couldnot able to find the RS rankings and RS lines for analysis.
i have also tries searching the same in platforms like moneycontrol and investing.com but with no success.
All i am getting is RSI indicator.

Can you please specify the source from which i can get the RS ranks and line for analysis.
Thanks

@annapurna
Please let me know if you know the data source

Fraud Fraud everywhere-not a hint to give!!

I was reading the all time classic Reminiscence of a stock operator. Mentor told me to read it 10 times.
According to him, reading a book 10 times is better than reading 10 books. I slowly realized the truth in that command.
What I gained in the last few pages of the book stands timeless.
Jessy talked about how insiders are tight lipped when they are accumulating the shares and gung ho about the prospect/appeasing the qualms of public share holders in big correction stating everything is fine OR blaming the shorters and never taking the responsibility!! (While they are slowly distributing it and might have a null position)
See the fall in Muthoot for 11% today and people attributing to Kerala flood for this fall and the CFO’s reply.

it is up to you to trust it. Does the chart shows a different story?


See 30th July onwards. Do you see thin ranged pricing? Negligible volume?
Now please tell me if today is the day to fall? Why? isnt flood their since days now? I see more correction here.

But our case today is not Muthoot but Jet airways. 60 mins back a probe has been ordered for a probable fraud situation in Jet. Auditors in recent past have delayed the results announcement continuously. We can see it falling from 650 to 250. Here’s mentor question? Cant you see this coming?.
I can now and am sure we all can see it. Lets begin

More to add–

Hi Preet,

I am not an expert however RSI when it comes from marketsmith or morning star can be trusted.

thanks aditya,
i also researched and found tradingview.com a good option for relative strength line.
It has the RS tool which can be used along technical analysis