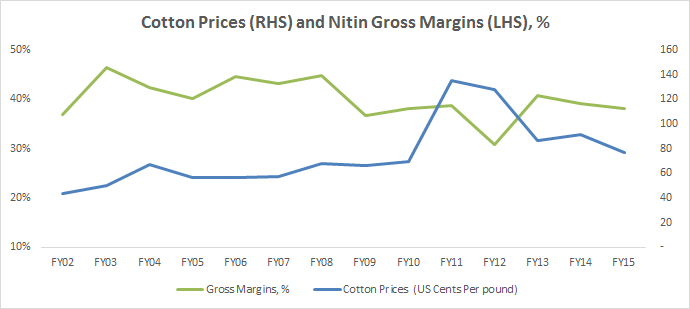
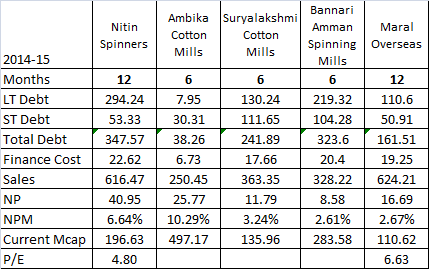
Hi Aveek, Thanks for the revert. I was looking at year end numbers. The margins for FY15 are @ 16.6% v/s 19.6% last year. It is largely driven by power & fuel and RM costs…
Would you point me to something that can give a better understanding of its products- I have read up a few articles on slub yarns - these are coarse yarns and are used in Denims. Don’t know much about its other products…
Last year knitted fabrics contributed 15% of its sales, dont know what is the share this year. Are the margins higher in this segment? Knitted fabrics is like forward integration -but don’t know the economics of this business…
Also why do you think the coarse rage would get priority - anything specific here- is the market for this larger than higher counts category? Will it be margin accretive/dilutive?
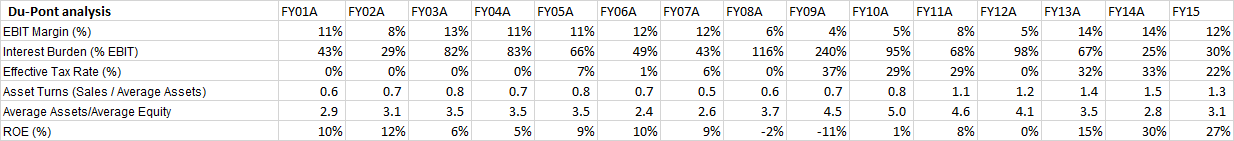
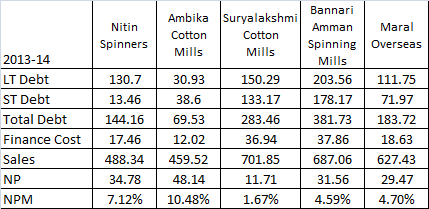
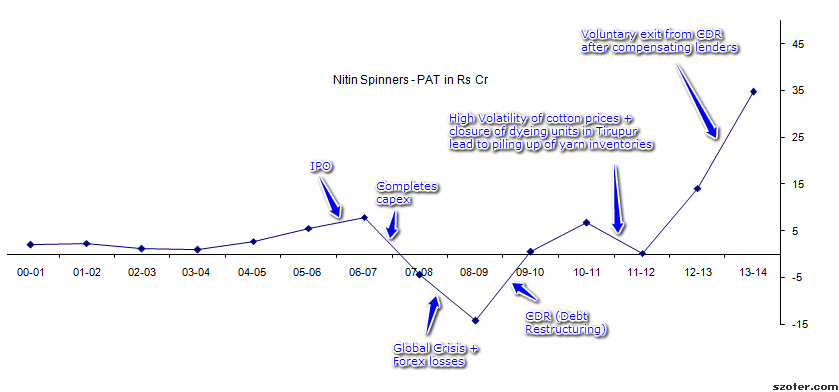
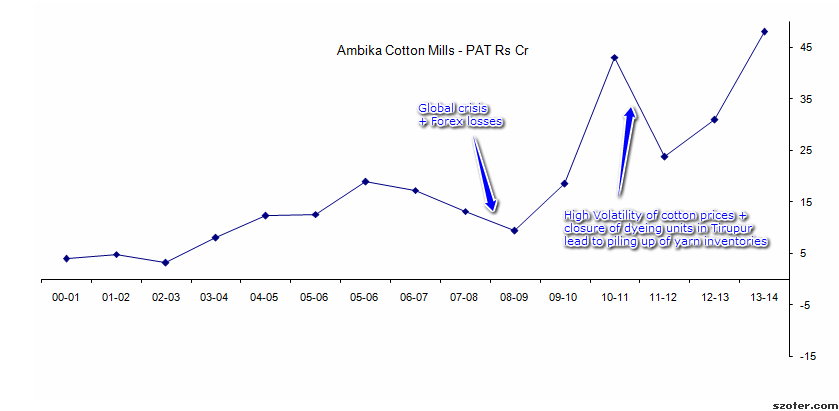
I looked at the last 15 year numbers for Nitin and the margins, barring 2-3 years, have been in the 17-18%. What does it tell me- nothing has changed, so far, for the company which gives it better margins. The numbers are below…
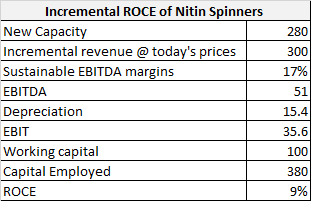
The company has made respectable ROCE only in FY13 & FY14 don’t know if it is sustainable or it was a one off… but prior to that the numbers are not very interesting.
P&L metrics FY01A FY02A FY03A FY04A FY05A FY06A FY07A FY08A FY09A FY10A FY11A FY12A FY13A FY14A FY15
Gross margin 35.3% 36.9% 46.4% 42.4% 40.1% 44.6% 43.1% 44.7% 36.7% 38.1% 38.6% 30.7% 40.8% 39.1% 38.1%
EBITDA margin 16.7% 12.2% 23.1% 20.2% 18.9% 21.7% 19.8% 16.6% 10.2% 11.4% 18.5% 10.6% 19.6% 19.3% 16.6%
Recurring PAT margin 6.3% 5.7% 2.4% 2.0% 3.7% 6.4% 6.3% -1.0% -10.1% 0.3% 1.7% 0.1% 3.3% 7.1% 7.1%
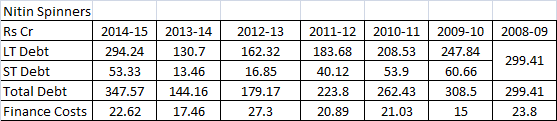
Interest cost as % of sales 4.6% 2.3% 10.4% 8.8% 7.2% 5.8% 5.1% 7.1% 9.1% 5.0% 5.1% 4.9% 9.4% 3.6% 3.7%