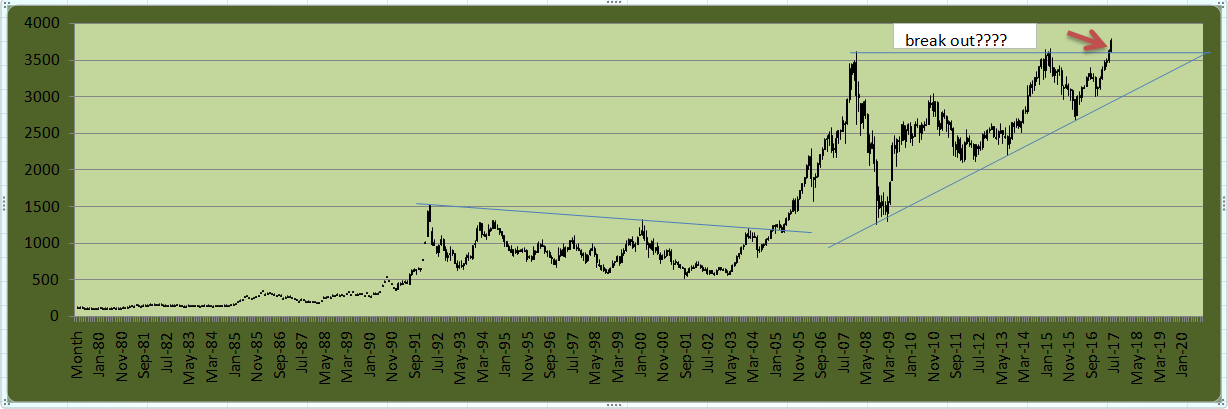
Even if Nifty attaining new life highs, still we are below 2008 highs when nifty is adjusted to inflation. I have compiled a data in which nifty adjusted for inflation is tabulated and presented as a chart.(from 1990 onwards) I used MoM CPI inflation data from the site www.inflation.eu/inflation-rates/india/historic-inflation/cpi-inflation-india to compile the data. On the charts it is facing a resistance line as per March closing data.I didnt included the April data as the MoM inflation data for April 2017 is not available in the above mentioned site. Probably with inflation cooling off and with a nifty positive close for month of May also, we may probably see a breakout in the charts. Will we witness a superbull run as 2004-08 where previous breakout happened??? only time will tell…I am not a student of economics, but i feel that inflation is the best indicator to track the economy. So i think for long term analysis , it will be better to take inflation adjusted charts. i am not sure about this observation. If any respected members can put some light I will be thankfull…charts.xlsx (121.9 KB)
This is a good way to approach index. Thanks for your work on this.
In my opinion, stock markets is the best hedge to inflation. The reasoning is simple. Inflation comprises of goods we buy daily. And when inflation is high, companies selling the products should gain. Hence in order to beat consumer inflation we buy consumer stocks. Hence stock markets are expected to beat inflation.
Given this background I think inflation adjusted index numbers is meaningless. Hence I do not expect any breakout. Please note that markets are already at peak. Earnings have been average imo. Why earnings have not caught up with inflation is an interesting question!
In ideal world, (assuming the inflation numbers are realiable, which I doubt, and discssion for another day and topic and govt does not meddle with the market), real return (nominal return - inflation) of different asset classes don’t vary too much over a long period of time.
Real return
Money Market - less than 1%
10 year G Sec Bond - 1 to 2%
Gold & Silver - 0%
Stock Market (developed countries) - 2 to 4%
Stock Market (developing country) - 3 to 6%
India Manufacturing transitioned from License Raj to Inspector Raj 25 years back. This led to to competition and over capacity in most of the industries. Add to the pain is the over capacity in China and other countries. This is very clear in the decline of RoCE over the past decade. Many pundits are saying this number will revert to mean soon; i doubt it.
In addition, technology bring cost reduction and deflation. This squeezes demand side of the economy indirectly. Lack of employment and underemployment are the symptoms.
Except Modi factor, most other forces are head-winds.
My 2 cents … this Bull does not have strong legs to run.
Inflation adjusted Sensex has given a breakout on charts.
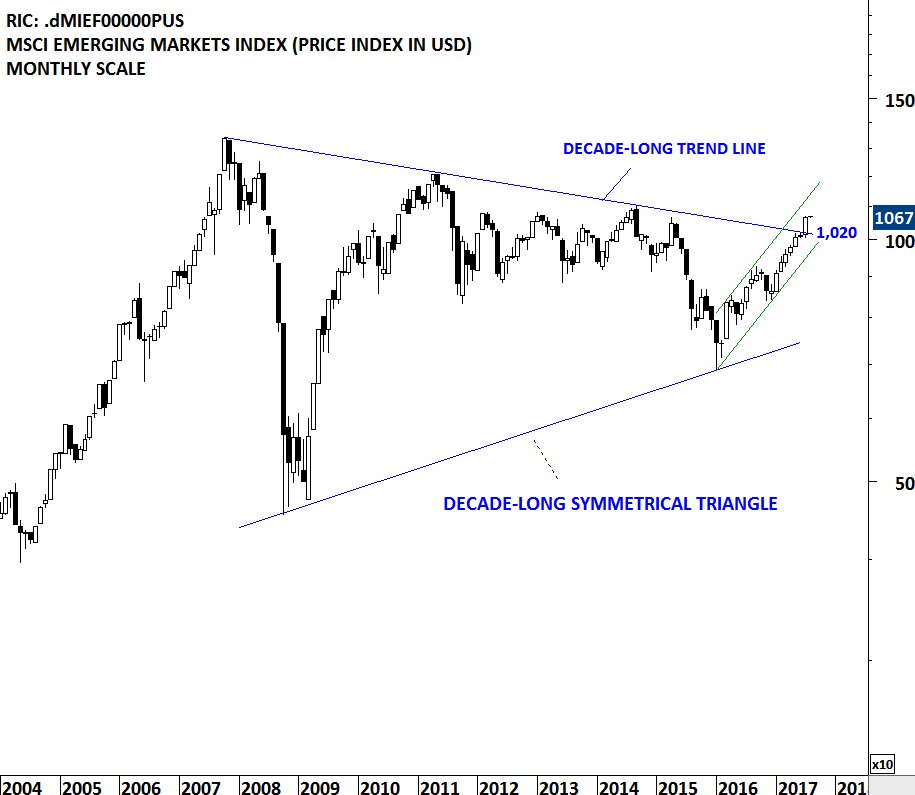
Previously when it brocken out in 2004 the great bull run happened. Can we expect something similar. Emerging Markets also shows multi year breakout. https://twitter.com/techcharts.