I am curious about valuation expert Aswath Damodaran’s comment on india’s valuation. From articles regarding it "The most expensive market in the world is India, and no amount of handwaving about the India story can justify paying 31 times earnings, "
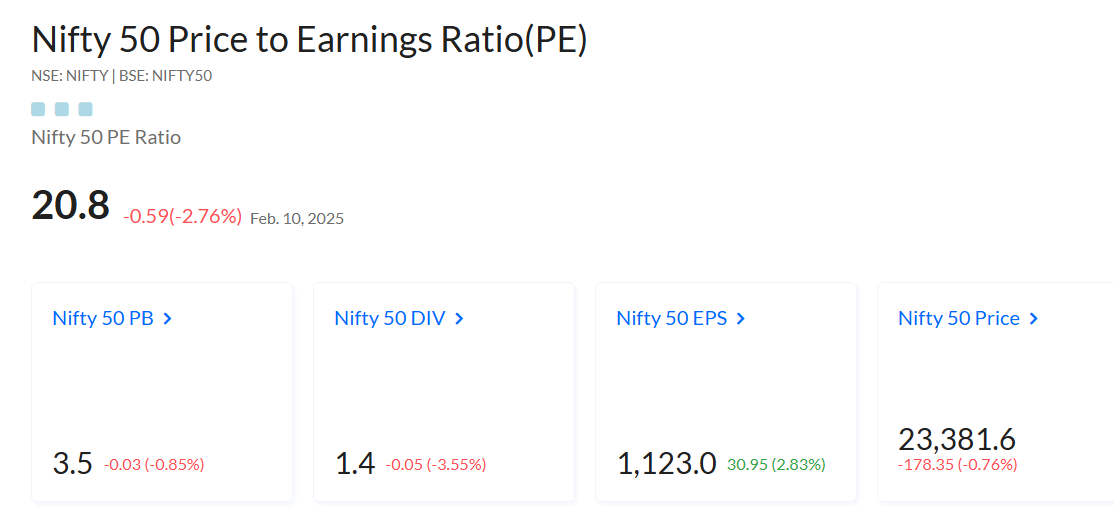
Does anybody understand why he says 31 times earnings? I was checking nifty 50 PE and nifty 500 PE. Both show numbers close to 24 and 26 for trailing earnings in tickertape. So curious how he calculated it as 31 times. Is he not referring to either of these index universes? Any ideas?
Thank you for asking the question. I was also curious about the discrepancy between the two. While small differences are to be expected. The difference between 31 times earnings and 20 times or other numbers is too high. Below is the Trendlyine number
I think, Aswath Damodaran’s was talking about nifty 50 forward PE which is 31 times earnings based on the India GDP Forecast: The Reserve Bank of India forecasted India’s GDP to grow at 6.7% in FY26, with quarterly projections at around 6.5%-7%.
Few years back, Aswath Damodaran was of the opinion that, Growth stocks / Platform stocks should be valued based on their Market Cap/Sales ratio and Future Sales value and not based on Earnings which were negative.
Hope that, his views on Platform stocks have not changed and He is not using P/E at all for Platform and E-Commerce / Quick Commerce Stocks.
Probably, for all other industries which are part of NIFTY 50, he is recommending to consider P/E for valuations. P/E is not used generally for Stocks which are Cyclic in nature, so it should be used with caution.
For individual stock investors, we should focus more on P/E or P/B depending on that individual stock. Nifty P/E sometimes could be optically high or low, depending on various scenarios.
PE is one dimension. We also need to track US/Japan 10 year yield. Cash Flow Discounting rate going up means NPV coming down. we are clearly moving away from Sub 1% rates to 3.5% and upwards. Similarly Japan from 0 to 1.4% now. Increasing rates means deleveraging which will impact Capital flows. From here a lot depends on domestic flows. Current flows can only sustain the markets. And currently economy is facing tight liquidity. Please see PE valuations in conjenction with Interest rates.
PE is one dimension. We also need to track US/Japan 10 year yield. Cash Flow Discounting rate going up means NPV coming down. we are clearly moving away from Sub 1% rates to 3.5% and upwards. Similarly Japan from 0 to 1.4% now. Increasing rates means deleveraging which will impact Capital flows. From here a lot depends on domestic flows. Current flows can only sustain the markets. And currently economy is facing tight liquidity. Please see PE valuations in conjenction with Interest rates.