Something which some of us on the thread have been pointing out for a 2-3 years.
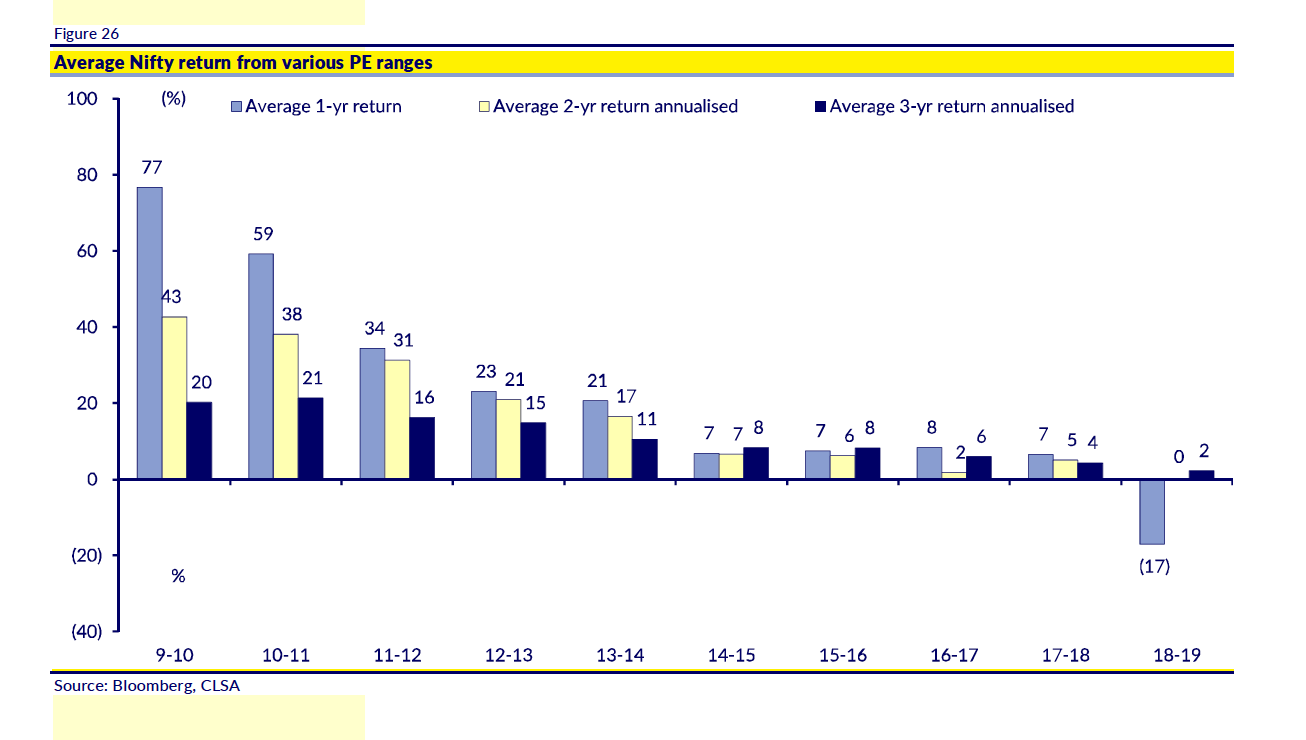
Investments made in index (and I did in my core holdings) during the Nifty PE fall to 17-19 for roughly 2 weeks in March has yielded tremendous returns without much skill of stock picking.
Now the same number is close to 35 and sector rotation is at play.
Still in learning phase, so pardon if question looks stupid. While it appears that PE is high, shouldnt we also think about current scenario and context? While it appears simple and desirable to invest only in lower PE at the look of it, it is appearing increasingly difficult these years in practice. Seems like earnings are highly depressed due to pandemic and high possibility that it will bounce back after pandemic comes to control. In such a scenario, wouldnt looking at price to book also in conjunction with PE and making a decision better, specially if you are looking beyond couple of years?. I may be wrong about this becuase timing it is almost impossible, but what if instead of NIFTY going down, it stays here or slightly higher, earnings become better next year and PE gets corrected? Also, noticing that this is coming on back of long duration of depressed earnings, would it return back to median or are we writing off indian economy or listed large companies in here? Clearly there are overpriced companies by any quantitative parameters in it and caution warranted. But may be NIFTY PE is not telling it all? Probably SIP in index or good MF is the only way to make some money for people with these questions?
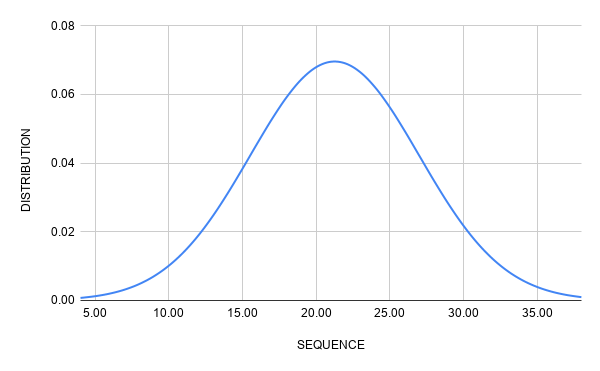
I have ran a calculation on the daily historical PE Ratio of NIFTY500 of the last 17+ Years (from 01-Jan-2003). I chose NIFTY500 as the guiding index because it covers around 96% of the total market capitalization.
Here is the distribution curve I obtained (X-axis is the PE Ratio line and Y-axis is the distribution density) -
Now below are the data on NIFTY500 PE which are important -
The world is witnessing a prolonged era of low interest rates, and asset values are inversely proportional to them. So it would be interesting to see what you get if you regress Nifty P/E with interest rates. Take 10-year G-Sec yields if available. The P/E will not appear as overvalued as it appears in isolation, though exactly by how much is the moot question.
Hi @Chandragupta. I agree to your statement and in fact the world today is definitely much different from what it used to be at the start of the this millennium. Both financially and technologically.
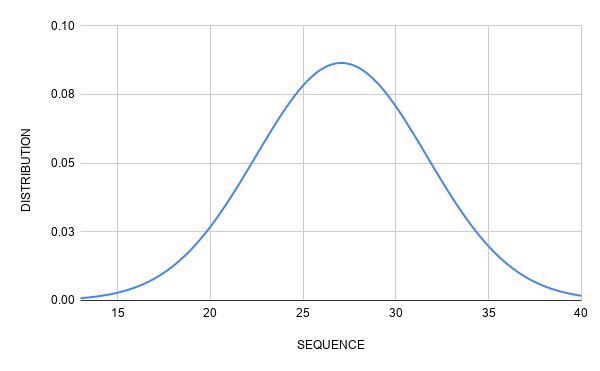
I actually re-ran my numbers with data starting from 01-Jan-2014 this time.
Because I noticed a visible shift to higher PE ranges from that year (not providing the data here to keep the post short though let me know if you would like to see it).
Anyway here is the result -
The data on NIFTY500 PE which are important this time are -
Now with this revised calculation - although the current NIFTY500 PE is not residing as close to the 3rd standard deviation boundary as it was previously. But nonetheless, it is still well beyond the 2nd standard deviation line.
Disclosure - This is merely an analysis and please do not make your investment decision based on this whatsoever.
Current P/E is looking high because of lockdown effects. It will be interesting to see how this chart looks like if we replace 20Q1 of this year with that of last year. I will try to get this analysis done
Since almost one quarter earnings was a washout for most companies and more than half a quarter affected due to decreased spend, a conservative ratio on P/E for current year would be to add 0.25 E to the denominator of P/E. This means we have to discount current P/E by 4/5 or 0.8. that means that currently we are at 0.8*38=30.4 which is below the mean. So this is a good time to buy. We are getting index at last year’s price.
One glaring mistake in above calculation 0.8X38 is 30.4 and not 26.4.
Keeping that aside, I was also of the opinion till last year that we should keep buying at all times (my previous messages). However reevaluated this strategy after reading more and more from senior investors. Purely lucky to sell 30% in beginning of March (did not had the courage to sell more. repenting.) and buying everything again in late March. I have again switched to sell side now that everyone is saying everything is good for markets.
It is not as if economy was anything to be gung-ho about before Covid. Its not going to be after Covid unless all the reforms are actually implemented. Nifty EPS is at same level as it was in 2014. Six years is pretty long time. We have to take all risks into account and keep following this excellent Entry-Exit model without adding any ifs and buts. May be that PE 24 in title will be different number for each person but everyone has to decide on their own number they are comfortable with and follow it religiously. For me, its time to book profits (for Mar2020 buys ) and loss in some wrong investments(Late 2017 buys )
Thanks to everyone who persistently tried to educate me in this forum to avoid buying at higher valuations. I did not adhere to it earlier but I am learning from mistakes. Long but happy process.
I personally believe that in this day and age, undervaluation in the stock market is difficult to obtain. Simply because the world is not the same anymore.
So you will likely need to pay a premium (compared to traditional valuation metrics) for most of your purchases.
In my analysis I was actually able to obtain objective evidence to support that.
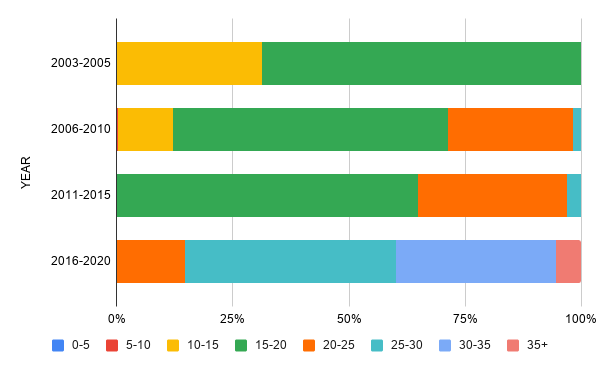
See the bar chart below which splits the NIFTY500 PE at market closure into 4 time periods of 5 years each. Observe the segment between 2016-Present -
The NIFTY500 PE has resided 45% of times between 25-30
While 35% of the times it resided between 30-35.
This was almost unheard of in the years before that. The corresponding segments would tell you that.
But for what its worth, this indeed appears to be the new normal.
If that is so, then I believe the question that remains if what your comfort level is.
Disclosure - This is merely an analysis and please do not make your investment decision based on this whatsoever.
US interest rates are in a downtrend since 1981, yet we have seen several crashes down the line. Therefore, we cannot attribute low interest rates as prime reason of euphoric valuation throughout the equity cycle. Yes, in the intermediate periods they can lead to overheated markets. Eventually everything returns to the happy medium. Stock prices are slaves of earnings irrespective of the fact whether earnings coming in a low or high interest rate environment.
Wherever earnings will return, p/e would moderate, otherwise Mr. Market is available to do the same job in a different fashion. All the best.
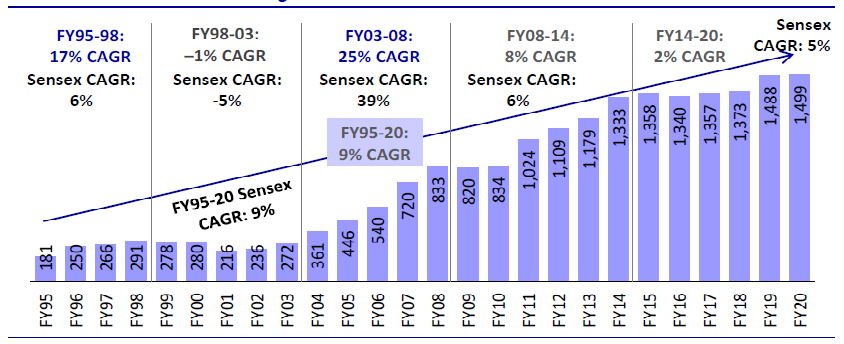
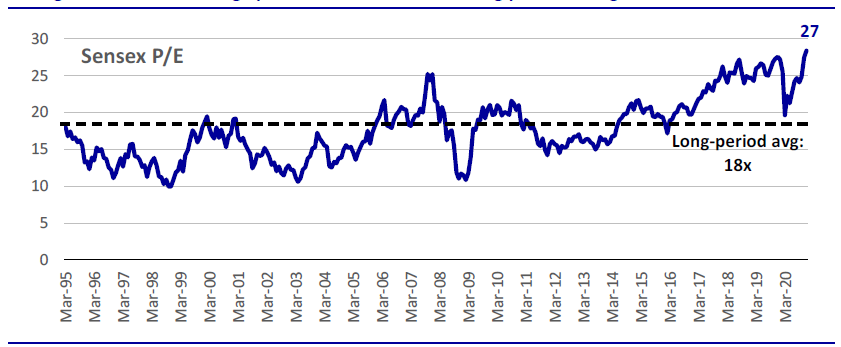
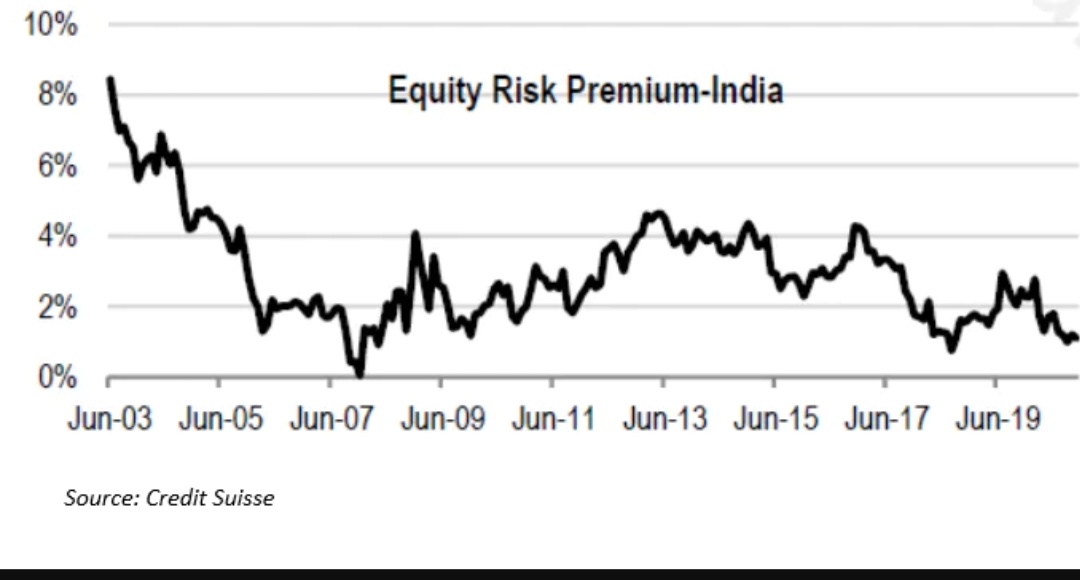
It is known that the 2003-08 years were a once-in-a-life-time period when several global & domestic factors aligned in sync to deliver one of the largest wealth creation opportunities in India’s economic history. But besides macro factors like economic reforms, globalisation and the commodity bull run, what seems to have aided these returns was that the starting Sensex P/E in 2003 was just a little over 10.
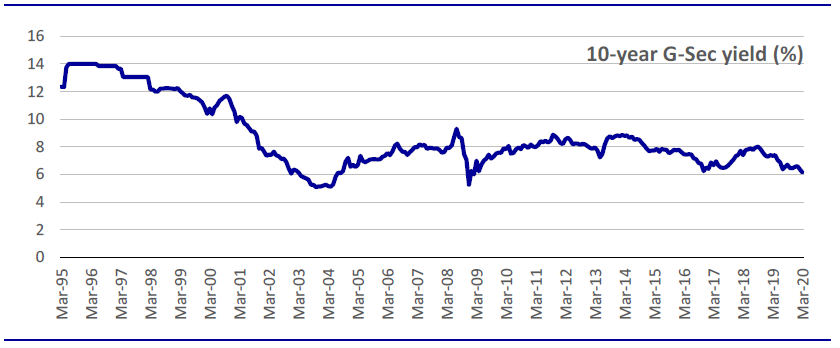
Often, an argument is made that interest rates have declined permanently to a lower orbit which justifies higher asset valuations. But this chart shows that the 10-year G-Sec yields in 2003 were lower than what they are today and actually went up over the 2003-08 period.
My only question is, if we are comparing 2003 numbers with 2020’s, how do we account for the excessive liquidity/massive rescue packages by the central governments globally which mainly came after 2008?
Goodness gracious, Nifty PE is at 38!!! This is getting silly now (will we see 40?), I expect the PE to get under 30 with earnings improvement and some correction. Starting this week, I have started moving out of equity (will not completely). And then wait atleast till the PE gets around 28.
I think the Nifty Index composition has changed, with lots of high growth high PE companies in it, I think the days of 22 PE are over, but still has to get under 30 atleast imo, its just a matter of time.
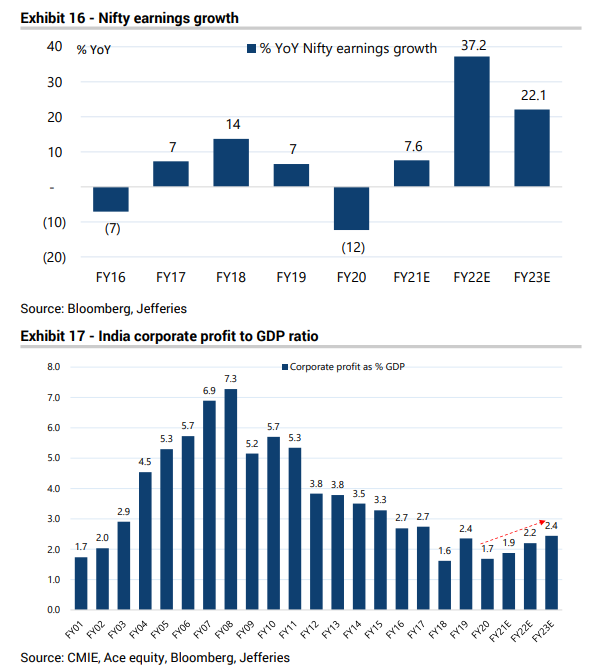
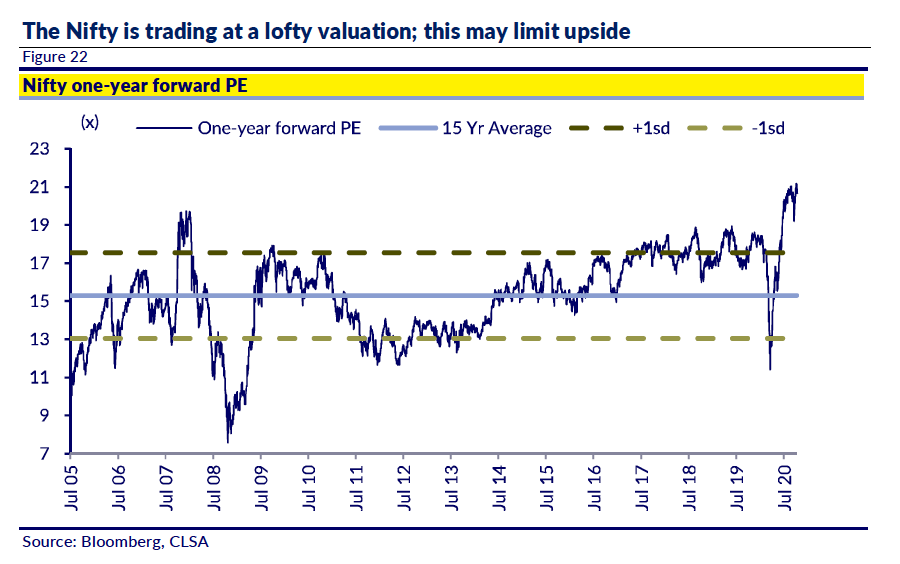
The fall in earnings combined with the rapid recovery in equity markets since end-March has led a meaningful rise in valuation multiples. The 12-month forward price-earnings (P/E) ratio for the Nifty now stands at over 24 times FY22 estimated earnings – a significant premium to the long-term historical average valuation.
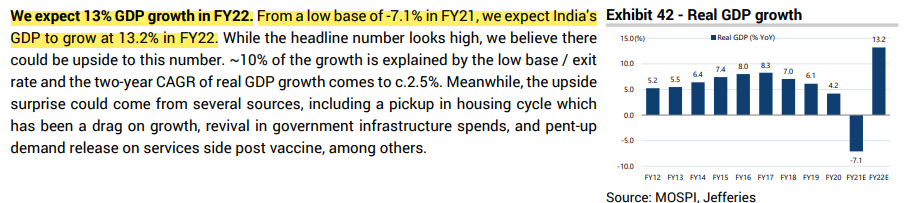
Hence, in a best case scenario, P/E will remain unchanged in 2021 or may even fall. Despite the lofty valuations, an outright collapse in P/E is unlikely as equity risk premium remain favorable.
Over the past few years, the equity risk premium, the difference between the 12-month forward earnings yield for the Nifty and the yield on the 10-year GOI bond (risk free rate), has trended downwards. That’s because that markets are expecting interest rates to remain low for a protracted period, with the RBI not expected to hike base rates any time soon. As a consequence, investors are asking for a lower-than-usual premium to invest in equities.
Lower equity risk premium justifies higher P/E multiples, but the future upside will be driven by earnings.
All in all, a synchronised global recovery, prolonged low rates and a weakening US dollar are all significant tailwinds for Indian equities in 2021.
Valuations should logically contract as earnings steadily improve, but we expect them to remain at the higher end of their historical range. The lack of alternatives for investors means that, as elsewhere, equity markets could continue to benefit from the TINA (“There Is No Alternative”) effect in 2021.
Risk Premium was highest in 2003 - which was the best time to invest, and risk premium was lowest in 2007, which was the worst time to invest. Today we are closer to 2007 than to 2003, therefore caution is advised. Isn’t that the correct way to look at this data?
Agree with @Chandragupta , but what the data may also be suggesting is that higher valuations will be increasingly justified. Neverthless, 30+ index PE feels uncomfortable - something’s got to give - stock price/earnings.
But then, these days, there are high growth companies and sky-high life insurance companies in the index - so comparing today’s Nifty to 5-10 year old nifty is not correct imo.
I see a lot of bullish statements in the news, we will see if the Greed translates. I have decided to keep my MF portfolio mostly as is(except minor cuts) and get out of 80% of direct equities. So I will still be in the game, somewhat (mainly due to MF)…
I see this as a period to restructure and concentrate portfolio as per a plan that’s been working nicely. Time to make the working mini-plan into major plan.
Been selling little by little every day towards the goal. Will mostly be done with the selling by next week.
It is difficult to say when the markets will top out. People were expecting it to top around 13K and provide a 10% correction but they have rallied to almost 15k. Who knows the markets could go to 17k or 18k also. No one can time the market perfectly
As Peter Lynch said, more money has been lost being on the sidelines and expecting a correction than in a correction itself. Stock markets need to double in 5 years to give you a 15% CAGR and quadruple in 5 years to give you a 30% CAGR. That doubling/quadrupling happens in times like the last year. If you miss out being rational on valuations, you will never make money.

 ) and loss in some wrong investments(Late 2017 buys
  )
)