For the EPS line to be a mean reverter, NIFTY should move around it, i.e both up and down. Since Nifty hasn’t gone down below it historically, this could be called as support.
Specifically - Fed Support.
This bolsters the argument that fed’s (and by proxy FII) action is more important that whatever is happening to companies and economy of india. Though inflation watch is necessary cause that affects USDINR by a significant amount.
Thanks Billu, I always look forward to your posts
FED QE at some stage will max out, some say major reason for current QE is upcoming elections as Trump wants to win again at any cost
Post election, this might change.
There is also talks if someone else suceeds Trump, corporation tax rates there will go up again to levels before Trump
All of this might be bad for USA stocks and by extention to Indian stocks to some extend
The rally probably is safe until then and after that requires closer monitoring ?
Both parties support money printing - democrats more so than republicans. I don’t see that policy changing anytime. Trump is the best MMT president ever. Ofcourse would that work remains to be seen - in US.
If the govt. continues to print money, then why raise taxes, besides - taxes come only when corporations make profits, if they don’t, then the question is moot.
India (as well as other non china EMs) have other issues viz, inflation caused by deficit printing and devaluing of currencies due to reasons including but not limited to inflation.
That would push stocks higher but with a lag, but all this will result in aggregate demand going down and political instability which will push stocks down.
Agreed… I loosely called mainly due to the fact that normalised nifty curve did go up and down before the big divergence last few years.
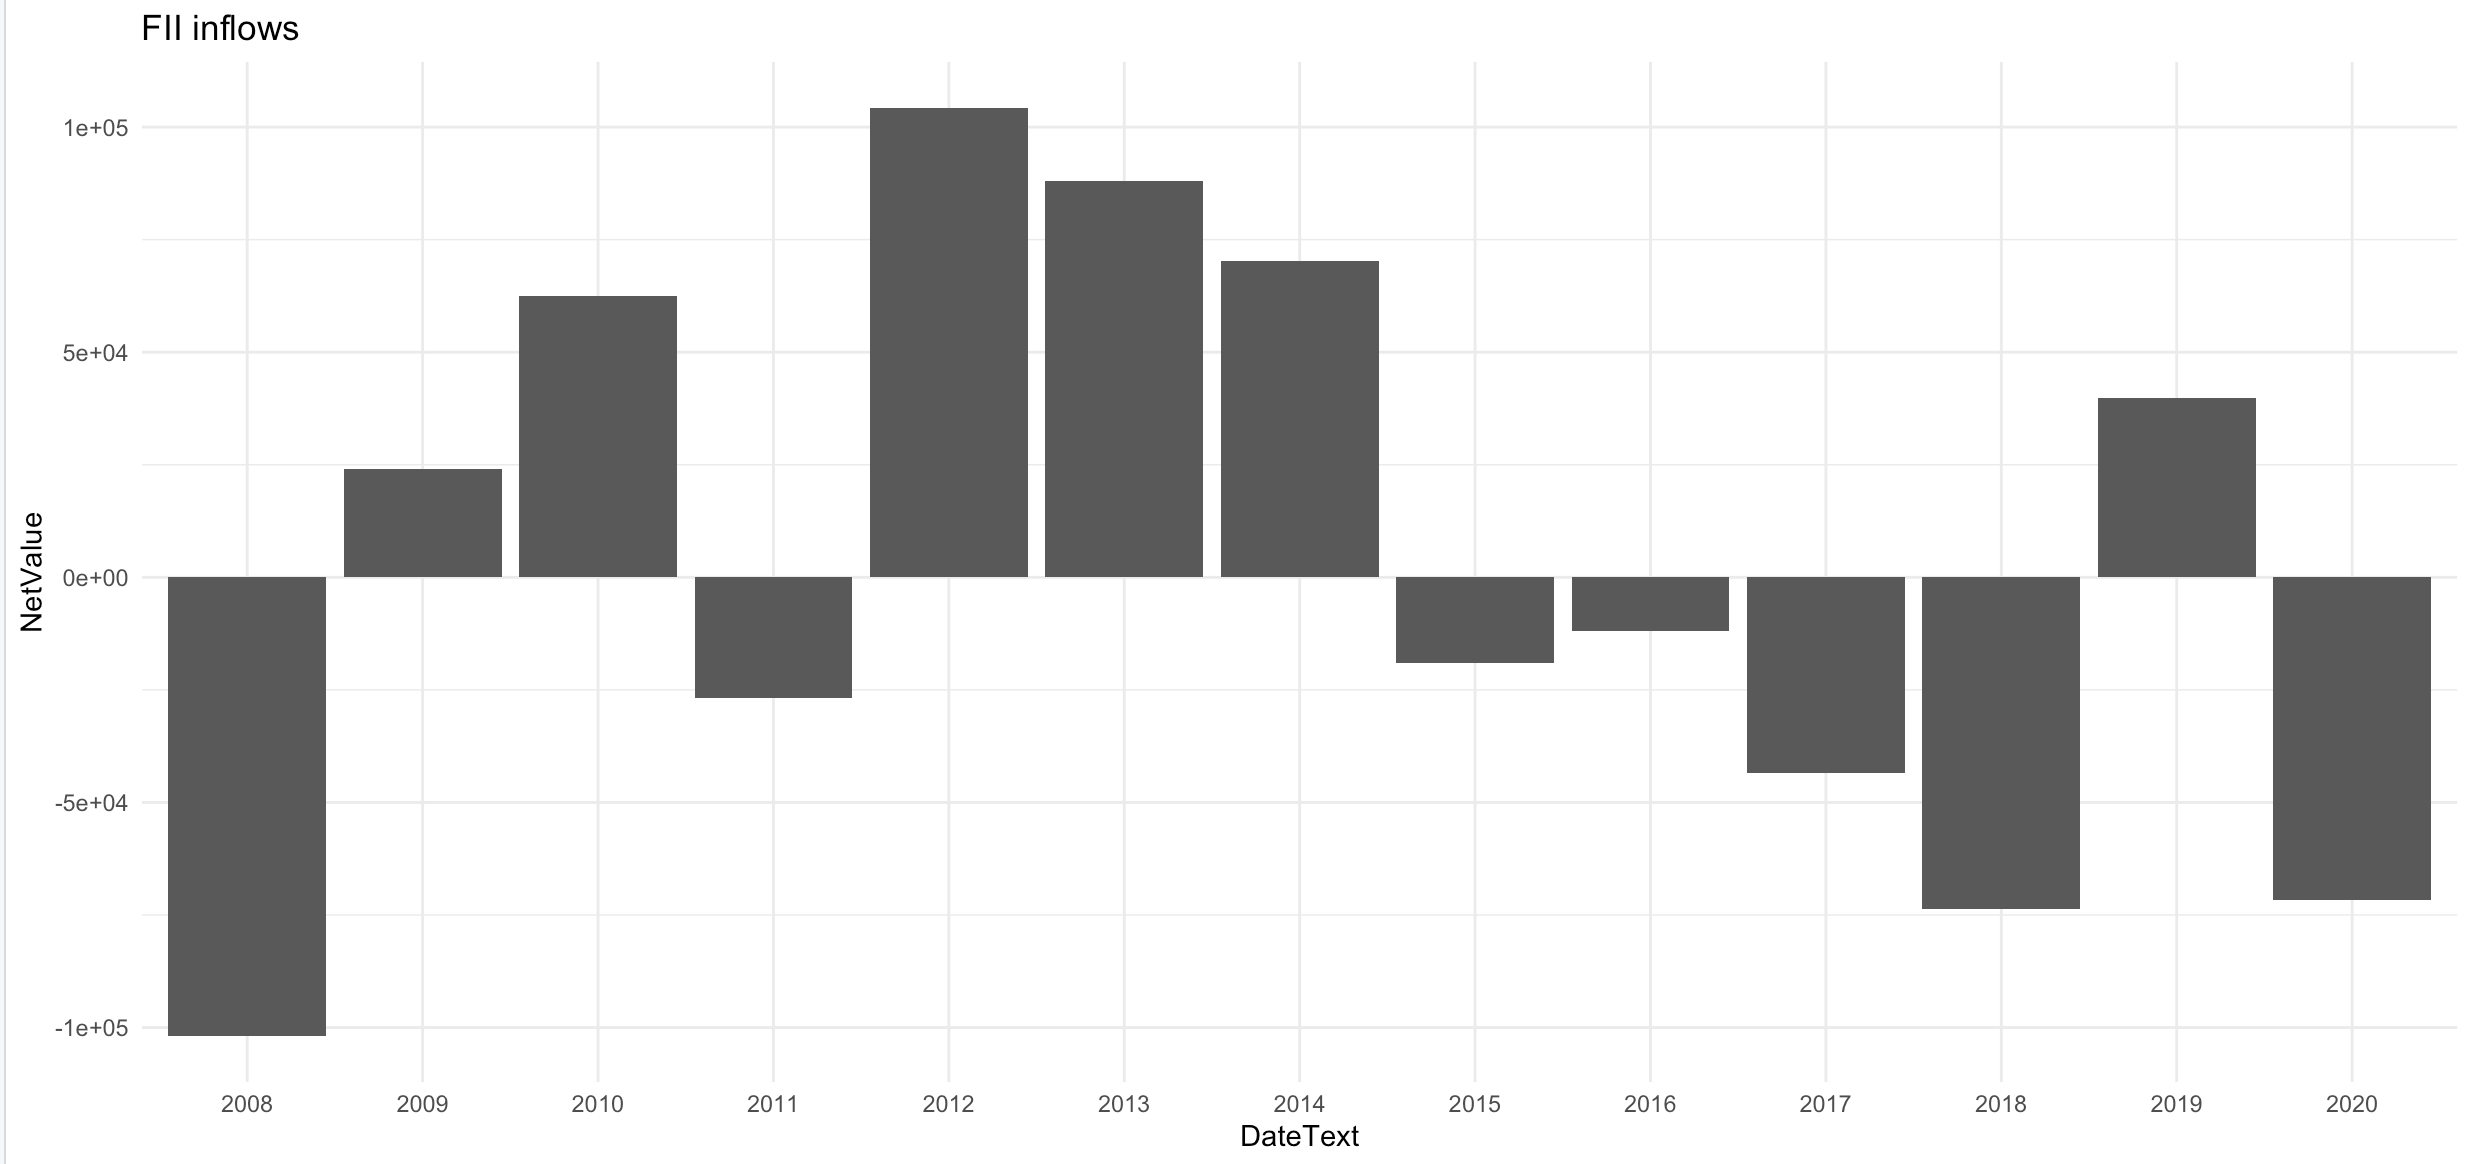
I would disagree with the point that FII aka Fed was the reason why market shot up without earnings last years… It would be unfair as the data suggests otherwise
FII inflows has been negative except 2019. *2020 data till today
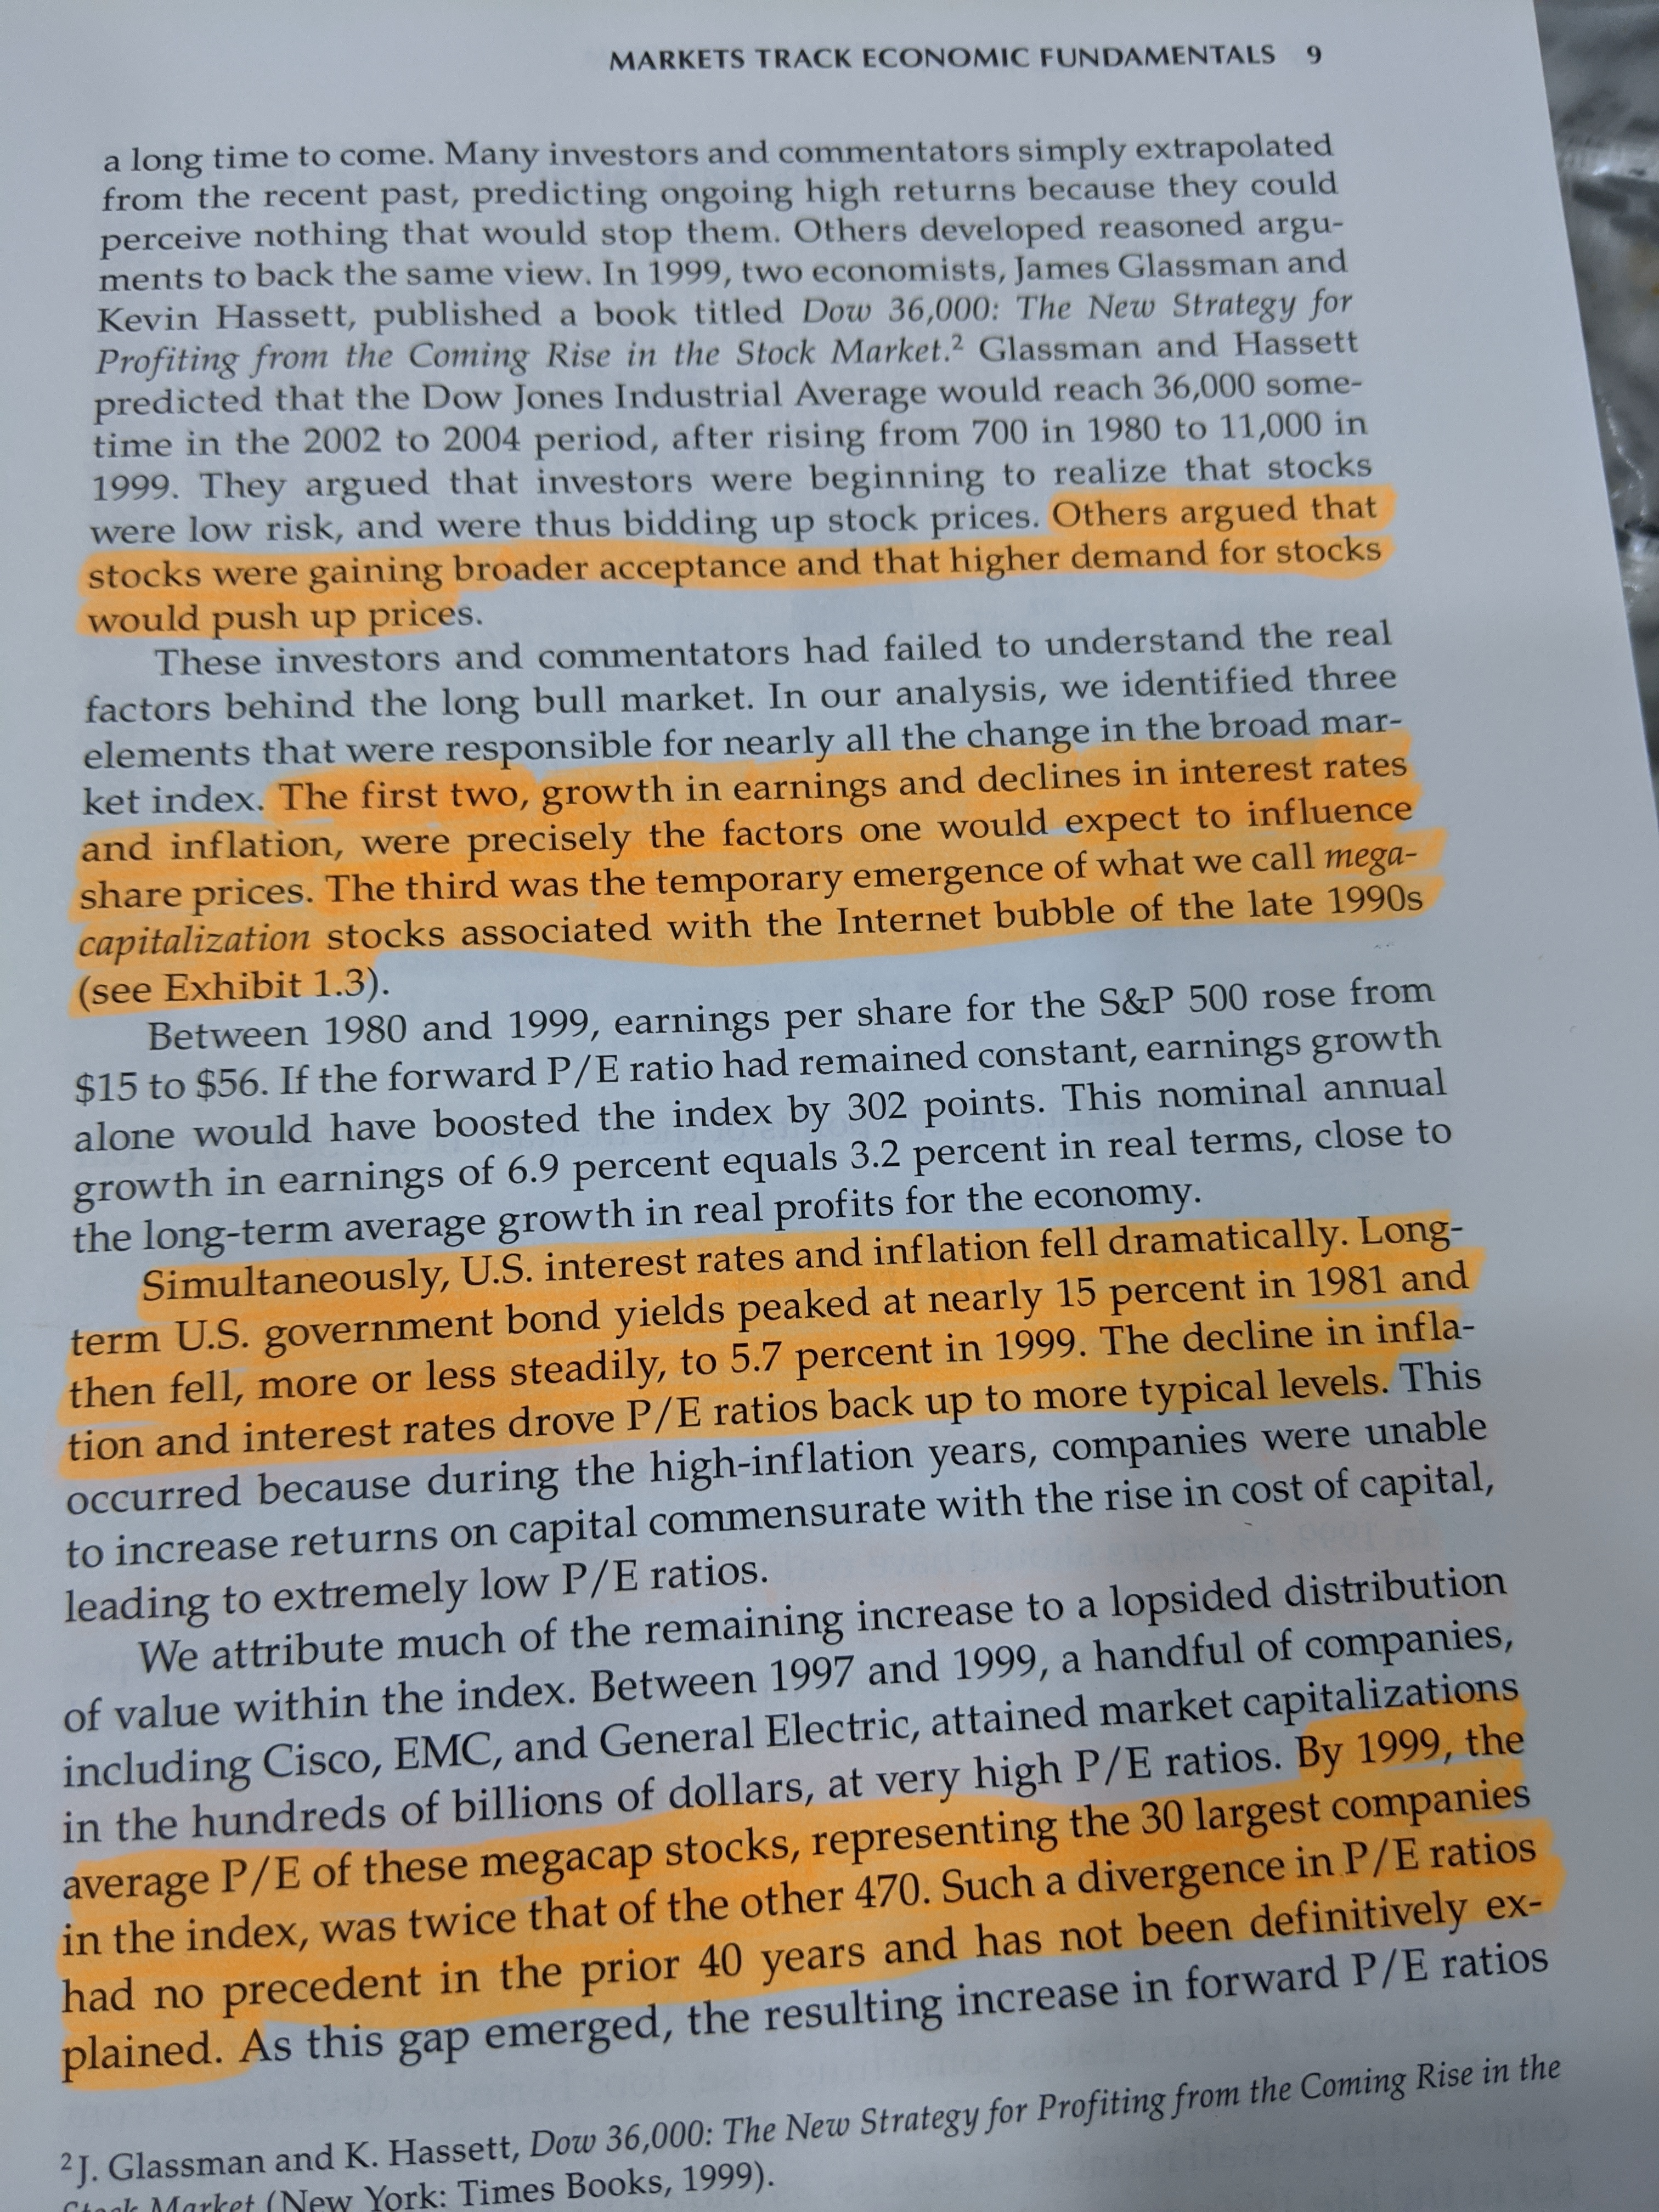
I would urge all serious investors to buy this book or download a legal e-copy. My own understanding differs from some of the previous comments, the Fed or other central banks cannot act as a ‘put’ and cannot inflate asset prices ad infinitum. Asset prices closely align with value/earning power ‘over time’ (say decades). The time frame wherein the prices deviate though can be large (a few years).
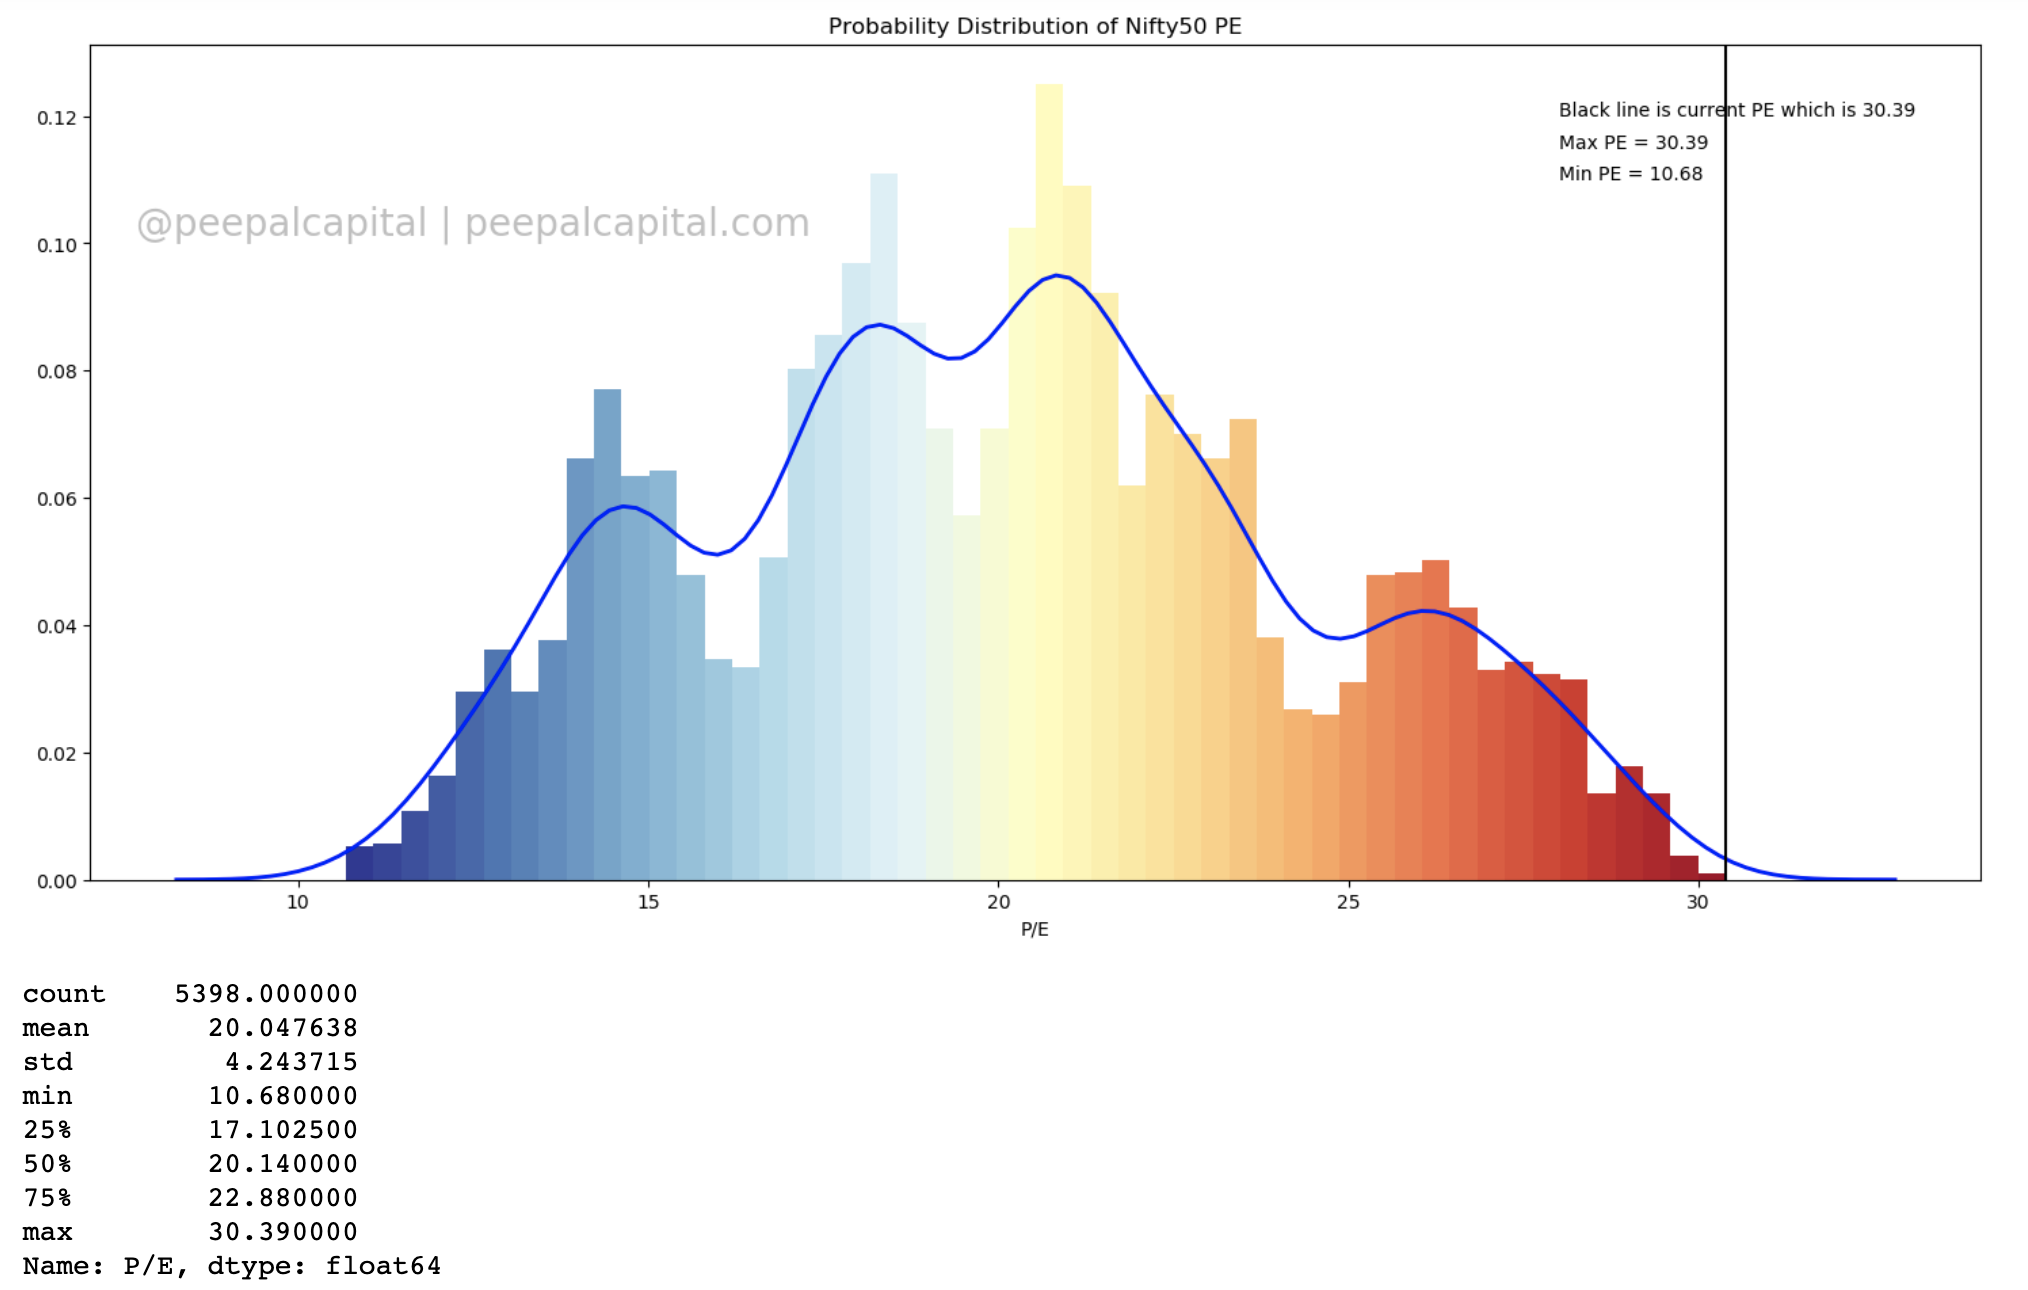
Dear Deevee, Thank you. We are in strange times. Business on the ground is still not stable or out of the woods. No one can quantify the impact. But nifty recoved 11+ K and staying stable or making advances inspite high Nifty PE. So whats your reading of the situation ? Is this exuberance or froth until Fed printing more money and kept artificially up ? What kind of investment decisions you are taking/changing considering Nifty PE crossed 30 now.
While it is difficult to quantify the impact at a national level, picture is emerging with some clarity at a smaller scale across the country.
For example in bangalore (where I work and generally stay), 50,000 shops out of 4 lakh have permanently closed down. With another 10% expected to be ‘on the death bed’. It is not immediately clear how this impacts listed equity players since they would both suffer and gain due to the lack of this real world economic activity. One set of arguments would be “the big would get bigger” the other set of arguments would be “the consumer demand has taken a shock and due to a reduction in demand, the big could get bigger by taking larger chunks of the pie, but the overall pie will shrink”. What ends up happening, i think, is difficult to predict.
I’ll not answer the rest of the questions since they’re directed at someone specifically.
I too have seen a lot of to let boards in Bangalore. I feel bad for these guys. One problem in Bangalore is that the advance is usually 10 months. (Dont know about the commercial properties. But must be the same). The owners might cut the rent from the advance (even though there was no/very little revenue) when the tenant leaves.
Index PE mean reversion is important by way of price correction or earnings. Dont go into absolute numbers & the endless debate of consol vs standalone. The concept is of mean reversion. Why I say so is if one had followed the basic tenets which I have been writing on this thread for years and simply invested in the nifty index he would be sitting on 40-50% profits since March. I clearly remember @jamit05 aptly say long ago the number was 17 PE to take decisive action. Check the charts we had 2 whole weeks of 17-19 PE in March. How many acted?
The day I posted the chart the PB was well below median as shown below.
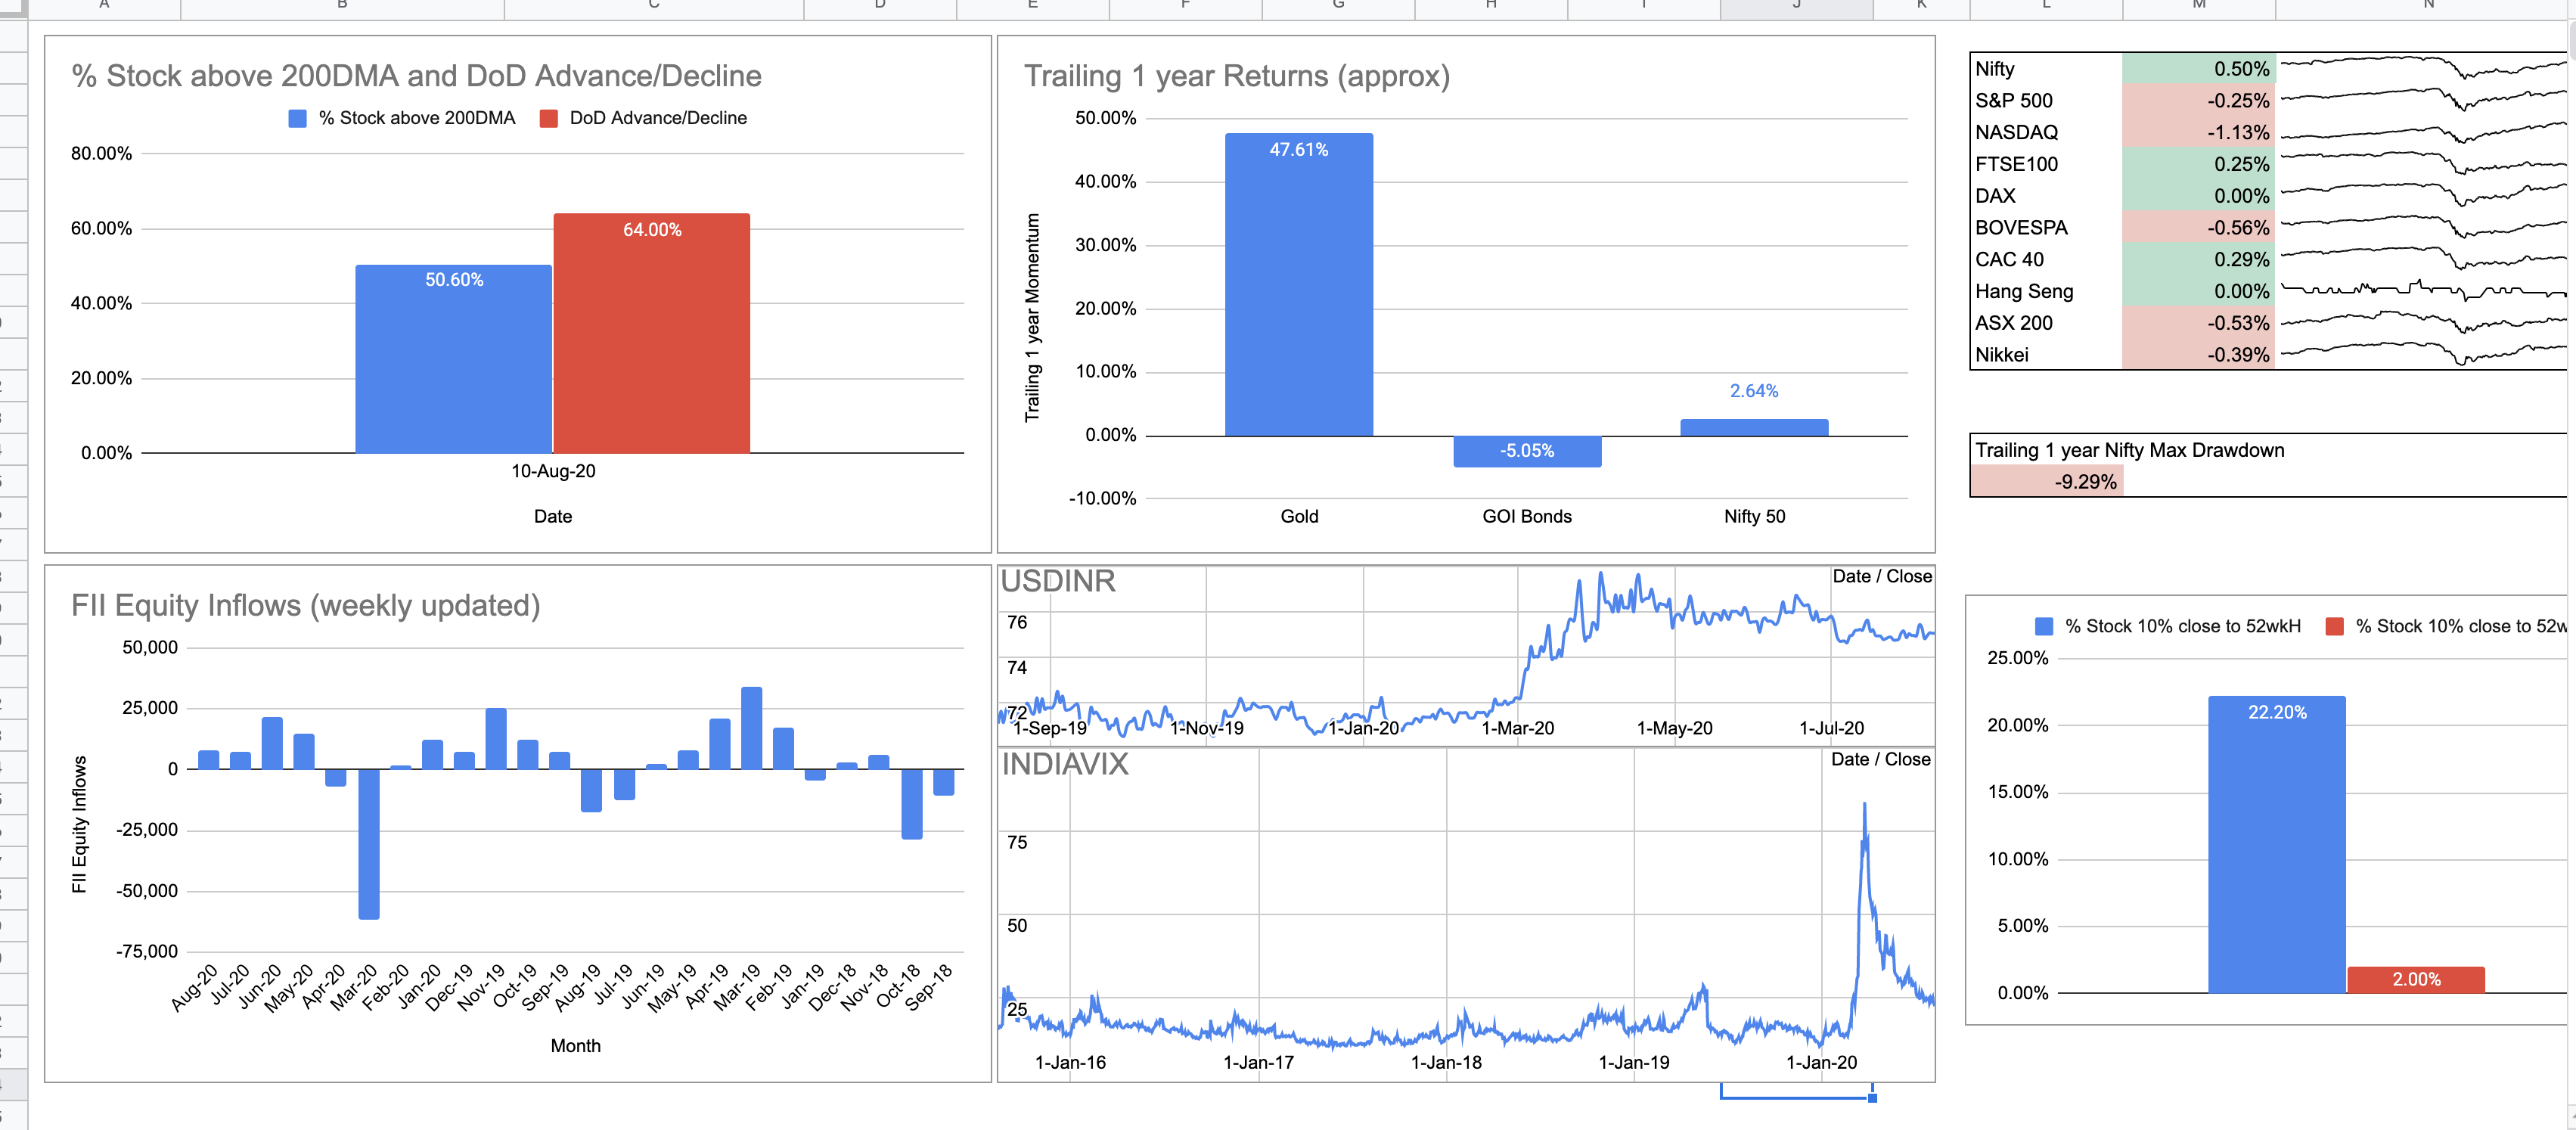
More importantly the percentage of stocks in NSE500 above 200DMA is over 50% I think. Check out the indicator ‘MMTH’, rather ticker and how it reverts. Over 100 out of 500 stocks on NSE500 are about to touch 52 week highs (near 10% or less to trailing 52 week high) and a mere 10 stocks close to their 52 week lows. The VIX though fallen is nowhere near median levels. Infact I think it is still at peak (pre covid) for the last 4-5 years. This is a raging bull without an iota of worry in the world.
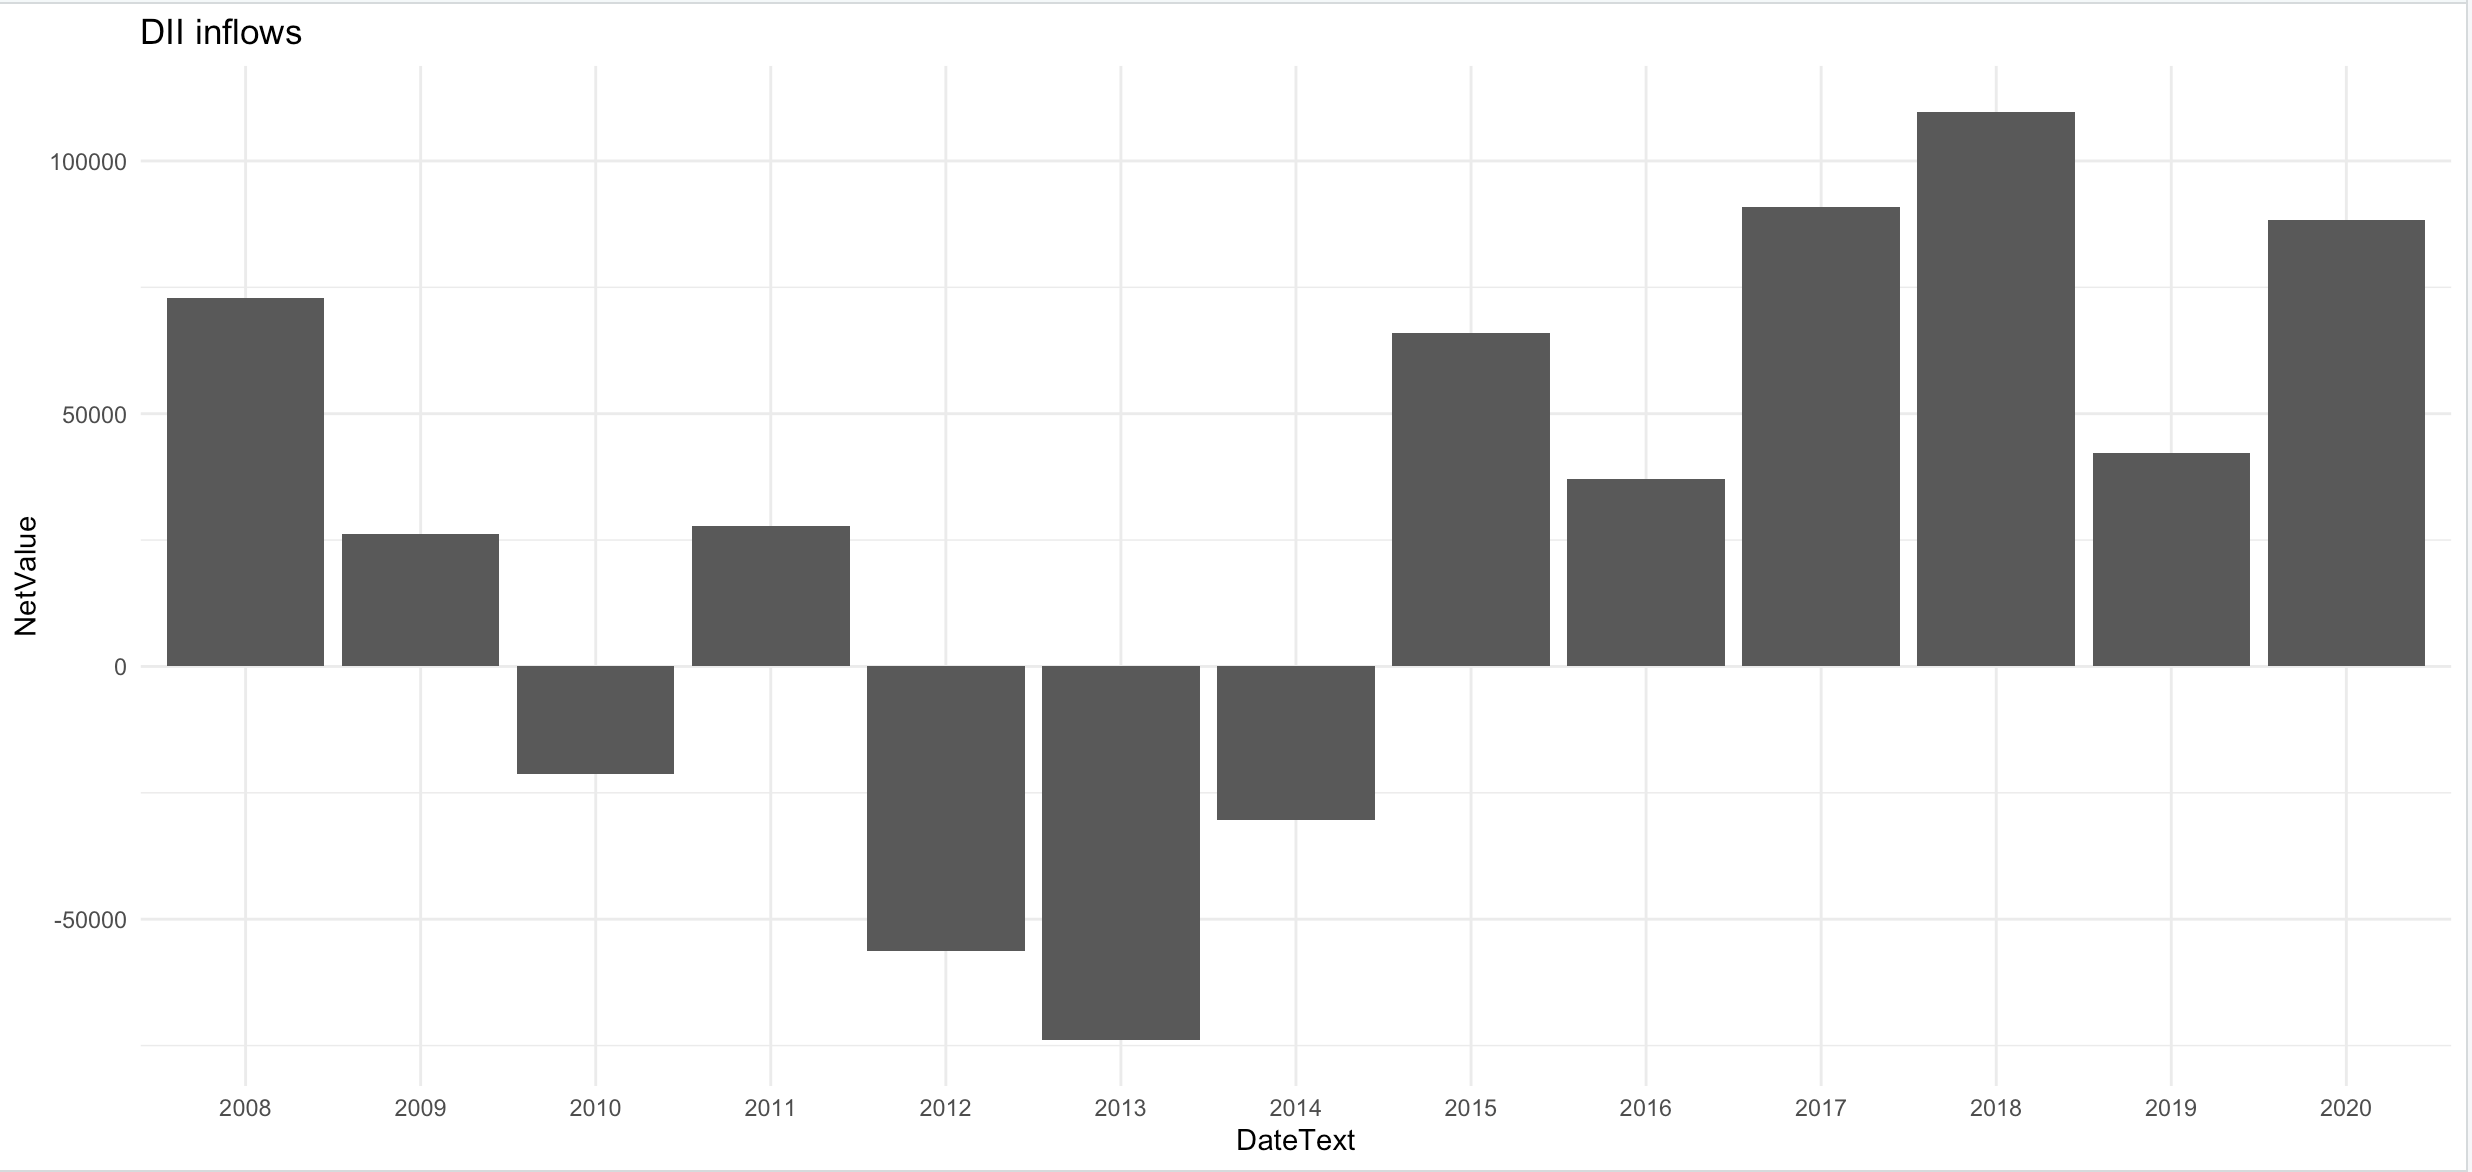
On the other hand FIIs have pumped money since May but investors have fled to Gold not even sparing a thought for equities and bonds. I heard today that equity MFs have seen withdrawals.
Coming to me.
Having said all of this for my core portfolio I strictly follow my rules. For my systematic portfolio I do not need to worry about market conditions to hurt me. Just that for my core portfolio I have a portion hedged. There is sector rotation going on with one sector falling in the goldilocks zone. One needs to be contrarian in approach for long term investing I feel. The time for investors to act on Divis was in mid 2017, now it is time to observe. What do we think about Banking or Auto today, no one utters the word Auto.
Thank you Deevee for very detailed view. That is much useful to see things in a bigger perspective.
Do you create these charts by your own (eg: % of stock about 200 day DMA, % of stocks near 10% of 52 week High and 10% of 52w low. If these charts can be extracted by others without ‘too much effort’ please let me know.
Good to know you follow the rules strictly and message is clear that you might be 25% or less in equity allocation. What I wonder is that will the music stop slowly and gradually or will it stop suddenly. But as you mentioned in your blog that there is no use of prediction and market is not bound to act on our prediction, especially given to her mood swings. As a novice, I remember reading discussions on Divis when it reached below 600 in 2017 and now it is a 5 bagger if any one bought and held on to it.
On charts
The histograms/probability curves are created in python and excel. Data from NSE website.
The dashboard is something which I have for personal use. Here it is. You can copy it and tweak for your use.
The core Indian portfolio is low as you said but I do have a US and a systematic portfolio apart from some MF investment.
Also if one is not managing anyone else’s money they are all novice. You and I included
Rgds
Update 1: Guys I am removing access to the google sheet. Somehow many folks are using it and data is not refreshing for me. I suggest to copy this. Apologies,
Update 2: I got a lot of requests to get access to the dashboard so I made a separate copy. Please use the above link now.,
You won’t include Damani, rj, dolly Khanna in that bracket
I have found my observation is that portfolio managers generally are unscrupulous
There are some good ones in jurisdictions with stricter controls
It can be seen that since 2017 it has almost consistently been in the red zone. Nifty PE has been below 24, for 7 months(out of which 3 months it was above 23) out of 32 months. In the earlier years, the chart was mostly in the green zone. So does it mean that returns were better only in the years this was in green? Because just in the way a 23+ PE was the new normal over the last 3 years, maybe a 30+ PE will be the new normal going ahead.
Also, the current PE ratio would be due to Q1 results also and ‘most’ companies excluding those severely impacted like Movie halls, store retail etc. might make up for those sales in the coming quarters.
In such a case would it not make more sense to look at parameters like the 50 dma crossing the 200 dma(golden crossover), to evaluate entry exit?
Please correct me in case of any error in my understanding.
TTM PE is an essential metric to track undervaluation/overvaluation of markets, but solely relying on it to make investment decisions is not a wise strategy. PE generally reflects the disconnect between earnings and prices and the gap can remain widened or depressed for a temporary period of time. Though, empirical evidence suggest that valuation metric oscillates between a defined range, however it can still get violated in the short term.
Monumental changes in investment methods, sentiments, government and central bank policies can take valuations beyond justified levels for an intermediate period. However, mean reverting theory do make a comeback in the long-term. Anyways, it is always good to compute PE on average earnings of past years to get a more realistic picture about valuations overall.
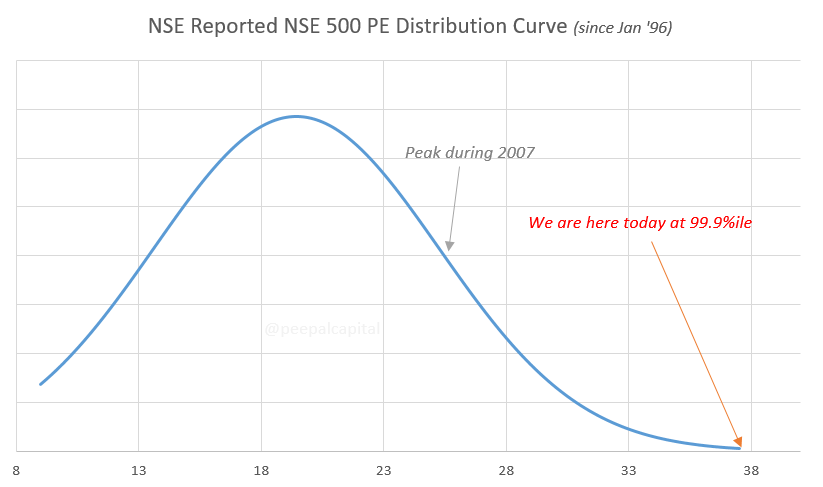
The argument now is that low PE stocks left Nifty 50 and high PE stocks entered N50 so naturally PE will go higher.
But let us look at the NSE 500 index since 1 Jan 1996. This index today covers 97%+ of the Indian Market Cap and as I write this it is at the highest PE ever. I guess this index PE is better to track?
70%+ stocks are trading over 200DMA.
25%+ stocks are within 10% of their yearly highs
Less than 1% stocks are withing 10% of their yearly lows
Lowest VIX since Feb I believe but still above 5 year median
Money is just flowing in!
Like I said earlier
The best time was in the two weeks then for large lump sum allocation. The next best time is not here yet. Continue researching on ideas and trading with momentum. That is all from a personal point of view.