I did not see any folly. In any case investing is a funny craft where many “experts” make money by telling you how to make money. Now if you think about it, that’s a paradox in itself.
Veterans may say buy this or that but for every buyer there is also a seller who is also a veteran!
I think normalisation of earnings, or trying to find out core earnings is a subjective process.
The Nifty trailing 12 month PE as of 31/05/2018 was 23.35 vs 22.45 as on 20/02/2018. Thus valuations have grown more than earnings, unlike last quarter. About the same time last year the PE ratio was 22.18 which means valuations grew ~ 5% faster than earnings compared to last year.
Nifty EPS (arrived at by dividing Nifty by Nifty trailing PE above) works out to 459.73 vs 461.47 end of Dec. In other words Nifty EPS has fallen.
Weighted quarterly PAT in March fell by about 9% vs Dec quarter leading to fall in Nifty EPS. This is likely due to changes in Nifty effective April 02, 2018.
Q4 Nifty PAT unweighted was about ₹90,000 cr. Q4 GDP (at current prices) was ~ ₹ 45 lakh crores ( [Q4 GDP] )(http://mospi.nic.in/sites/default/files/press_release/nad_PR_31may18.pdf). Thus Nifty forms 2% of GDP, which is way smaller than what is generally thought. Also, we need to take GDP at current prices (nominal GDP, not real GDP), not constant prices. Further, generally people take income of a firm to compare with GDP whereas it should be earnings.
Nifty is constrained by many factors unrelated to the broader economy in general. For instance free float and liquidity are important factors to be included in the Nifty. Besides it has to represent the market, which will not have full representation of the economy.
Nifty also will have to pick businesses in a sector that have better prospects, even if not representative. This is best illustrated in the composition of banks. There are 6 private sector banks vs only one public sector bank in the Nifty, whereas public sector banks account for more than 60% of assets.
When I last looked Nifty has a substantially larger portion of its business conducted outside India, and exported from India vs the Indian economy 50%+ vs 36%, iirc). For instance, all IT, Pharma firms have mostly exports, as does refining business of Reliance. Tata Steel, Tata Motors, Hindalco have overseas businesses larger or comparable to their Indian businesses.
Another important factor is that the change in computation of GDP (which is a statistic, whereas Nifty earnings are not) that inflates the GDP, and for which back series has not been provided to make a comparison. A reading of the changes with some economists’ commentary led me to believe that that the new series does inflate GDP. This has resulted in divergence between the statistic and pockets of reality we are each exposed to. There was an opinion to that effect as recent as a few days ago (India needs to diagnose its GDP system).
Do you have weighted earnings growth for the year and quarter, if you have that numbers easy?
On on broad level Nifty 50 should represent that best that India has to offer therefore the earnings growth of Nifty 50 shall be more than GDP growth but if the case is otherwise it is something to think about!
My computation shows a decrease of 4.6% in TTM Nifty EPS from 460 on May 31, 2018 to 439 on August 14, 2018.
Bloomberg on the other hand shows an increase of Nifty EPS to 480 (I presume it is TTM), an increase of 4.3%. However Bloomberg does not give its source of computation. So far as I’ve seen our computation has been in line with Bloomberg, except this time.
I have checked / rechecked / split whatever little hair I have, but could not see an error. I later analysed why this is so even though weighted PAT has gone up. I try to explain this below, but would appreciate if some members can chip in ( say @Yogesh_s and many others who are excel savvy) to validate what I have done or if some can try to source an alternate computation.
Consequently, as per my computations, Nifty PE has gone up from 23.35 end of May to 26.07 as of yesterday. This is again in keeping with the trend with increase in valuation ahead of increase in earnings.
My explanation of why Nifty EPS has gone down vs May 2018:
First, how I compute
We compute Nifty EPS as Nifty value / Nifty PE, Nifty value is the closing value taken from NSE. So Nifty PE is what we really compute.
Nifty PE is computed as (sum of weighted MCap of each constituent stock) divided by (sum of weighted PAT (consolidated) of each constituent stock)
Sum of weighted MCap of each constituent stock = Full MCap of each stock * weight of the stock. Total weights add up to 100. Weights are sourced from here. Market Cap is taken as the average of BSE / NSE from CMIE’s Prowessiq I am subscribed to.
Sum of weighted PAT (consolidated) of each constituent stock = Consolidated PAT of each stock * weights of the stock as sourced
Consolidated PAT (or standalone in case consolidated is not available) is sourced from company filings or Prowessiq, validated with filings. There are assumptions to be made sometime, which are generally not material and these assumptions can be found in my excel sheet. The biggest assumption I had to make was on HDFC which did not declare consolidated results this quarter because of Ind AS transition.
So computation of PE seems like a straight forward arithmetic affair. The excel shows each of the computation as well.
Next, explanation of decrease
Nifty EPS has declined because Nifty weights have shifted (q-o-q) from companies that added substantially to profits in quarter ended June 2018 vs June 2017 to companies that substantially reduced profits in quarter ended June 2018 vs June 2017. Weights can be thought of as quantities of each stock in a portfolio and shifts in weights among them are akin to selling some and buying ₹ equivalent of some. If the shares of those I sold earn more than the shares of those I buy, the my portfolio EPS will go down.
That’s what has happened with Nifty EPS. Of the 50 stocks, 16 increased their weights (by 4.35 out of 100) and 33 reduced their weights (obviously by the same amount), one remain unchanged. Now the 16 whose weights were increased had profits reduced by ₹ 42,054 million and the 33 whose weights were reduced had profits increased by ₹ 73,121 million. For instance SBI’s weights went up by 0.29 but its profits reduced by ₹ 72,623 million. Reliance’s weights increased by 1.43 but it produced increased profits of just ₹ 3,510 million or 4%. But Dr Reddy’s profits went up 6 times even as its weight dropped. (You may unhide Columns K to P in the sheet attached and see it stock by stock)
This can be better explained (oh really ) if you have say just 2 stocks (A and B) in a portfolio (of 1 unit), of 50 shares each. Say both have equal EPS of 1 and MCap of 500 and 1000. Next year, you sell 25 of stock A, whose MCap remains constant and use that to buy stock B, whose MCap is now risen by 20% to 1,200. Thus you end up buying 20.83 shares of B by selling 25 of A. If during this period A’s profits rose 25%, and B’s falls 10%, then the portfolio earnings per unit has moved down from 100 to 95 (95 = 25 shares1.25 EPS + 70.83 shares.9 EPS). But overall profits have grown up to 152.5 from 150.
P.S: My standalone PE computation matches with that shown in the NSE website (~ 28.02).
I was under impression that weights of individual script in Nifty is contant until it is specifically changes but to my surprise weights of different scripts in Nifty changes in real time (continuously) based on the price of the script.
@diffsoft This may explain the difference between your and Bloomberg calculations. You may be taking weights on different day than Bloomberg.
Methodology for calculation of Nifty is given on this website.
I don’t think it changes in real time (and nowhere did I find how it changes). The reason I don’t think it changes in real time is that (a) that would make an Index Fund / ETF very very expensive because these funds have to buy and sell in real time, thus increasing ‘impact cost’ (or trading costs) and (b) the Nifty weights are given for the whole month here without specifying the dates. This lead me to presume that index weights change about once in a month. But it does seem to change a little daily, but very little.
The changes in weights are also not related to changes in MCap. Stocks that have increased MCap have found their weights reduced over the quarter. For instance HCL Tech weight reduced by 0.19 even as its MCap went up 10%, and so on.
They explain everything except how they compute / change the index weight. You can search for index weight. That’s possibly because they licence the index and do not want it copied.
I saw that and read a detailed article here. But this is at variance with what the Nifty Indices published today. It shows HDFC Bank with the highest weightage followed by RIL.
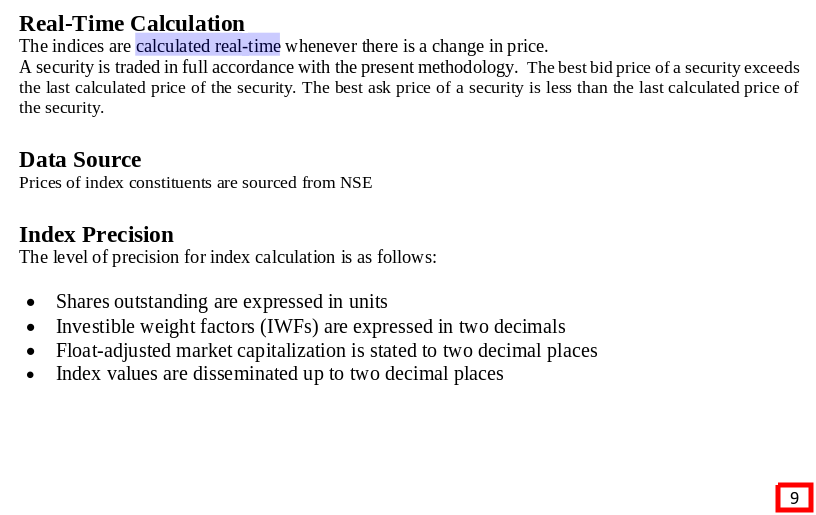
1st pic - Real time calculation of the index not of the weights attached to each stock.
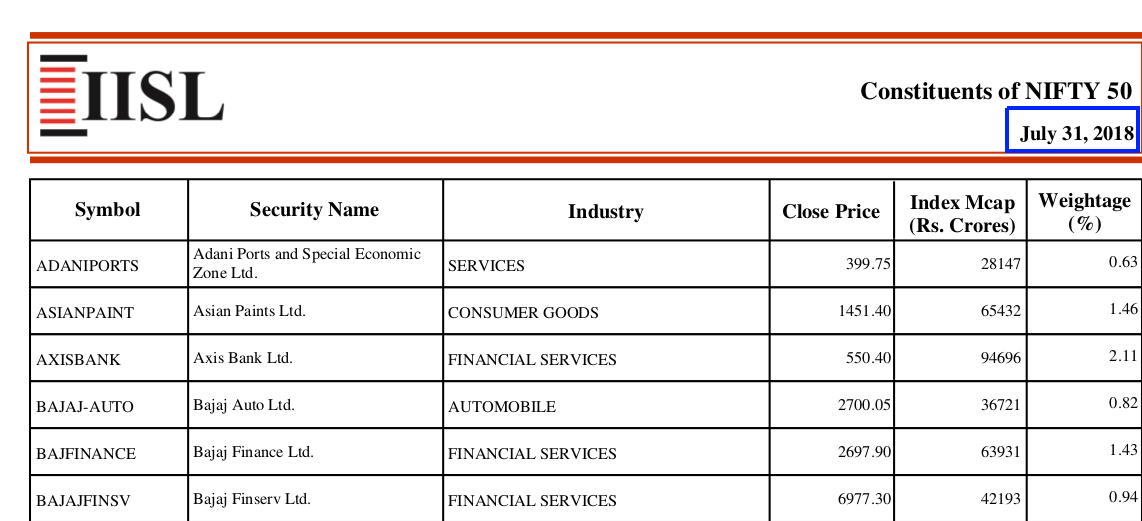
2nd pic - On the weights, you are right, they specify the last day of the month whenever they give the weightages for any month. Haven’t seen for any other day
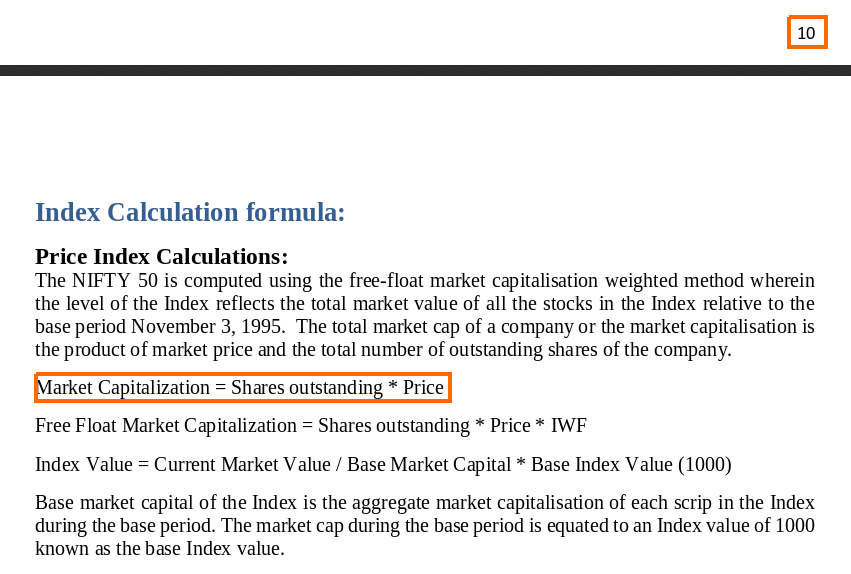
3 3rd pic - The areas marked is the Market Cap computation of a company. It says Index Value = Current Mkt Value / Base Market Capital * Base Index of 1000. This is not clear at all, and the best way to see this is to try to compute the index value today through this. For instance Base Market Capital is market cap of each scrip in the index during Base Period. Base Period is set at Nov 3, 1995 (page 6). But what about companies that are in the index and listed later - like TCS, Coal India etc? It’s not clear.
Possible but I don’t think the weights would have changed by 0.58 from 10 to 9.42 close of day…the FE article which has the same headline, says HDFC Bank’s weight was 4.81 or so, but actually HDFC Bank’s weight is given in Niftyindices.com at 9.52.
Nett I am not clear because these things do not seem to add up.
Hi @diffsoft your calculation is correct. Bloomberg probably uses adjusted earning to calculate EPS to remove effect of extra-ordinary and exceptional items from P&L. I do the same too. This quarter SBI, ICICI and Tata Motors had exceptional items. What is exceptional and what is ordinary is subjective so everyone has to use their own judgement.
Alternatively, I calculate contribution of each company to the overall growth rate of the index to eliminate any outliers.
As you can see, SBI and ICICI together took out 10% from overall growth (weighted). Every quarter there will be few companies that will have a disproportionate contribution that will skew overall growth number. Most members contribute nothing to the overall nifty growth so the index itself is highly skewed towards few large companies.
Another number I use is growth of operating earnings. Operating earning is EBITDA - Other Income for manufacturing companies and EBDT + Provisions for financial companies. This eliminates P&L items that are based on estimates and that do not reflect performance of underlying business.
Thanks @Yogesh_s for going through it. I have asked some of my sources(!) to get the Bloomberg EPS computation as we can try and figure out.
Anyway, I was in half a mind whether to continue giving Nifty PE / EPS to the group because of the discrepancy, and consequent confusion. I will continue for now and we can see how the discrepancy moves over time.