CMP Rs. 490.
PE - 4.87
Debt free. Belongs to reputed Bombay Dyeing group.
Capacity expanded by 25% in June 2011.
Dividend yield 2.5%.
| Operating Profit Margin(%) | 47.67 |
| Profit Before Interest And Tax Margin(%) | 43.45 |
| PBDTM (%) | 47.29 |
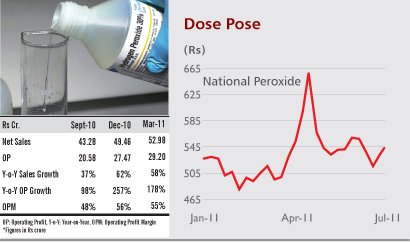
There are currently four companies which manufacture Hydrogen Peroxide in India. National Peroxide Limited continues to be the largest producer of Hydrogen Peroxide in the country with
a market share of 36%. In addition to being well known in the industry as a pioneer, its product commands a strong brand image. It has been in the forefront in the development of technology for manufacture of Hydrogen Peroxide, as well as new applications development. Due to these efforts, the domestic market has significantly developed over the years.
The Companyâs project to expand its capacity to 84 KTPA is at an advanced stage and the increased capacity is expected to be available by June 2011. Another competitorâs additional capacity of 28 KTPA is also expected to be available by June 2011. The total production capacity in the Country, during 2011-12 is estimated to increase to 202 KTPA on an annualized basis. The
domestic demand is expected to grow by 7% p.a. during 2011-12.This will result in the domestic demand being fully met from local producers
| Rs. In crores | |||||
| Particulars | Mar-11 | Mar-10 | Mar-09 | Mar-08 | Mar-07 |
| Sales Turnover | 199.53 | 131.79 | 151.68 | 126.13 | 73.13 |
| Other Income | 3.25 | 0.6 | 1.03 | 0.9 | 1.08 |
| Stock Adjustments | 8.49 | -2.16 | 1.49 | 0.91 | -3.27 |
| Total Income | 211.27 | 130.23 | 154.2 | 127.94 | 70.94 |
| Raw Materials | 29.21 | 26.24 | 41.4 | 36.42 | 18.36 |
| Excise Duty | 19.28 | 9.7 | 16.73 | 16.92 | 9.28 |
| Power & Fuel Cost | 19.48 | 16.55 | 14.94 | 13.45 | 8.7 |
| Other Manufacturing Expenses | 6.3 | 8.54 | 6.46 | 4.34 | 4.27 |
| Employee Cost | 11.27 | 8.31 | 8.65 | 6.35 | 6.5 |
| Selling and Administration Expenses | 30.55 | 26.88 | 23.29 | 22.38 | 13.81 |
| Miscellaneous Expenses | 0.07 | 0.37 | 0.37 | 0.13 | 0.08 |
| Less: Preoperative Expenditure Capitalised | 0 | 0 | 0 | 0 | 4.12 |
| Profit before Interest, Depreciation & Tax | 95.11 | 33.64 | 42.36 | 27.95 | 14.06 |
| Interest & Financial Charges | 0.76 | 1.27 | 3 | 3.39 | 1.61 |
| Profit before Depreciation & Tax | 94.35 | 32.37 | 39.36 | 24.56 | 12.45 |
| Depreciation | 8.41 | 8.31 | 8.21 | 7.85 | 5.93 |
| Profit Before Tax | 85.94 | 24.06 | 31.15 | 16.71 | 6.52 |
| Tax | 28.02 | 7.86 | 10.5 | 5.93 | 2.18 |
| Profit After Tax | 57.92 | 16.2 | 20.65 | 10.78 | 4.34 |
| Particulars | Mar-11 | Mar-10 | Mar-09 | Mar-08 | |
| Debt-Equity Ratio | 0.05 | 0.12 | 0.41 | 0.7 | |
| Long Term Debt-Equity Ratio | 0 | 0.07 | 0.27 | 0.52 | |
| Current Ratio | 0.97 | 0.78 | 0.7 | 0.62 | |
| Fixed Assets | 1.15 | 0.75 | 0.86 | 0.73 | |
| Inventory | 15.18 | 15.53 | 17.99 | 21.99 | |
| Debtors | 8.97 | 8.14 | 10.19 | 9.31 | |
| Interest Cover Ratio | 114.08 | 19.94 | 11.38 | 5.93 | |
| Operating Profit Margin(%) | 47.67 | 25.53 | 27.93 | 22.16 | |
| Profit Before Interest And Tax Margin(%) | 43.45 | 19.22 | 22.51 | 15.94 | |
| PBDTM (%) | 47.29 | 24.56 | 25.95 | 19.47 | |
| Cash Profit Margin(%) | 33.24 | 18.6 | 19.03 | 14.77 | |
| Adjusted Net Profit Margin(%) | 29.03 | 12.29 | 13.61 | 8.55 | |
| Return On Capital Employed(%) | 79.69 | 30.61 | 39.03 | 22.6 | |
| Return On Net Worth(%) | 55.85 | 21.92 | 33.19 | 20.51 | |