Are you guys still using the momentum based portfolio? For last few months, momentum return hadn’t been great even though the market is ATH.
BTW - did any of you try to simulate/modify Gary Antonacci’s dual momentum? @sharmaudi - you had started this thread with this strategy - was there any reason to not continue with that?
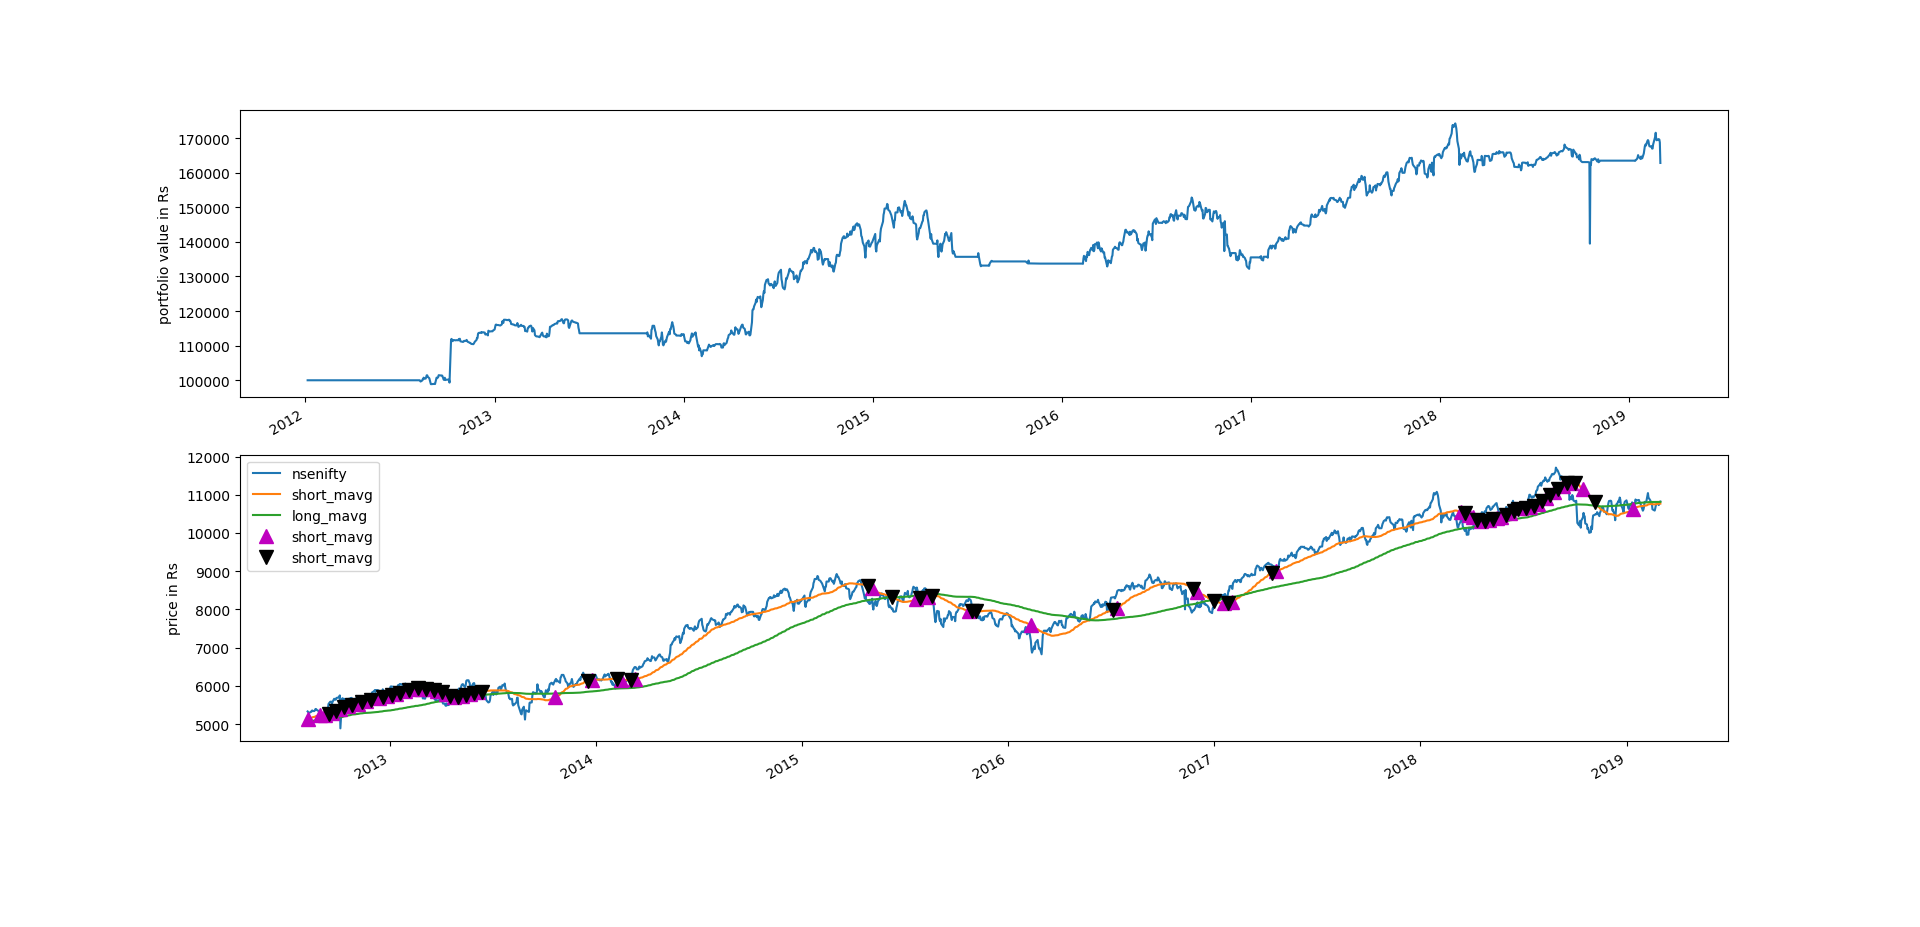
I tried to backtest momentum strategy…between Gold Bees, Nifty Bees…its out performance seems only on account of limited downside during GFC crisis…post 2009 returns are lower for this strategy
Is there a good resource or book that explains various trading strategies that we can experiment with? I couldn’t find a lot on the web. Zerodha’s varsity has an excellent starter on Pair Trading & a basic momentum system.
Thanks a lot. Could you also point me towards finding a free dataset for historical NSE / BSE prices? I see that Quandl has a NSE product but for some reason, the data is not updated from April 1 onwards.
I have done sector rotation backtests using various parameters. Dual momentum on sectors doesn’t work. Tried anti-DMS as well (choose the worse performer) no great result.
Key drawbacks of a dual momentum strategy include underperformance during periods of sideways or volatile markets, higher transaction costs due to frequent trading, and the risk of whipsaws or false signals. The strategy also involves psychological challenges for investors, as it may require them to move completely into or out of positions.
Specific drawbacks include:
Vulnerability to market volatility and “whipsaws”: Dual momentum strategies can underperform during sideways, choppy, or volatile markets. These markets can cause “whipsaws,” or false signals, that result in buying and selling at the wrong times, eroding gains.
Higher transaction costs: The strategy requires periodic rebalancing and potentially frequent trades, which leads to increased transaction expenses that can eat into overall profits. This is particularly an issue compared to buy-and-hold strategies.
Concentrated holdings: The strategy often results in holding a single asset class at a time, such as all U.S. stocks or all bonds. While this can enhance returns in favorable market conditions, it also means a lack of traditional diversification across multiple asset classes.
Psychological difficulty: Following a rules-based strategy, especially one that dictates switching between being “all in” on stocks and moving to a safer asset like bonds, can be psychologically challenging for investors. It may be difficult to stick with the strategy during periods of relative underperformance.
Suboptimal performance in late-stage bull markets: Momentum strategies often perform best when a bull market has a lot of steam left, but they may make for dicier investments in the later stages of a bull market.
Backward-looking data: Like all strategies based on historical performance, dual momentum relies on back-tested data, which does not guarantee future results.
Ignoring fundamentals: The strategy relies on price trends and ignores the underlying business fundamentals of assets, which can expose the portfolio to risks if trends suddenly reverse due to a company’s weak foundation.