
Great work Sharmaudi. Would be super helpful to all boarders if you could update thread when you strategy signals switches. Would be only 1-2 times a year I guess. Much appreciated.
Hi
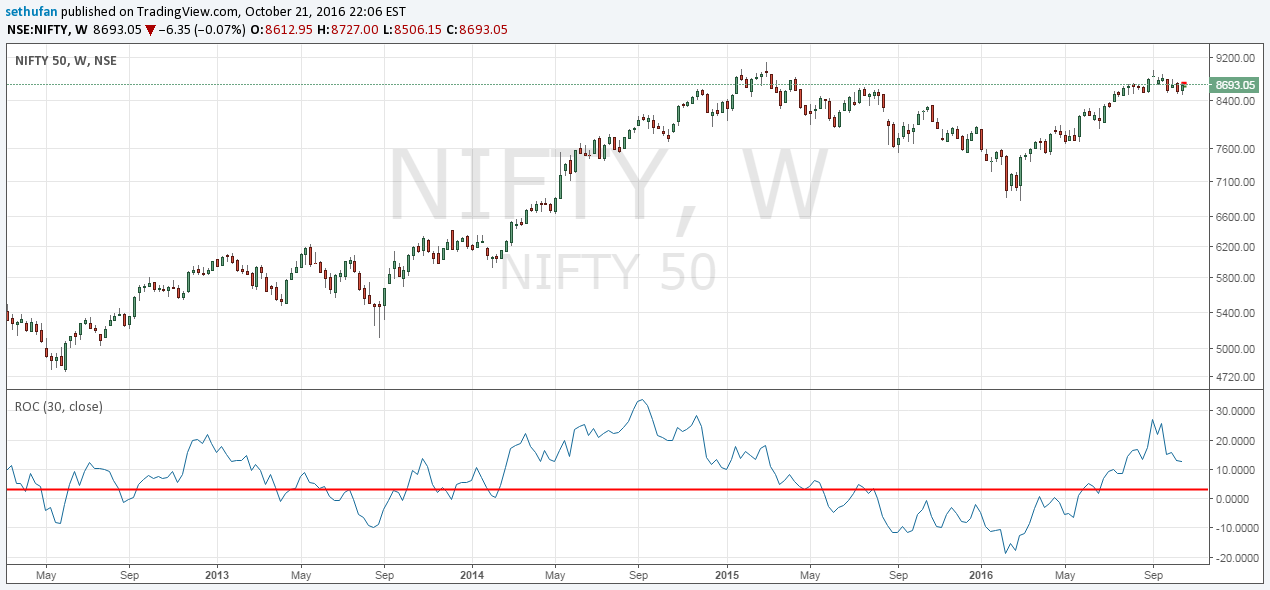
I have attached the Nifty chart taking ROC 30 as value and the red line is 3. From the chart, I find it does not offer any great value in trying to identify the entry/exit points. Am I making a mistake? I have used FIBO/EMA which has given me much better entry/exit points.
Please clarifty.
Thanks & regards
One more question. How do you handle whipsaws in that case. In my 30 years of trading/investing I have never used any of the indicators as I find them not very useful. I use a combination of price/ema/fibo which gives me good entry/exit points in Investing and Trading. This is applicable to stocks also. See my posts in the thread Alembic Pharma. The stock is an uptrend now after making a triple bottom.
A simple strategy for ETF would be to buy when the p/e in the low range and sell when p/e in the high range. This strategy has given me very good returns over the years.
Please give your views.
Thanks & regards,
1 Like
Found this post, not much activity here.
Is any one tracking it?
Is anyone implementing this strategy?
please share your views.
1 Like
What I see is that this strategy works better with CNXMIDCAP than NIFTY itself.
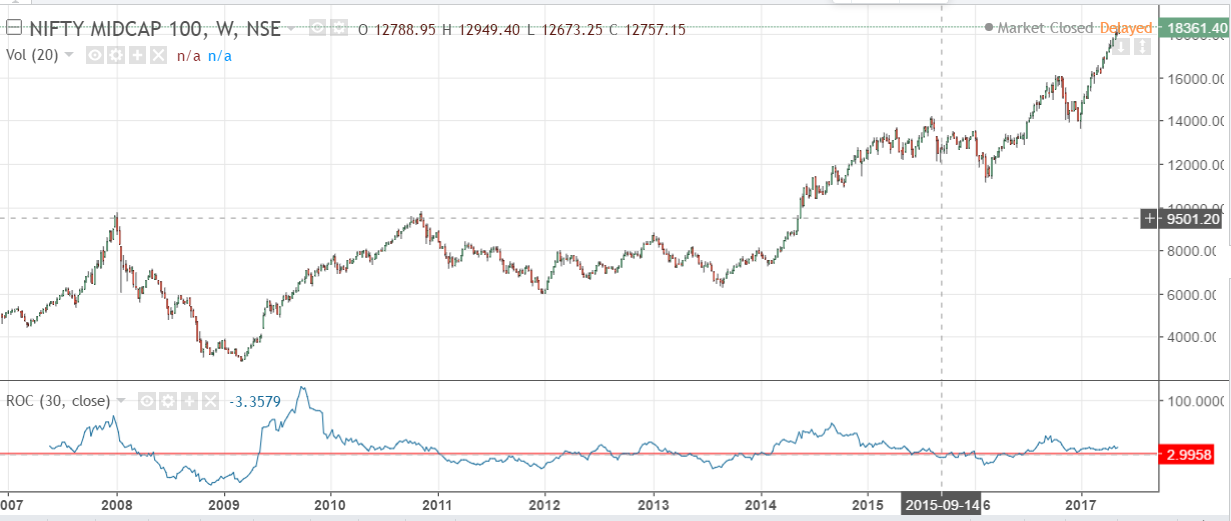
I assume this is because the biggest strength of the strategy is its ability to resist drawdowns. However, since we are invested in NIFTY the ROC will always be less. With Nifty Midcap, the ROC is greater than regular NIFTY
Are you familiar with Meb Faber’s work? He developed a momentum strategy based on his book “Ivy Portfolio” that works like this:
https://www.advisorperspectives.com/dshort/updates/2017/04/28/moving-averages-april-month-end-update
There are five ETFs representing
Total U.S. Stock Market
Foreign Stocks
Ten-Year Bonds
Commodities
Real Estate
Stay invested in whichever sector is above its 10-month moving average, move to cash in those that aren’t. It prevents big drawdowns, but tends to underperform S&P 500 in bull markets.
So he developed the sector rotation strategy. Explained here.
Invest equally in 3-5 stock sectors (out of 10 in the U.S. market) with the greatest upward momentum in the past three months (50-day average).
Rebalance monthly to remove those sectors that are no longer in the top 5 or are below their 200 day moving average. If the S&P 500 is below the 200-day moving average, move out of all stocks. I have been doing this with my U.S. portfolio and it performs much better than the Ivy Portfolio strategy and S&P 500 buy and hold strategy without the huge drawdowns. I set my stops at the 50-day moving average mark or 6%, whichever is higher.
Here’s my chart for the same, with the addition of Developed and Emerging Markets.
http://jjaiprakash.com/shiny/Market-Sector/#section-table
Perhaps you can select a few Indian sector ETFs and experiment with them.
2 Likes
Caveat: I follow sector rotation in my tax-deferred retirement accounts. In my taxable space, I follow a buy and hold strategy with three broad market indices.
I had to close my demat account and open a new one as I have recently become a PR in Australia.
I have been following a variation of this since October 2016 so not much to report on. So far the performance has been slightly better than NF and JNF. Can’t judge it yet as it’s been just 7 months.
First few weeks were really bad because demonetization happened just a couple of days after I started this.
When NIFTY is beating Gold, stocks are chosen based on a momentum and financial checklist. Basically I screen all the Nifty stocks that have Price < 400, ROC > 30, are near 52 weeks high. After that I take all the screened stocks through a fundamental filter. No manual research. All automated using Quandl DEB database. Overall Idea is that I should get fundamentally good yet undervalued stocks that are just starting to break out.
Once the stocks are chosen I basically follow the system mentioned in the book Weekend trend trader by Nick Radge. Its hardly 1-2 hours of work every weekend as the tools do all the work.
My Current portfolio looks like this. All have 5% allocations.
POLYPLEX
ORIENTREF
IVP
IFGLREFRAC
BALAMINES
DEEPIND
VAKRANGEE
PNBGILTS
DALMIASUG
SONATSOFTW
GRAPHITE
MAITHANALL
KRBL
ARROWTEX
NAVNETEDUL
NITINSPIN
GREAVESCOT
ALKYLAMINE
I plan to keep using this until at-least 3-4 years. The trading system that Nick has mentioned makes sense so I am confident that it will work out.
Good to see someone using Nick radge’s strategy in Indian market. Do you
have a backtested result of the strategy with you? Would be really helpful
if u can share it here. I’m a nincompoop when it comes to tech. So was
wondering how to backtests and implement that strategy in real life.
Thanks in advance
Here is the backtested return of the Nick’s strategy compared to NIFTY.

This is without any fundamental filters. Strategy is pretty much what the author has described:
Entry:
- ROC 20 > 30
- General market trend is up ROC 30 (NIFTY) > 3
- Price < 400
- Volume > 100000
- Price within 10% of 52 weeks high
Exit:
- 30% of HHV trailing stop loss
- Whenever general market trend goes down stop loss moved up to 10% of HHV
Position sizing:
- Max Positions - 20
- Allocations - 5%
On an uptrending market a lot of buy signals will be triggered every week(30 or more). This strategy just picks the companies with more ROC. This is where I want to apply the fundamental filters and pick only the ones that look good on fundamental charts.
3 Likes
Hi @sharmaudi,
Are you still continuing with this strategy? I am guessing 2017 had been an awesome year for you.
Could you please share your experience in actually implementing the system vs the paper trading?
Hi @sharmaudi, can you help us to arrive at shortlisting the stocks. Are you using any screener? screener.in doesn’t include the ROC indicator.
thank you
Hey @nusmu00,
I have been following this strategy and yes the last year has been really good. 2 years cagr has been over 30% thanks to some big winners. Managed to bag my first multibagger in graphite which has given me 9x returns in just 10 months.
Having said that… the last year has been really good generally. I am waiting for a downcycle to see how this strategy performs in a bear market.
I use amibroker for technical analysis(roc, hhv, stop loss) etc. I also use my own tool to check for fundamentals for the scanned stocks.
@sharmaudi - that’s fantastic! Congrats.
You mentioned that you use Quandl data for fundamentals. Isn’t that very expensive? Other than the expense part - the dataset seems to be updated yearly. Does that really help?
I have couple of questions on the system - hope it’s not too invasive:
- How much churn do you see with the system?
- In terms of practical usage - how do you allocate capital. In different tranche each week?
- How do you re-allocate the capital? If you have gained 3X and exited - what portion of that do you use for your next entry?
Also - did you try to apply out dual momentum in Indian market context?
Quandl(DEB) is expensive but I like it because it allows bulk download of the entire database. I am building my own screening/analysis tool and need the financial data to be in my own database. They update the data quarterly and not annually. Do let me know if you know of any other cheaper data provider that allows bulk downloads.
Churn - Do you mean frequency of trades? Sorry I am newbie in investing and don’t understand all of the terms.
Capital allocation - As I am just getting started with the stock market, I wanted to keep this simple. I allocate 5% of my portfolio to each stock. I don’t buy more than 2 positions each week even if there are lot of signals generated by my system. Initial allocation doesn’t really mean anything because as the market moves the weights start to change and profitable companies start having more weight in the portfolio. I don’t do any restructuring/scale outs but have been reading about it.
Maintaining 5% of portfolio allocation is easy but in order to make it even easier I follow a simple rule. Say I started with 10Lacs. This means I have 50k to be allocated to each stock. I will keep this at 50k until my portfolio is profitable by 1 Lac. After that, I will increase my positions to 55k and so forth.
Capital reallocation is also a problem that I am facing. There are two problems that I really need to figure out:
1.) If I am invested 100% and sell company x for a loss, then I don’t have enough funds to buy my next position with 5% weight. So far, if this happens, I have been putting in additional money in my portfolio just to allow me to buy the proper weight. I checked out Amibroker’s backtesting and it has 2 options:
a) Skip the trade altogether,
b) Shrink position size.
2.) If I am invested 100% and sell company x for a gain, then I have extra funds after my next position. I dont have a good solution to this. Maybe keep the cash and increase sizes only on the new trades? This will mean market exposure goes down which might be a good or a bad thing. What do you think?
Do let me know if you have some ideas. As I said, I am a newbie so don’t have the proper knowledge/experience to have a perfect answer to these questions.
Just to summarize what I read, I thought of simulating it in simple model to crystallize my understanding. Excel table captures the logic and graph shows the performance.
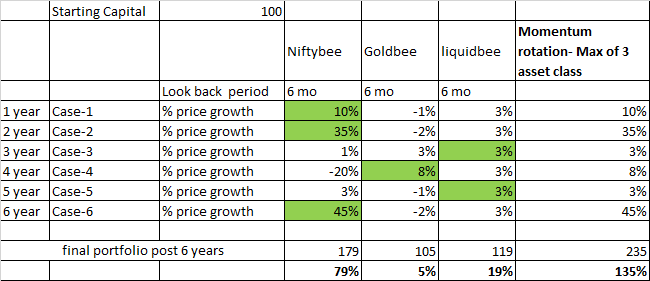
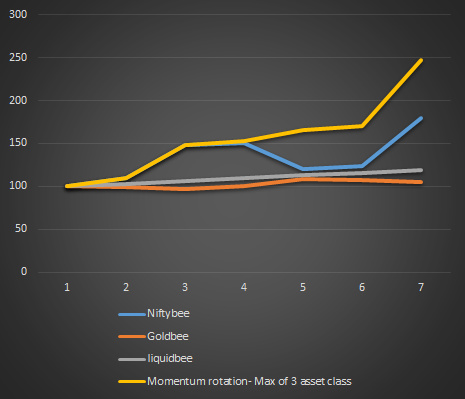
However, We should deduct approx 3% entry exit @ 4 times so approx 12%. Timing cant be accurate so leaving some money on the table at each transition, e.g. 15 % of overall returns, This leaves rotation momentum with 12%+15%=27% reduction. so total net would be approx 108%. If STCG tax then further reduction may be 8-10%…so overall gain around 100% as against B/H equity of 79%.
The alpha of rotation strategy is prominent only in long term, that too when there are 1-2 deep correction.
Regarding Quandl (DEB) - do you think it provides any additional value or ratio over something like screener or ratestar.in? Quandl api is fantastic and I would subscribe to it in a heartbeat if I could justify the price.
Regarding data refresh, I was checking the one from TCS or Infosys - and all I could see is yearly data 12 records since 2005. Once you are a paid subscriber, do you get to see more details (maybe quarterly)?
Churn is basically portfolio change - more churn means more tax, brokerage etc. I would be curious to know what has been average number of entry/exit for this system.
For capital allocation, I think you are on right track. I would probably have followed this too. I think there could be couple of approaches,
- You keep total allocation fixed with a buffer. Say 10 lakh + 2 lakh buffer. Whenever you hit a loss you refill from that 2 lakh bucket till it is completely exhausted. Then you cut down your capital to 8 lakh + 2 lakh and so on. Similarly when you make a profit you fill your buffer and recapitalize your system once your portfolio reaches to (X) + 4 lakh. Then onwards you start deploying your capital for all new position as if your capital is 12 lakh + 2 lakh buffer …
I think this is conservative, simple to implement and give easy tracking. - Use a formula like Kelly to determine the “edge” of your system from backtest. If you have enough sample size you can get a fair idea of what %of your capital you should allocate for each new bet (or new position). For the first few entries they will have similar position size but gradually allocation will be more (or less) depending on how much profit/loss you have made in your last exit.
It is not extremely difficult to implement but needs some coding expertise and things can get real messy. But the advantage is that the system quickly adjusts itself by betting big with large winnings and betting less when system is significantly in loss.
Personally I would use option 1 for it’s sheer simplicity and a a very crude and toned down version of 2.
Let me know what you think.
I don’t think it adds any additional value over screener if you want to analyse a company manually. I wanted to have all the financial database available with me so that I can do automated bulk analysis quickly. For this also, I can still use screener or ratestar apis as both of them are API driven but it doesn’t seem ethical to use their API that way. Also, as you are paying for it you get good support from the Quandl team.
As I said I am using my own tool to shortlist the stocks every week. My workflow is:
- Scan for new signals in Amibroker based on Nick Radges Weekend trader method.
- Export the signals a text file dropbox
- After this, my tool automatically picks up the file and runs fundamental checks on the companies. At the end of all of it I get a nice ui like this:
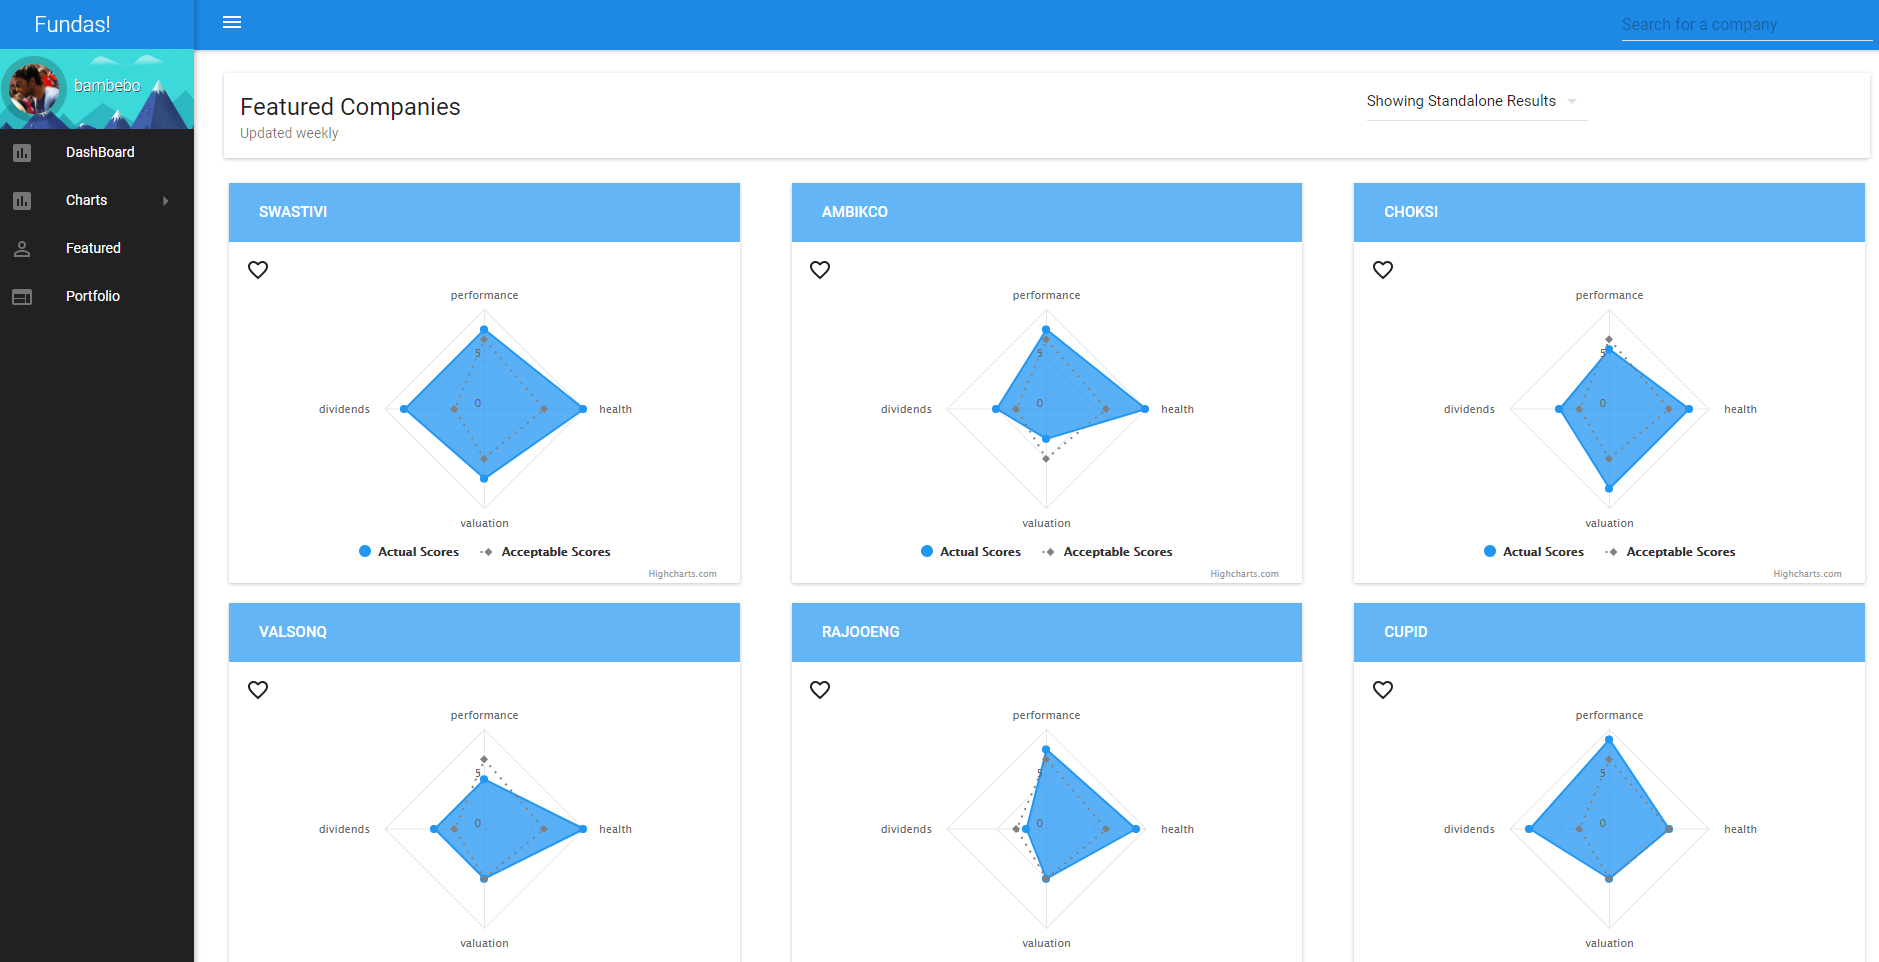
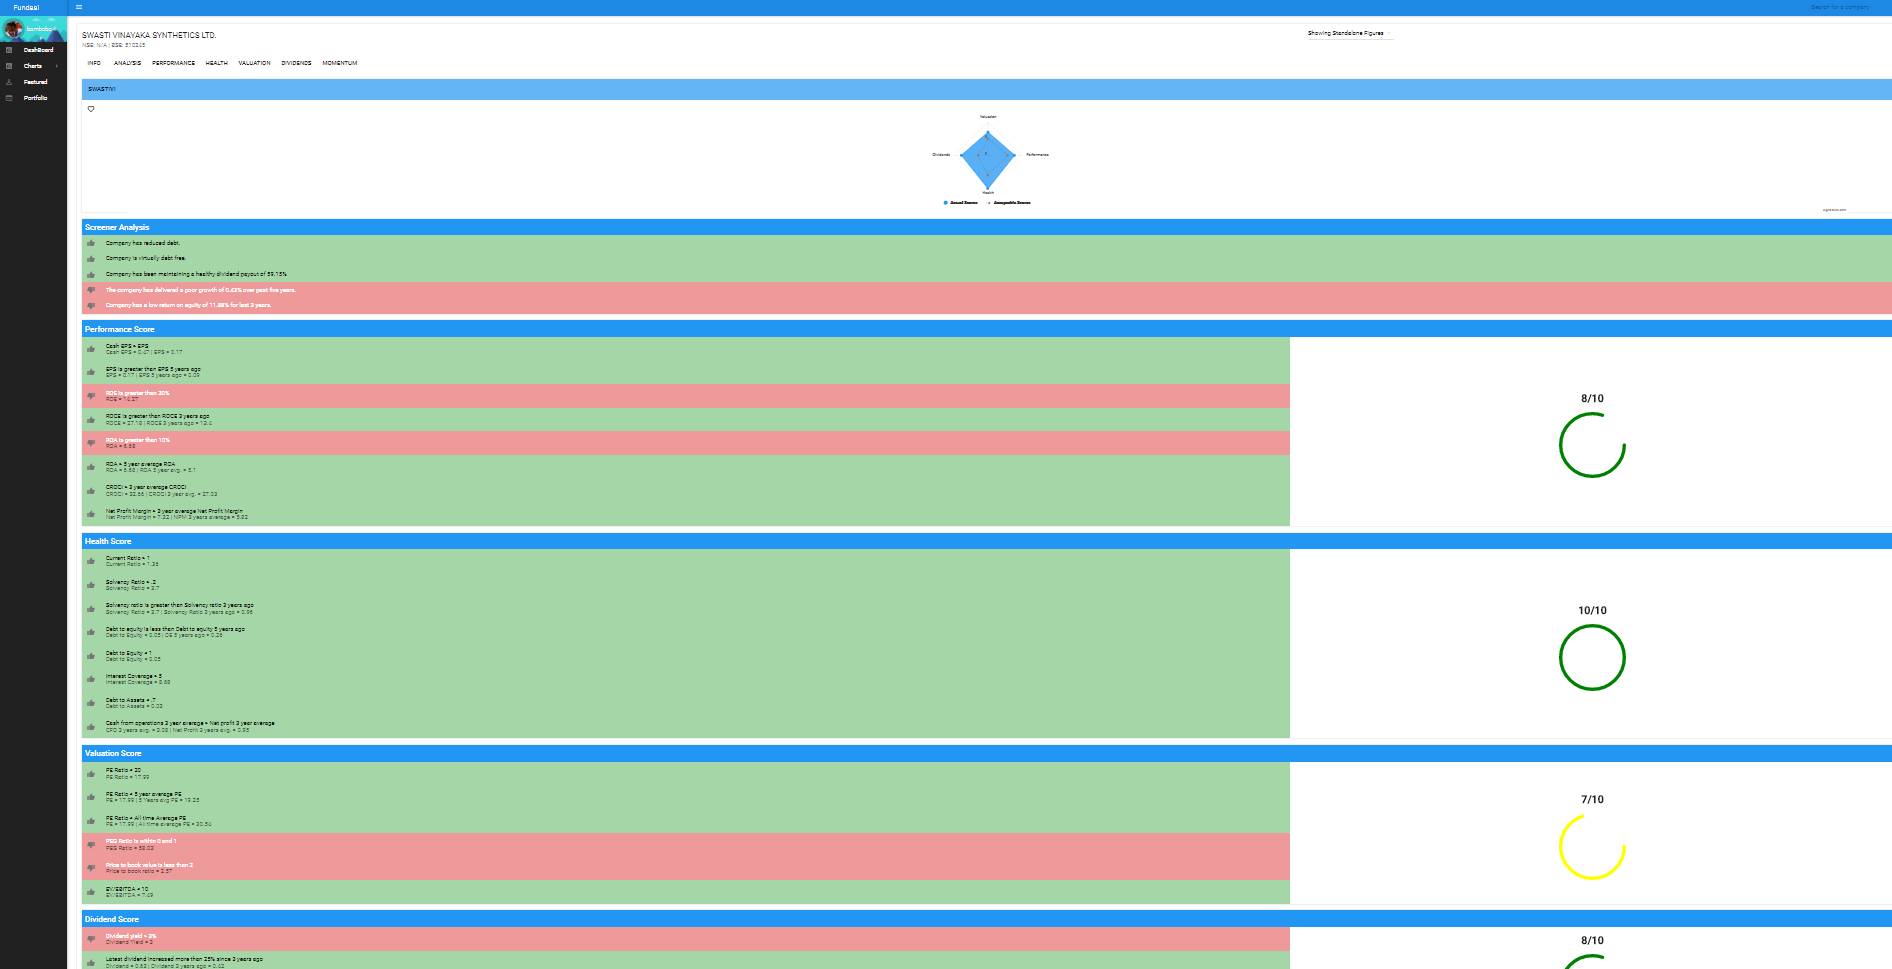
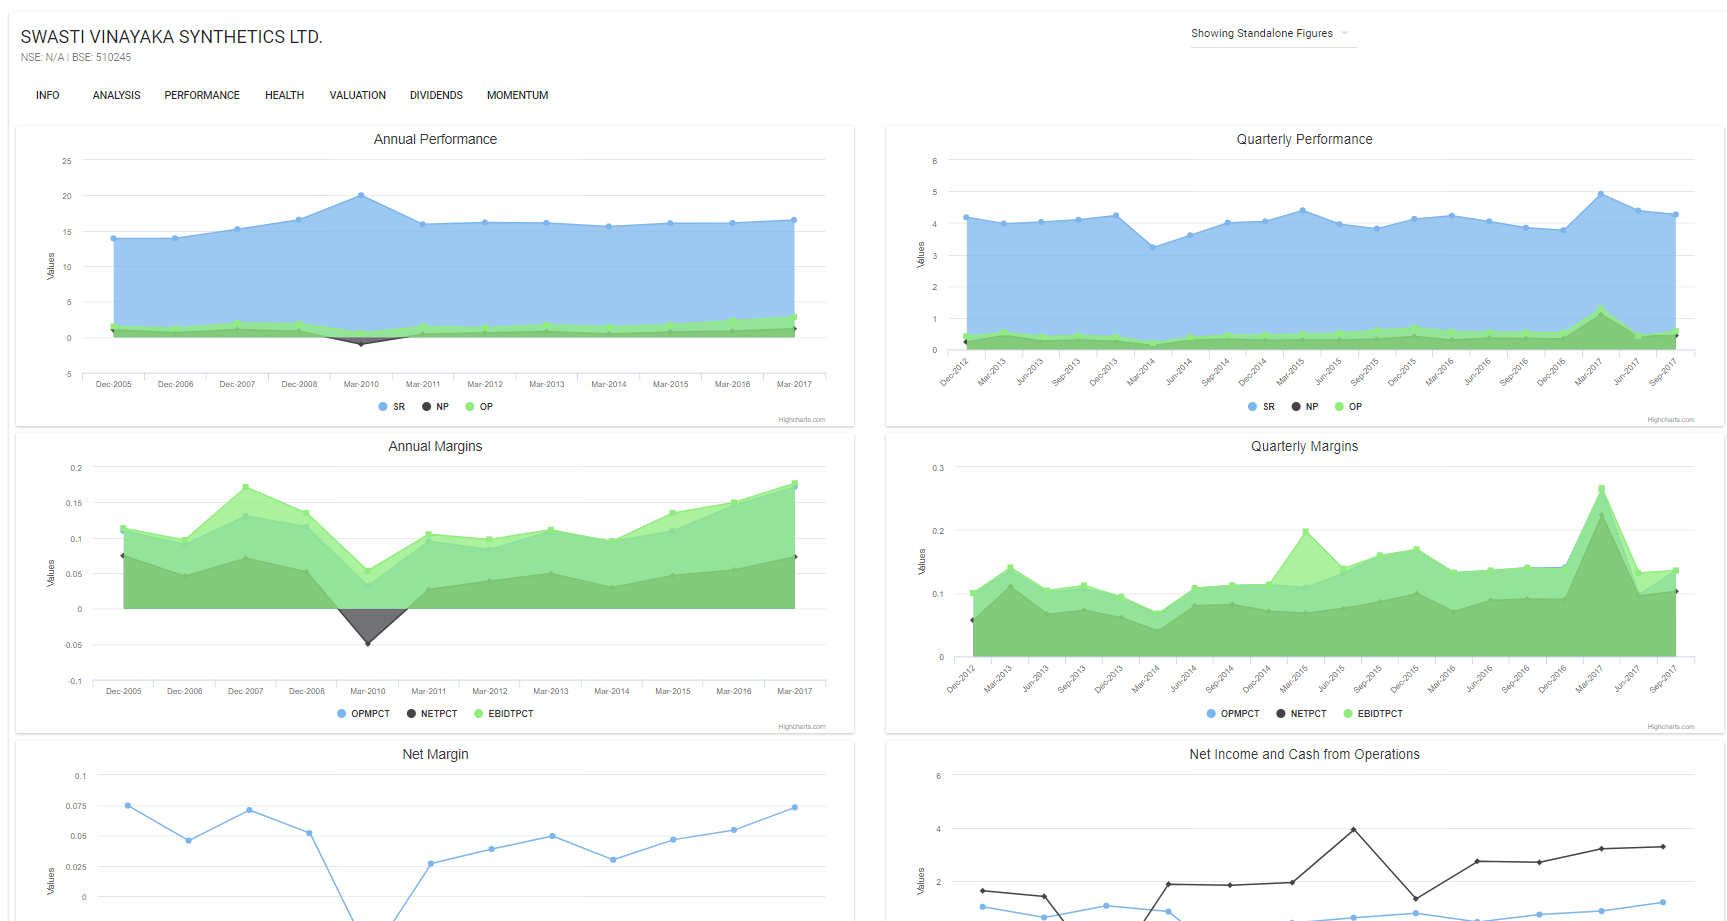
I dont really look at a lot of details fundamentally. Don’t really want to get emotionally biased towards a company. I have a traders mindset and skills and want to stick with that.
1 Like
Looks awesome. Is it R-Shiny based?
I will definitely look into Quandl DEB as it would take a lot of overhead out of the way. Would you mind checking the links from my above posts and check if you can find the quarterly details (or you can get the data in the quarterly level using the API). For some reason, it shows just the yearly data and this defeats the purpose.