One Mobikwik Systems Ltd was founded by Bipin Preet Singh (MD & CEO) and Upasana Taku (CFO), who have prior experience in building scalable technology and financial products.
It is a platform business at its core, that has a two-sided payments network, consisting of consumers and merchants. The Company has evolved from a payments only business to a multi-product business across financial services.
MobiKwik is serving 183 million users and 4.7 million merchants with payments and distribution of financial services
They emerged as the #1 digital wallet player in India, with payments GMV growing 203% YoY and total income rising 34% YoY to Rs 1,164 Crores in FY25. This remarkable growth was achieved with an EBITDA loss of only Rs 109 Crores, majorly incurred in the second half due to headwinds in the personal loans segment.
IPO Details - The IPO was a book-built issue worth Rs 572 crores (Fresh Issue), mainly earmarked to deploy on sound boxes and DLG component of loans.
Cash on books – 475 Cr (excluding Guarantee related FD)
The stock has corrected almost 65% from the top post the listing.
Business Verticals:
1) Payment’s business:
The payments vertical strategy is to acquire consumers and create a large merchant acceptance network for them so that they can pay conveniently via the MobiKwik Application. Being a two-sided network, it empowers consumers and Merchants across the country for daily life payments.
• Consumer side: The MobiKwik Application provides the Registered Users a simple, fast, safe and reliable way to pay via Wallet. UPI, Pocket UPI, cards and net banking for multiple use cases.
• Merchant side: Large Merchant network includes online websites and apps, where (i) MobiKwik is a payment option in the checkout and physical retail stores; and (ii) MobiKwik is a QR code payment option at the POS/cashier.
Payment Aggregator / Payment Gateway (Zaakpay)
• In addition to the two-sided MobiKwik payment business, they also operate, through their subsidiary Zaakpay, a B2B payment gateway offering for e-commerce businesses. An important component of the payment growth strategy involves the pursuit of scaling the existing payment aggregator business Zaakpay, housed in their Subsidiary, Zaak ePayment Services Private Limited.
2) Distribution of Financial Services Business:
a) Digital Credit Products: The Digital Credit Products - ZIP EMI, Merchant Cash Advance (MCA), First Card and risk-free distribution of loans and credit cards provide accessible and affordable credit to middle-India population for all manner of spending.
• Personal Loans (DLG Model): ZIP EMI and MCA are interest-bearing, 3 to 24 months tenure and ticket size between Rs 10,000 to Rs 200,000 products. Revenue from this product is primarily earned through sourcing and collection fees from the Lending Partners (total 3-5% of the disbursals) . Interest rates on ZIP EMI typically range between 18% and 36%.
• Secured Credit Cards: MobiKwik has partnered with banks for a FD-backed Rupay credit card. This cobranded credit card will cater to individuals with limited or no credit history and help in building a credit score.
• Marketplace Model: They have partnered with banks and NBFCs to offer loans and credit cards to the large user base on the risk-free distribution (Non-DLG) model to the 176.40 million Registered user base.
3) Wealth distribution: It caters to consumers who want to generate returns by deploying funds in simple financial products with low volatility.
Lending Partners - They have partnered with multiple lending institutions, including Unity Small Finance Bank Limited, TVS Credit Services Limited, Hero Fincorp Ltd., Poonawalla Fincorp Limited, SMFG India Credit Co. Ltd. Suryoday Small Finance Bank Limited, Northern Arc Capital Limited, MyShubhLife (Datasigns Technologies Private Limited), Krazybee Services Private Limited, Vivriti Capital Limited and Transactree Technologies Private Limited.
Their payments business is the foundation stone for their distribution of financial services business. It acts as top of the funnel through which they acquire new users who come on their platform for making daily life payments.
Addressable Market:
1/3rd of Indian households are using digital payment in one way or another
Based on Redseer analysis, non-cash transactions for Indian households are going to increase from 38% in FY23 to 62% in FY28. With UPI being the corner stone of transition, which accounts for 73% of total digital transactions in India in FY23, is estimated to exceed 90% by FY28.
Merchant payments has emerged as key driver for digital payments:
Beyond e-commerce, mom-and-pop stores are also increasingly embracing digital payment solutions. From small kirana stores to large retail chains, businesses are recognizing the benefits of accepting digital payments. Based on Redseer estimates, ~90% of the merchants in India would be digitally enabled by FY28.
| Particulars |
FY21 |
FY23 |
FY24 |
FY28E |
| Volume of Digital Transactions (Bn) |
44 |
114 |
154 |
500-550 |
| Value of Digital Transactions (USD Tn) |
18 |
26 |
30 |
60-70 |
Source: DRHP
Fintech players are driving digital payments through new initiative
For payment, platforms generally charge MDR to merchants only in case of POS/payment gateways, UPI is still free in India. Payment platforms have expanded their offerings to offer payment, commerce, and financial services. Majority of them started as wallet players with an application to provide mobile top-up and bill payments. Few players also expanded to payment gateways to create a large base of online consumers and merchants. In following years, they expanded to value added services such as commerce and financial services.
At present, the digital lending ecosystem in India is in its nascent stages, marked by a relatively low base in comparison to traditional lending channels, but its growth is gaining considerable traction. The prevailing contribution of digital lending of around 2% highlights the room for expansion and adoption that exists within the digital lending sphere. The total value of disbursed loans saw a surge of about 41% when compared to FY21, increasing from USD 5.8 Bn in FY21 to USD 11.6 Bn in FY23.
Headwinds faced in the last 3-5 quarters:
• Mobikwik ZIP is a 30-day interest-free product with a ₹ 1,000 to ₹ 60,000 credit limit available to eligible consumers. These limits are powered by their Lending Partners. At the end of the billing cycle, a consumer is required to pay the due amount within five days, failing which late fees and daily interest on the overdue is charged. The consumer is also charged a lifetime activation fee in the first bill. The company has been scaling down this product since the last few quarters and has paused the ZIP product in Q1FY2026 due to lower lenders appetite.
• Lending & BNPL (Buy Now Pay Later) : RBI cracked down on peer-to-peer (P2P) lending and imposed stricter credit guidelines. Mobikwik discontinued smaller high-risk BNPL loans and is now scaling longer tenure, larger ticket EMI loans with better risk models, improving profitability.
• Accounting Changes in Financial Services vertical (DLG): Mobikwik introduced important accounting changes in 2025 that are expected to improve its margins over time. Here’s a detailed explanation in simple terms, with examples: Mobikwik offers loans through partners and guarantees repayment if borrowers default. These are called DLG loans (Default Loss Guarantee). Previously, Mobikwik only recorded losses when a borrower actually defaulted, but this got changed in 2023-2025 following RBI guidelines. FLDG means the fintech (Mobikwik/Paytm) guarantees to cover the first loss up to a certain percentage (like 5%) on loans given through their platform. The scale up of DLG loans resulted in increased upfront costs since Q3FY25, which are already in the base.
Now, under new accounting rules effective from May 2025, Mobikwik must record the estimated potential default loss upfront as an expense, and not wait until a default actually happens.
This means the company shows a more realistic, conservative view of its financial health by recognizing risks earlier.
Why Were These Changes Needed?
• Before these changes:
Mobikwik could look profitable for some quarters if no defaults happened and then suddenly show big losses once defaults occurred.
This led to a mismatch in profits and expenses and made it difficult for investors to judge the company’s real financial condition.
• With the new accounting style:
Mobikwik’s expenses are more aligned with actual risks right from the start.
This avoids large sudden surprises and evens out profits and losses over time.
How Does This Lead to Improvement in Margins going forward?
Although Mobikwik showed bigger losses initially due to upfront expenses, it avoids unpredictable losses in the future.
Over time, as loans get repaid, these upfront expenses are adjusted, improving margins and giving a clearer profit picture.
Mobikwik expects to reach a gross margin of ~40% in lending vertical by the second half of FY26, as default risks normalize and loan quality improves.
Growth levers:
- Pocket UPI (Payments): Pocket UPI offers an enhanced approach to UPI, combining the extensive wallet network of MobiKwik with the vast merchant network of UPI. It features industry-leading capabilities such as UPI transactions without linking a bank account, PIN-less instant payments, and uninterrupted functionality even during bank outages, making it well-suited for wider user adoption. Industry is in consultation with the regulatory bodies for the introduction of interchange fee on PPI which was first proposed in 2023 and there is likelihood of interchange fee on PPI transactions being implemented on wallet in the near term (3-6 months), this would prove to be beneficial for the payments business.
- Zaakpay is a payment gateway platform developed and owned by Mobikwik. Zaakpay charges transaction fees (Merchant Discount Rate or MDR) on every payment processed. These fees vary typically between 0% to 2.9% depending on the payment method and merchant agreements. On April 30, 2025, Zaakpay received the final Certificate of Authorisation from RBI to operate as an online payment aggregator legally and fully resume its PA services. The management expects to scale this up in the next few years.
- Scaling up the ZIP EMI product - The whole fintech sector faced regulatory issues in previous quarters. Currently almost 70-80% of the digital credit GMV is through loans distributed on a DLG model. The overhang of the scaling down of the ZIP product is already over. They have to now onboard new lending partners and scale up the ZIP EMI product.
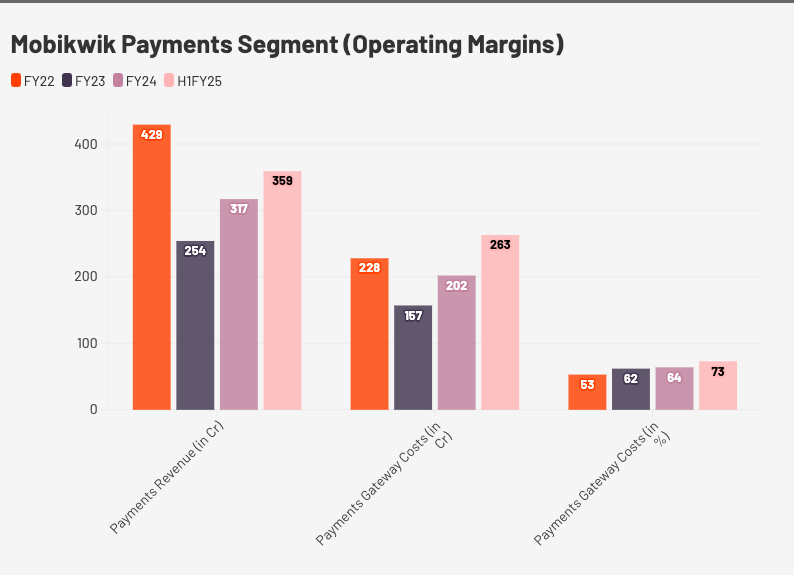
Direct costs in both the verticals:
- Payment Gateway cost is the direct cost for the payments business
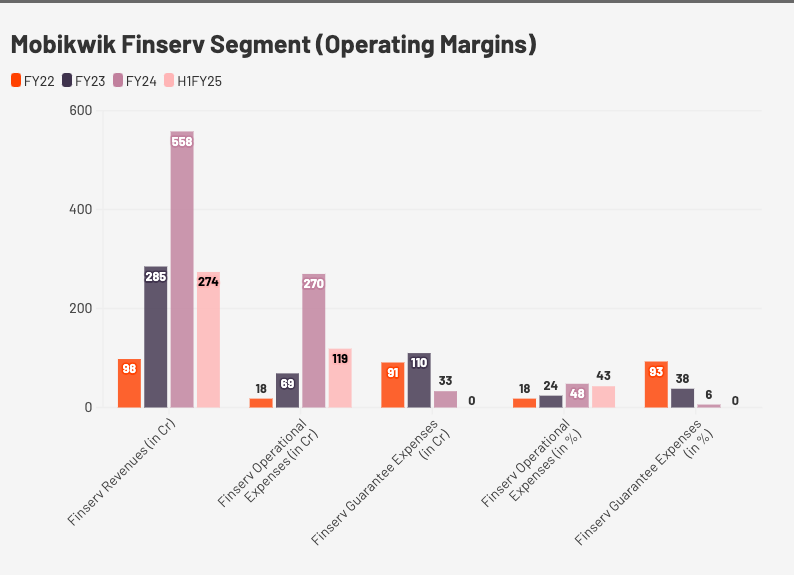
- Lending operational expenses and Financial Guarantee Expenses: They are the direct costs related to the Financial Services vertical.
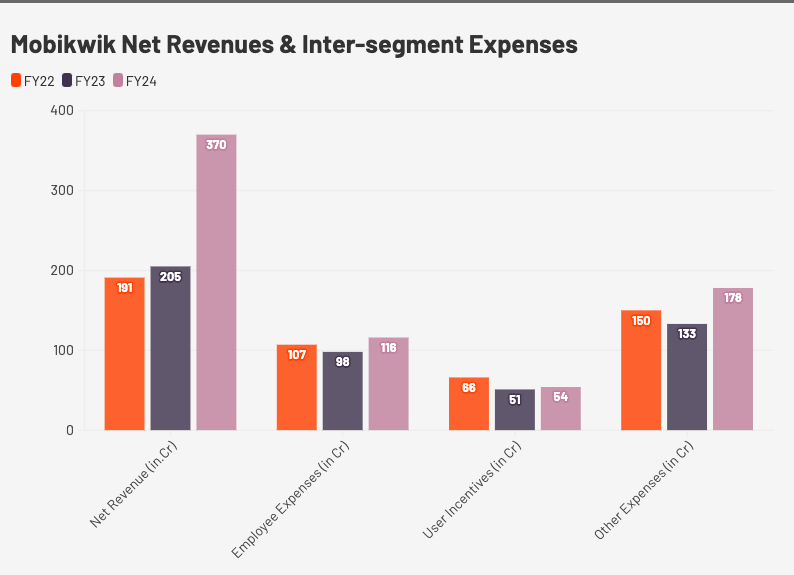
Segmental Revenue:
| Particulars |
FY21 |
FY22 |
FY23 |
FY24 |
FY25 |
| SEGMENTAL REVENUE (INR in Cr) |
|
|
|
|
|
| Payments Revenue |
229 |
429 |
254 |
317 |
767 |
| Financial Services Revenue |
60 |
98 |
285 |
558 |
403 |
| Other Income |
13 |
16 |
22 |
15 |
22 |
| Total Revenues |
302 |
543 |
561 |
890 |
1193 |
*1) Payments Vertical:
| Particulars |
FY23 |
FY24 |
FY25 |
| Unit economies of Payments Business (Bps) |
|
|
|
| Payments Revenue (as a % of Payments GMV) |
123 |
83 |
66 |
| Payment Gateway Costs (as a % of Payments GMV) |
-76 |
-53 |
-48 |
| User Incentive Costs (as a % of Payments GMV) |
-25 |
-14 |
-5 |
| Net Payments Margins |
22 |
16 |
13 |
| Particulars |
FY21 |
FY22 |
FY23 |
FY24 |
FY25 |
| Payments Business - KPI |
|
|
|
|
|
| Payments GMV (Mn) |
1,18,350 |
1,79,474 |
2,07,250 |
3,81,955 |
11,58,681 |
| Payments Take Rate |
1.9% |
2.4% |
1.2% |
0.8% |
0.7% |
| Gross Margins - Payment Services (%) |
9% |
31.6% |
18.2% |
19.4% |
19.7% |
| Particulars |
Q3FY25 |
Q4FY25 |
Q1FY26 |
Q2FY26 |
| Unit economics of Payments Business (Bps) |
|
|
|
|
| Payments Business (as a % of Payments GMV) |
67 |
64 |
55 |
48 |
| Payment Gateway Costs (as a % of Payments GMV) |
-49 |
-44 |
-37 |
-31 |
| User Incentive Costs (as a % of Payments GMV) |
-5 |
-4 |
-3 |
-3 |
| Net Payments Margin |
13 |
16 |
15 |
14 |
|
|
|
|
|
| Particulars |
Q2FY25 |
Q3FY25 |
Q4FY25 |
Q1FY26 |
Q2FY26 |
| KPI |
|
|
|
|
|
| Payments GMV (Bn) |
282 |
294 |
331 |
384 |
432 |
| Payments Gateway GMV (Bn) |
18.3 |
9.4 |
9 |
7.8 |
9 |
| Payments Take Rate |
0.7% |
0.7% |
0.6% |
0.6% |
0.5% |
| Gross Margins - Payment Services (%) |
19.2% |
18.9% |
23.9% |
27.9% |
29.4% |
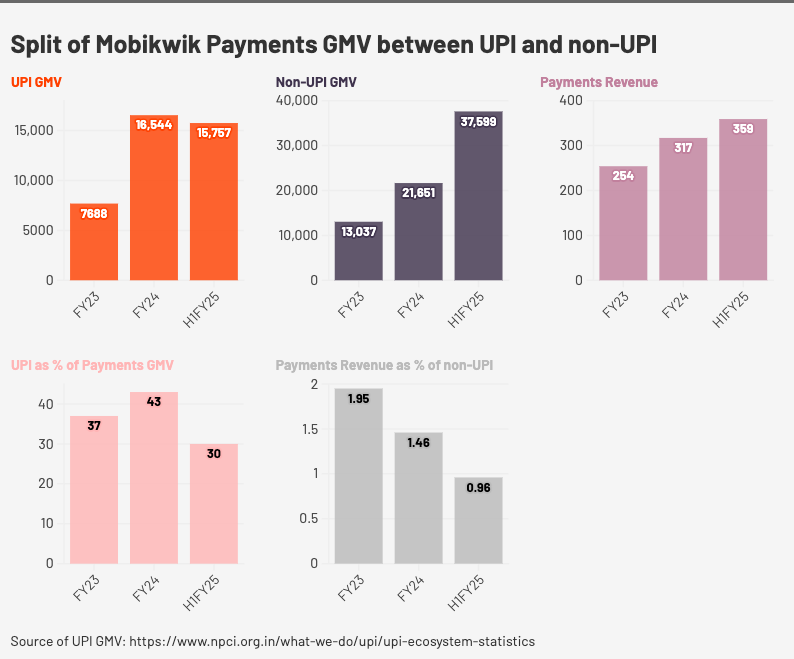
The payments GMV is INR 432 Bn as on Q2FY26 and INR 1,159 Bn for FY25 and has been growing at a 77% CAGR from FY21 to FY25. UPI contribution now almost 40% of the total payments GMV. There is no monetization currently for UPI and as and when the UPI contribution will increase in the mix, the take rates will go down, but they don`t have to pay any payment gateway costs for the UPI transactions, so the net payment margins are expected to remain the same.
Payments GMV can keep growing at more than 35-40% CAGR; though because of higher mix towards UPI, the take rates are declining and can continue to do so. However, the optionality here, is the Pocket UPI product of theirs which is growing at a much faster rate and it is expected that charging an interchange fee will be allowed in the near term, which can help them monetize better and stabilise the take rates.
However, the important thing to note, is that management has reiterated that they can maintain 15 bps net payments margin.
They have ensured that their processing margin is 15 basis points which is industry leading. Their contribution Margin percentage is also 28% which is their lifetime high, and their intent as a company would be to stay in that 22-25% range.
Zaakpay, right now though not significant, is growing well and should scale up very well by next year.
2) Financial Services Vertical:
| Particulars |
FY22 |
FY23 |
FY24 |
FY25 |
| Financial Services KPI |
|
|
|
|
| Revenue from Financial Services (Mn) |
977 |
2,850 |
5,579 |
4,028 |
| Financial Services Gross Margins % (as a % of Financial Services Revenue) |
|
38% |
46% |
47% |
| Financial Services Take Rate |
6.5% |
5.6% |
6.1% |
7.5% |
|
|
|
|
|
| Digital Credit GMV (Mn) |
15,122 |
51,150 |
90,934 |
53,583 |
| ZIP EMI GMV (Disbursements) (Mn) |
1,636 |
10,121 |
30,232 |
24,774 |
| ZIP GMV (Disbursements) (Mn) |
13,486 |
41,028 |
60,702 |
28,809 |
| Particulars |
Q3FY25 |
Q4FY25 |
Q1FY26 |
Q2FY26 |
| Financial Services vertical KPI |
|
|
|
|
| Revenue from Financial Services (Mn) |
73 |
56 |
58 |
61 |
| Financial Services Gross Margins (as a % of Financial Services Revenue) |
10.1% |
4.3% |
13.3% |
41.8% |
| Lending related expenses |
66 |
54 |
51 |
36 |
| Lending related Expenses (as a % of Digital Credit GMV) |
9.3% |
7.9% |
7.3% |
4.4% |
| Particulars |
Q2FY25 |
Q3FY25 |
Q4FY25 |
Q1FY26 |
Q2FY26 |
| Digital Credit GMV (Mn) |
16,260 |
7,047 |
6,809 |
6,931 |
8,071 |
| ZIP EMI GMV (Disbursements) (Mn) |
6,758 |
3,979 |
5,272 |
6,931 |
8,071 |
| ZIP GMV (Disbursements) (Mn) |
9,501 |
3,068 |
1,538 |
0 |
0 |
|
|
|
|
|
|
| Financial Services Take Rate |
6.3% |
10.4% |
8.3% |
8.4% |
7.6% |
| Gross Margins - Financial Services (%) |
48% |
10% |
4% |
13% |
42% |
| Lending related expenses |
4.1% |
9.3% |
7.9% |
7.3% |
4.4% |
| Particulars |
Q1FY25 |
Q2FY25 |
Q3FY25 |
Q4FY25 |
Q1FY26 |
Q2FY26 |
| Financial Services Cost Structure (Mn) |
|
|
|
|
|
|
| Operational Expense |
924 |
176 |
248 |
411 |
292 |
128 |
| Financial Guarantee Expenses |
25 |
64 |
172 |
127 |
214 |
229 |
| Total |
949 |
240 |
420 |
538 |
506 |
357 |
Unit Economics:
Gross revenue (NIM + processing fees) ~8-10.5% of disbursements; net margin after credit cost (~4-5%) and other costs, is 4-5%.
FLDG Model: 3-5% FLDG provided to lending partners, across most contracts.
Financial Services – lending related expenses have come down from 7% to 4%.
The financial services revenue which saw a degrowth in FY25 due to credit cycle turning bad, RBI crackdown on BNPL loans, scaling down of the ZIP product and scaling up of loans through the DLG model; has set a base and can grow sustainably from here.
The Digital Credit GMV as on Q2FY26 is Rs 807 Cr and is having a 13-15% sequential growth, based on which they can close FY26 at a Digital credit GMV of Rs. 3,500 Cr.
The management has guided that 8-8.5% can be the take rates in the Financial Services vertical and the aspiration is to reach 10%. The lending operational expenses and financial guarantee expenses, both together will be 4% of the GMV, which will lead to them clocking 40% Contribution margins in this vertical.
After the scaling down of the ZIP product since the last few quarters, now they have to scale up the ZIP EMI product.
The management has guided to reach at a quarterly revenue run rate of 150 Cr in the financial services vertical in the next Financial year, which currently is roughly around 60 Cr. This vertical will be the revenue growth driver.
| Particulars |
Q2FY25 |
Q3FY25 |
Q4FY25 |
Q1FY26 |
Q2FY26 |
| Contribution Profit (Mn) |
1,180 |
730 |
636 |
774 |
961 |
| Contribution Margins (%) (as a % of Total Income) |
40% |
27% |
23% |
27% |
34% |
| Particulars |
Q2FY25 |
Q3FY25 |
Q4FY25 |
Q1FY26 |
Q2FY26 |
| Fixed Costs (Mn) |
1,111 |
1,157 |
1,094 |
1,086 |
1,025 |
| Fixed Costs (as a % of Total Income) |
37.8% |
42.1% |
39.3% |
38.6% |
36.7% |
Fixed costs per quarter are at a run rate of Rs 100 Cr, so the annualized fixed cost will be in the range of Rs 400-450 Cr.
They are well-positioned to deliver a strong year in terms of growth and achieving break-even EBITDA in the last two quarters of FY26. Just like all the other new age businesses, Mobikwik is on track to become EBITDA Positive in FY27.
Even if they are able to get to 1,300 Revenue in FY27 with 39% Contribution margin (Contribution Profit of Rs 507 Cr) and after deducting the 450 Cr of fixed expense, they can clock an EBITDA of 50-70 Cr for the full year FY27.
Q2FY26`s performance was in line with their guidance in terms of improvement in the EBITDA. There was a write off (one off) of almost 12 Cr this quarter. They experienced a significant fraud incident in September 2025 where a technical glitch incorrectly marked failed transactions as successful, leading to unauthorized pay-outs of approximately ₹40 crore to certain merchants in Haryana. The losses look widened due to this one off.
Competition:
It faces intense competition, principally from other mobile wallet companies, financial technology companies, payment service providers, including commercial banks that issue payment cards or provide QR codes for payments, and, digital lending companies and companies providing similar technology or distribution-driven financial services in India.
Key competitors across their business segments include organisations such as: (i) Payments, bills and recharge– PhonePe, Paytm, Airtel Payments Bank and Freecharge, and others; (ii) Lending – PhonePe, Paytm, Freecharge and Amazon Pay; and (iii) Investments – PhonePe, Paytm and Freecharge
Peer (Fintech players) Valuation:
| Particulars (FY25 Figures) |
PhonePe |
PayTM |
Razorpay |
Pinelabs |
Mobikwik |
| Sales (Cr) |
7,115 |
6,900 |
3,783 |
2,274 |
1,164 |
| EBITDA (Cr) |
-413.6 |
-1,506 |
|
218 |
-107 |
| EBITDA Margins (%) |
-5.8% |
-22% |
|
10% |
-9% |
| PAT |
-1,727 |
-663 |
-1,209 |
-145 |
-122 |
|
|
|
|
|
|
| Price/Sales |
18x |
12x |
21x |
12x |
1.7x |
Although PhonePe and Paytm have much larger market share and Paytm already turning profitable since the last 2 quarters; there is a big valuation gap (On a Price/Sales basis) between all the payment service providers and One Mobikwik Systems, which leaves a huge room for rerating, if and when they start delivering the expected numbers.
Risks:
• Merchant lending is too small currently, they are majorly lending currently to consumers or retail users. They will have to focus more on merchant lending to ramp up the Digital credit GMV.
• If no approval comes for the interchange fee on Pocket UPI, it may lead to the take rates in the Payments vertical being under pressure.
• Competition from larger, better-funded players like PhonePe, Google Pay, and is a significant risk for MobiKwik. While MobiKwik has a strong wallet market share, these larger players dominate the overall digital payments landscape, particularly in UPI transactions, posing a threat to MobiKwik’s long-term growth and market position.
• Their operations are subject to regulation, oversight and inspection by the RBI, and any adverse observations, proceedings or notices from the RBI may affect their operations adversely, as what happened in FY25.
• Security breaches and attacks against their platform, and any potential breach of or failure to otherwise protect personal, confidential and proprietary information, could damage and materially and adversely affect their business.
• Slowdown in the growth of their Active Users and new merchants onboarding can adversely affect their business.
Current Market Cap - 1,825 Cr
Disclosure: Invested