
HDFC LIFE also has interest in entering re-insurance area… interview with CEO ahead of the upcoming IPO. He also mentions there would be consolidation among the insurance players as there too many in business now but many are small, not growing fast enough and losing money.
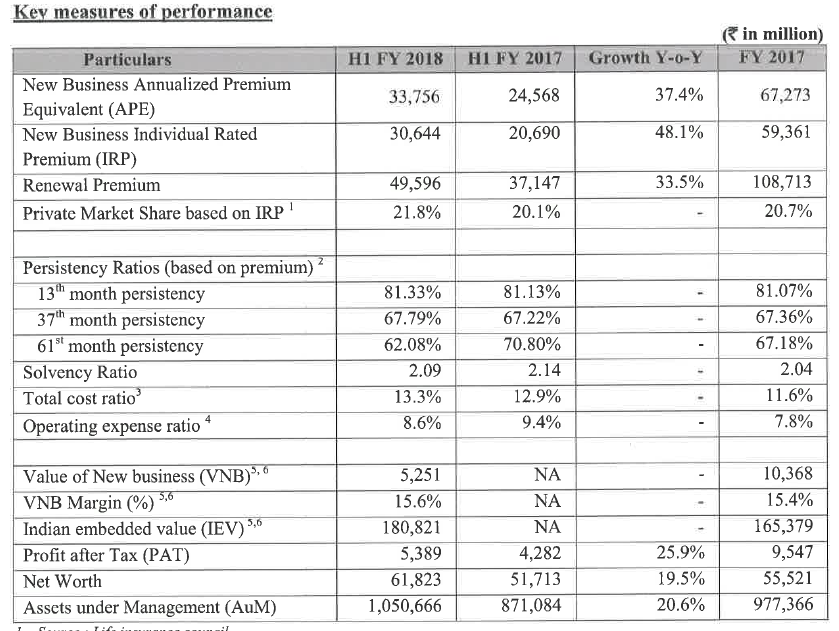
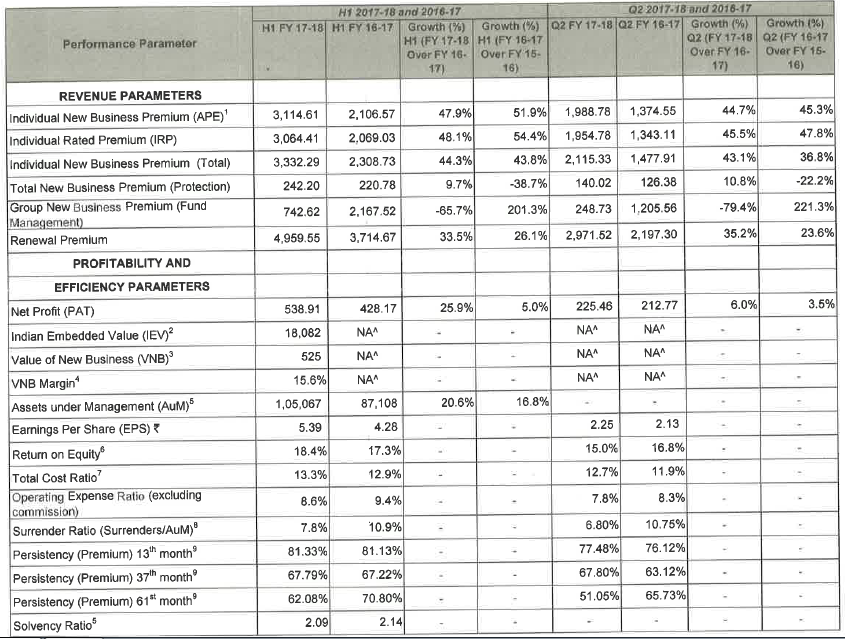
SBI Life H1FY18 results:
http://www.bseindia.com/xml-data/corpfiling/AttachLive/cfe4d0a4-30cf-4cf7-8a0b-d0c482e8b2ee.pdf
Embedded Value: Rs 18,082 Cr and the stock trades at 3.67 times EV.
VNB Margin: 15.6%
New Business ULIPs Premium mix: 55.9%
I noticed that VNB for financial year 2017 is 1037 whereas for half year financial year 2018 it is 525 which on yearly basis turnout to be 1050, which is showing absolutely no growth whereas in case of ICICI Pru VNB is growing at 70%.
What is missing?
Gaurav, the quarterly numbers can’t be annualized due to seasonality in business. Premia in Q4 and Q3 will be far higher than Q2 and Q1. Overall for the year, they may do much more than 1050.
1 Like
Absolutely correct…! Specially in case of LIC, period from Dec to March often covers more then 40 to 45 % of the whole year’s business As during this period people plans for Income Tax relief purpose.
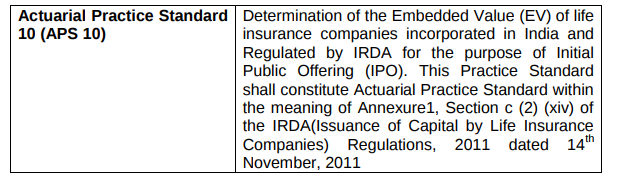
My understanding is EV has been standardized by Institute of Actuaries of India (IAI) in APS 10. Please find document here. Do key assumptions mentioned by you form part of this standard?
How to calculate EV/VNB/VIF etc are all defined there but the assumptions are left open. Even if IAI (or some other authority) defines the values to be used for discount rate for products/yield/Inflation it cannot be a static definition.
In my discussions with some insurance folks the details are left to the policy designers (actuaries) of individula companies. I absolutely see no reason why inflation assumption should differ (since other assumptions can be product specific).
You are absolutely right that values cannot be static ones, but are we absolutely sure that these are not published by IAI or do we need to work on this to be absolutely sure?
Where can one find L-42 valuation basis you have mentioned?
Thanks
https://www.sbilife.co.in/en/about-us/investor-relations/public-disclosure
https://www.iciciprulife.com/about-us/investor-relations/yearly-public-disclosures.html
2 Likes
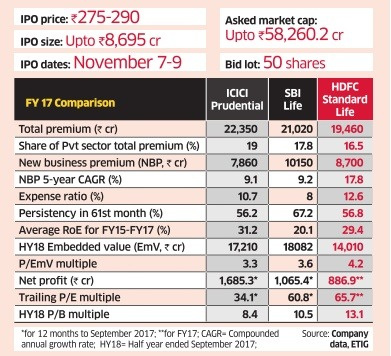
ICICI Prudential trading at 395 (MCap: 56700 crores; embedded Value: 17200 crores, Ratio is 3.3 ) - Link here
SBI Life Insurance trading at 643 (MCap: 64300 crores; Embedded value: 18000 crores, ratio is 3.6 ) - Link here
HDFC Life Insurance IPO upper price at 290 (MCap at upper price band: 58260 crores, embedded value: 14000 crores, ratio is 4.2 ) - Link here
All Three must be in portfolio atleast 3% of portfolio each. Basket approach of leaders can give better returns.
Disc: have only ICICI pru. Planning to add SBI around 620, HDFC Life at 250
2 Likes
Do you expect HDFC Life to trade at price lower than IPO price? If it does, that would be fantastic oppurtunity to buy…
1 Like
Tomorrow’s HUL, Colgate in the making! Insurers seen as goldmines
via The Economic Times App(Download Now):
http://ecoti.in/etapps
"However, ICICI Prudential and Bajaj Allianz computes EV using Indian EV principles set out in actuarial practice standard 10. SBI Life, Max Life and HDFC Standard Life compute EV using market consistent EV principle.”
Could anyone explain the above statement? What do they mean by, “market consistent EV principle.” Do they mean international insurance accounting standards?
Like the difference between US GAAP, IFRS and IAS.
1 Like
This article written by Dr Vijay Malik has reference to HDFC Life insurance offering shares at Rs 195/- in December 2015 at that time itself it was very expensive and now after 2 years IPO band is Rs 290 thats almost 50% higher. Valuations of all IPO’s are very stretched.
1 Like
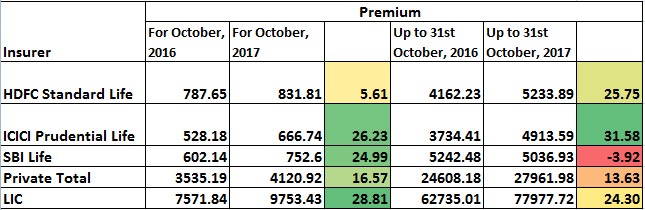
The premium figures for October 2017:
2 Likes
Your hardwork in bringing to fore the assumptions made by Life insurance companies while calculating key business ratios is appreciable.
I am of the opinion that leaving such key assumption/variable value for the companies to decide is not in the interest of investors because we do not have any common ground for performance measurement of different companies and EV/VNB becomes thoroughly misleading.
Therefore I am putting a RTI with IRDA to know at first stage if our understanding matches with their rules/regulation. The questions I have thought of are
Please provide name of any standard developed/implemented by IRDA for calculation of Embedded value by life insurance companies.
Please provide details of any assumptions/variables which are left for companies to decide while calculating Embedded value by life insurance companies.
Comment/suggestions/improvements/opinions from the community are invited.
8 Likes
Excellent initiative, Gaurav !
In the meantime, I am attaching a document that is on my to-read list about valuing Insurance companies.Analysis and Valuation of Insurance Companies - Final.pdf (982.2 KB)
1 Like
Thanks @Anant bhai for helping to get some understanding of assumptions made in calculating actuarial assumptions. To get to the next level, I have been trying to understand numbers of insurance companies and following are some notes →
First of all, no investment float gets generated in linked portion of policies. The risk is entirely borne by policyholders and management makes money by policy/fund management charges, commission etc. So it is important to look at these two components (linked vs. non-linked) separately and probably value them separately as well.
Attached excel sheet does the same for ICICI Pru Life, HDFC Life & SBI Life.
Insurance_Data.xlsx (41.5 KB)
Google Drive Link with visible formulas →
Few interesting points →
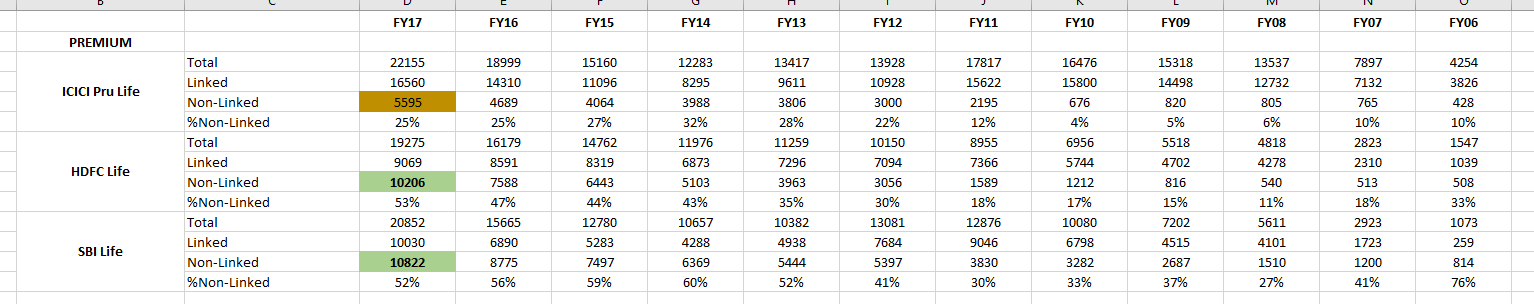
HDFC Life & SBI Life has 50% of their premiums coming from non-linked side of policies vs. only 25% for ICICI Pru. HDFC/SBI Life write 10,000Cr+ premiums of non-linked vs. 5500Cr. for ICICI Pru.
To measure the efficiency, I have looked at non-claim expenses as a percentage of premiums earned. Claims can very widely year over year & hence I have not included them in efficiency calculation. Number/Amount of claims is an important part of quality of underwriting and it gets captured on cost of float later.
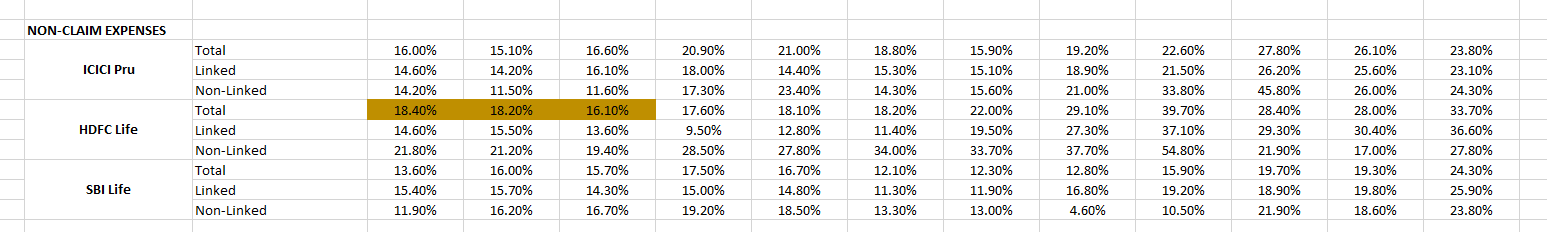
There is really nothing to differentiate here in terms of non-claims expenses across the three insurers. HDFC life’s non-linked portfolio is growing at ~35% in last 5 years & hence non-linked non-claims expenses ratio seems high.
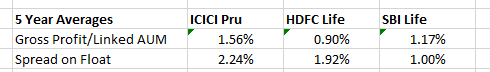
The most important aspect to value the non-linked portfolio is to look at cost of float, return on float, growth of float etc. Following table captures this →
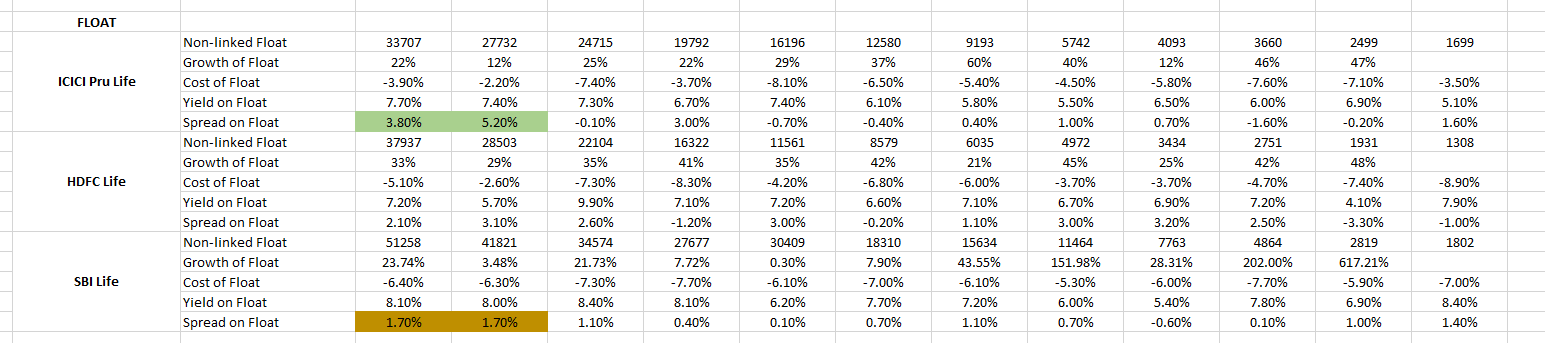
- First of all, cost of float of all the 3 life insurers is below the ongoing interest rates to get loan from market & hence they have value. The difference between cost & yield on float gives us spread (akin to NIM for banks).
- For ICICI Pru Life, there was hardly any spread on non-linked float till FY15. But since last 2 years, spread on float has been very good.
- For HDFC life, the spread has been consistently good over last few years but it is lower than ICICI Pru for last two years.
- The spread numbers for SBI life have improved in last two years but they are still low at 1.7% compared to other 2.
The assumptions about actuarial liabilities that @Anant bhai found out come into picture here e.g. for a life insurer with conservative assumptions about discount rate/inflation/mortality, cost of float will go up & for someone with aggressive assumptions the cost of float will come down. e.g. if one puts LIC rates into ICICI Pru life, numbers would look very different.
Now coming to linked assets →
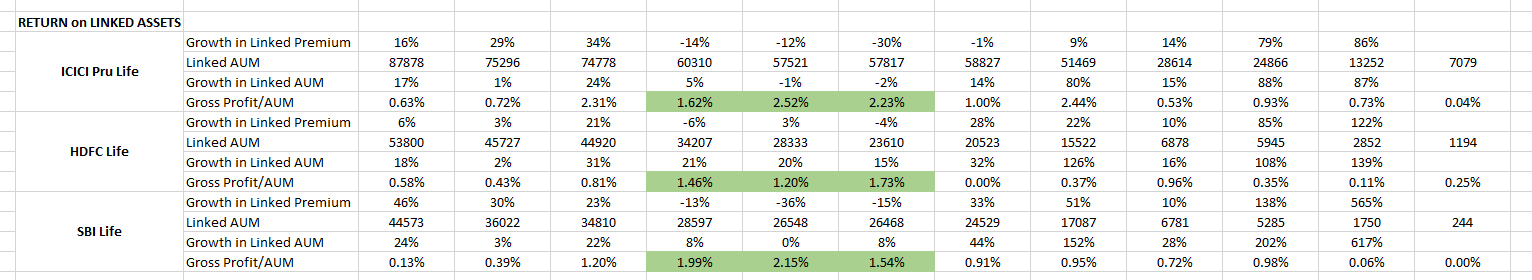
- The way to judge linked portfolio is to check the ratio of gross profit (surplus transferred to shareholders account) as percentage of AUM.
- One of the most interesting things about linked portfolio is, whenever there is degrowth in premium earned, the gross profit goes up. This is because the cost of acquisition of linked portfolio is very high upfront & there might be some losses on newly acquired linked policies.
- So it might be better idea to look at Gross Profit/AUM average across a cycle instead of every year.
With this, I think we get a framework to value the parts of insurance business →
Gross Profit = Spread on Non-Linked Portfolio * Float + (Average Gross profit/AUM across cycle) * Linked AUM
To go from gross profit to PAT, only things one has to look into are - taxes & expenses of shareholder accounts (there is no interest, no depreciation etc.). So one can take multiple of above gross profit (somewhat close to EV/EBITDA).
Valuing insurance business using EV (and understanding it) is a different topic altogether. For lesser mortals like me, I find above method of valuation easier to understand and compute.
Lastly,
It can be seen that non-linked portfolio generates more gross profit compared to linked portfolio.
TODO
- One can further drill down the non-linked portfolio of HDFC Life & SBI Life to figure out where the growth is coming from. How much of it is protection vs. rest.
- Also it would be interesting to understand if LIC assumptions about actuarial liabilities are higher because it has been underwriting business for longer e.g. when FD rates were 9%, what was the discount rate used by these companies? If someone can collate these assumptions across a cycle for some of these players, it would be great help.
Views invited.
Disc - I am invested in ICICI Pru Life. This is not a buy/sell recommendation. I am not a SEBI registered analyst. My methodology & assumptions regarding numbers can be completely wrong above. Investors are advised to do their own due diligence before investing.
35 Likes
Absolutely wonderful work @rupeshtatiya. Some of the conclusions that can be drawn:
I think we need data at least for a decade more to arrive at finer conclusions. My guess is that most of the ratios including spread on float, operating returns on linked and other important ratios would have stabilized by then.
Thing which comes out clearly
a) The weaker numbers that SBI has compared to ICICI & HDFC. What is even bad is despite the lower commission ratios SBI operationally isn’t doing good.
b) The stickiness of non-inked portion (although expected) would probably mean higher non-linked portion could relate to higher valuation.
c) Non linked portion generating higher spread when interest rates have come down. Is the correlation causal?
Still trying to churn the data in my mind to find more abstractions/conclusions but absolutely wonderful work. Big thanks @rupeshtatiya
6 Likes