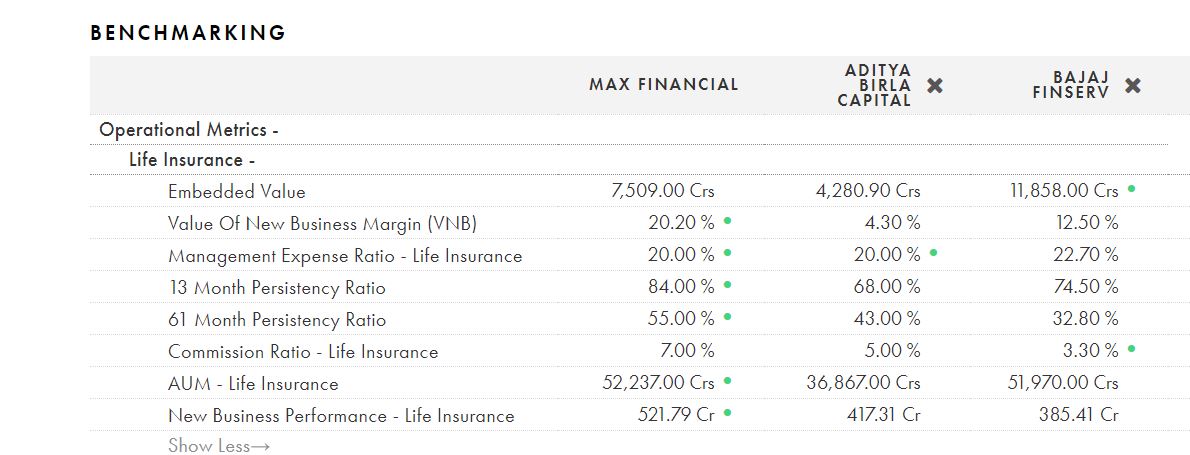
I was comparing three second tier life insurance companies - MAX/ ABCL/ BAJAJ
Why these three ? All are non bank promoted and listed indirectly, providing opportunity to invest.
However, i am seeking opinion of others to understand the data which is released on monthly basis by IRDA.
As per the attached sheet, ABCL is approaching close to other two in terms of premium, lives covered and sum assured till february, 2019. But the BAJAJ is way ahead in terms of group scheme policies than other two (almost 10x)
As per my understanding, group schemes can provide volume but should be extremely price competitive, leading to lower profitability.
Does this suggest that MAX and ABCL has higher profitability portfolio as comapred to BAJAJ (almost same premium and sum assured, but lower lives covered → Higher sum and premium per insured) ?
This post is similar to the one on the HDFC Life insurance thread.
If the objective is to determine profitability of the portfolio of insurance then just looking at grouping of premium flows or new business performance as published by IRDA is not enough. We would need to look at (1) VoNB to ascertain profitability of new premiums (2) ability of companies to retain customers so as to justify the fixed costs of marketing (3) the expense ratios of management and commision ratios paid to distributors etc.
A good article can be found on valueresearch linked below:
I have attached a comparision of the three companies you mentioned using metrics published with IRDA.
I went through the link. Some data are upto Oct 2018 and some till March 2018.
However, what interested me is in comparison -->
ABSL tied up with HDFC bank and bancassurance share gone beyond 50% in its new business. For Max, axis constitutes 50%.
As the HDFC tie up became effective post 2018, its contribution to revenue is being reflected this year whereas contribution to profitability might reflect down the time.
Because of the tie up, ABSL premium income is growing strongly on a relatively large base, same has not happened with BALIC/ MAX. (almost 50% compared to 10 - 20% for rest two)
I think it’s because some metrics like.embedded value are updated only in annual report of companies ( but I’m not sure ). You can check with those guys cause they have a thread on value picker.
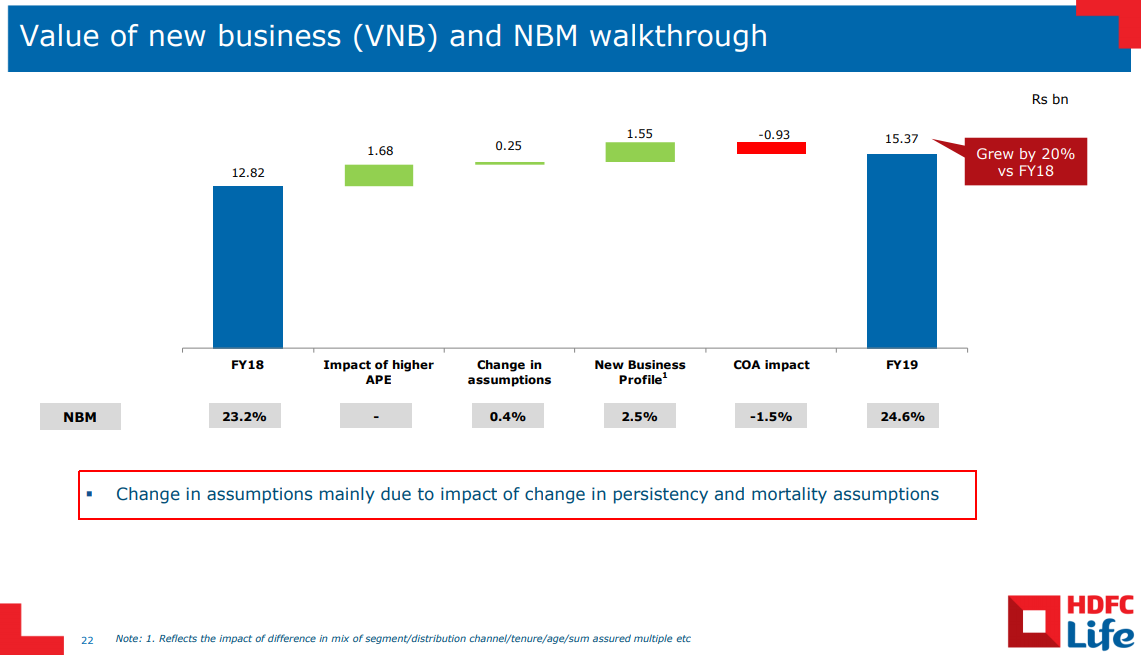
We need to do this analysis for the year once, SBI life declares result. From HDFC Life fy19 presentation they have changed persistence and mortality assumptions.
I haven’t listened to any of the conf calls of life insurance companies yet. Was going through the results at a little bit relaxed pace & following are some observations -
FY19 EV
FY18 EV
YoY Growth
FY19 VNB
FY18 VNB
YoY Growth
FY19 VNB Margin
EVOP
Unwind/Starting EV
VNB/Starting EV
HDFC Life
18301
15216
20%
1537
1282
20%
24.60%
20.1%
8.5%
10.1%
ICICI Life
21623
18788
15%
1328
1286
3%
17.00%
20.2%
8.4%
7.1%
SBI Life
23730
20170
18%
1920
1570
22%
19.80%
17.4%
8.0%
9.5%
FY19 Total Premium Growth
FY19 New Business Premium Growth
FY19 Renewal premium Growth
HDFC Life
24%
32%
16%
ICICI Life
14%
15%
SBI Life
31%
26%
33%
The most interesting thing to note is lower growth in EV for HDFC life compared to total premium growth & lower growth in VNB compared to strong NBP growth. I was hoping at least the VNB growth would be much higher than the other two companies given the NBP growth. I think breakup of suplus statement might have some clue.
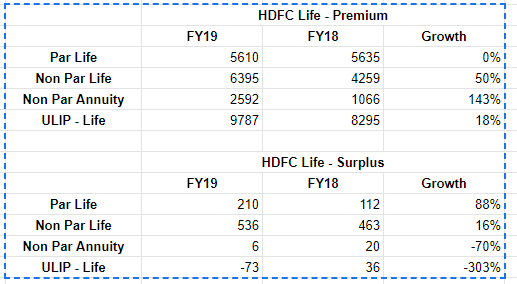
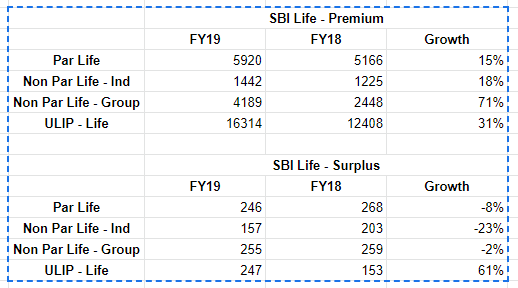
There is no surplus to report in Non-Par annuity business although premium has grown by 143%. It looks like business has not reached minimum scale to pay for operating expenses etc. & hopefully things would improve going further.
It was surprising to see deficit in ULIP portfolio despite reaching the scale of almost 10,000Cr
Also growth of surplus in Non Par Life is much lower than premium growth. May be there are costs involved in the new tie-ups in credit life side & this number shall improve as each partnership reaches minimum scale.
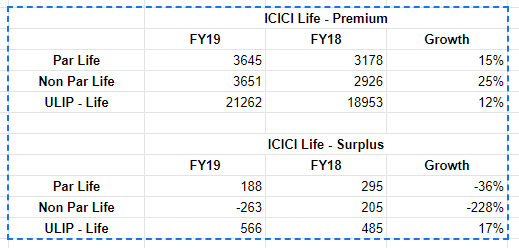
It was good to see 15% growth in EV (19% growth pre-dividend) for ICICI Life considering the subdued premium growth year they have had. This a little bit like growth in book value for banks. But ~400Cr of the EV has come from changes in operating assumptions. It would be good to understand these from management in conf call. Another positive thing was increase in ad spends by whopping ~500Cr by ICICI Life. I consider this as good spend although I personally never came across ad of ICICI Life compared to HDFC Life or SBI Life.
The surplus of Non par life business went from +205Cr to -263Cr. I think a large part of this might be due to ad spends. Another way I feel about this is - Non par life business of ICICI Life does not generate enough to fund the growth in newer products or partners like HDFC Life.
The ULIP surplus number is good to see & still little bit surprised by loss in ULIP by HDFC Life.
For SBI Life, the growth in VNB tracks well with growth in NBP.
Even SBI Life makes pretty decent surplus from ULIPs
Surplus for Par Life has gone down for ICICI/SBI Life whereas it has gone up for HDFC Life. It would be interesting to figure out if this is due to additional expenses by former two or is it case margin compression etc.
Disc - I hold HDFC Life & ICICI Life. No transactions in last 60 days.
Unwinding means taking the business one year forward in case of assumptions.
e.g. Let’s say to cover someone for 3 years for sum of 1,00,000 Rs. with a one time premium.
Assuming a reference rate (prevailing G-sec yield etc.) of 10%, the premium today comes to 75,131 by reverse discounting.
But to mitigate risk, you only assume reference rate to be 5% while determining premium. This way premium come to 86,383.
Now when you unwind position after 1 year, following happens →
You got premium paid of 86,383. The reference rate is 10%, so sum becomes 94,933.
The liability at 5% for next 2 years comes to 90,702.
The difference between the two is your unwind at reference rate = 94933 - 90702 = 4231.
If reference rate moves to 12%, you make unwind which will be more than reference rate.
Hence you will see two parts of unwind in reports - 1) at reference rates 2) at rate in addition to reference rates.
The unwind in the books of life insurance companies is a complicated version of above example.
Here is the presentation we did on life insurance industry last year →
Because of miss selling of ulips by private players people have got very skeptical and Jane shifted to fixed income products with trusted brand names like LIC
Came across this interesting argument against investing in Life Insurance sector by Sridhar from Enam.
" If I look at life insurance versus general insurance, their persistency ratio for 61 month is 50% which means half your customers are not paying your premiums after five years. You typically end up making money only after five years because of the way insurance is structured. Half of them are not paying.
The number two is that the penetration of life insurance adjusted for per capita keep in mind that these are actually financial products. You cannot say we are 2.5-3% penetration and China is also 3%. Their per capita is four times larger than us.
From a penetration standpoint also, this is one of the only product where India is over penetrated forex per capita. And my last point on life insurance is that there are roughly 300 million life insurance policies outstanding in the market as we speak, the total number of households are roughly 300 million and if you assume only half of them are insurable you are already talking of of two life insurance policies per household. Whichever way I cut it, it looks over penetrated to me."