
Understanding the financial services industry is a challenge in itself for the majority of investors. The KPIs are unique, the risk on the balance is hidden and back-ended. If financial companies are confusing to understand, insurance companies are downright tough.
In this post I would not make an attempt to simplify the insurance industry as a whole, that is a big task for some other day. Today we will focus on what kind of investment returns an investor can expect based on one of the valuation parameters that is widely used in the insurance industry.
We will use Embedded Value (EV) to derive a return matrix based on entry and exit multiples and a few different growth scenarios. If you do not know what EV is, you should google and read up on it. As geographical jurisdictions change, calculation of EV is slightly different. Many Indian insurance companies have started reporting IEV (Indian EV) now. Research the web to know more.
EV calculation has a lot of variables in it, these variables often need to be forecasted for long time periods and these assumptions are made by the insurance companies. Is there is a potential for foul play? Yes. Just imagine this, it is already very very difficult to ascertain the true book value of a bank, NBFCs etc. because it comprises of 1000s of loans, whose value is determined by the management. It is easy to report these loans as good and maintain the company’s book value. Add to this, now you have estimations of future profits, that is what makes EV.
The avenues for wrongdoing just jumped multifold. That being said there are regulators who periodically keep a check, how effective they are is a discussion we should save for another day.
What I am trying to say is, be careful when assigning multiples to a financial company’s book value and an insurance company’s EV. Keep a margin of safety if you will.
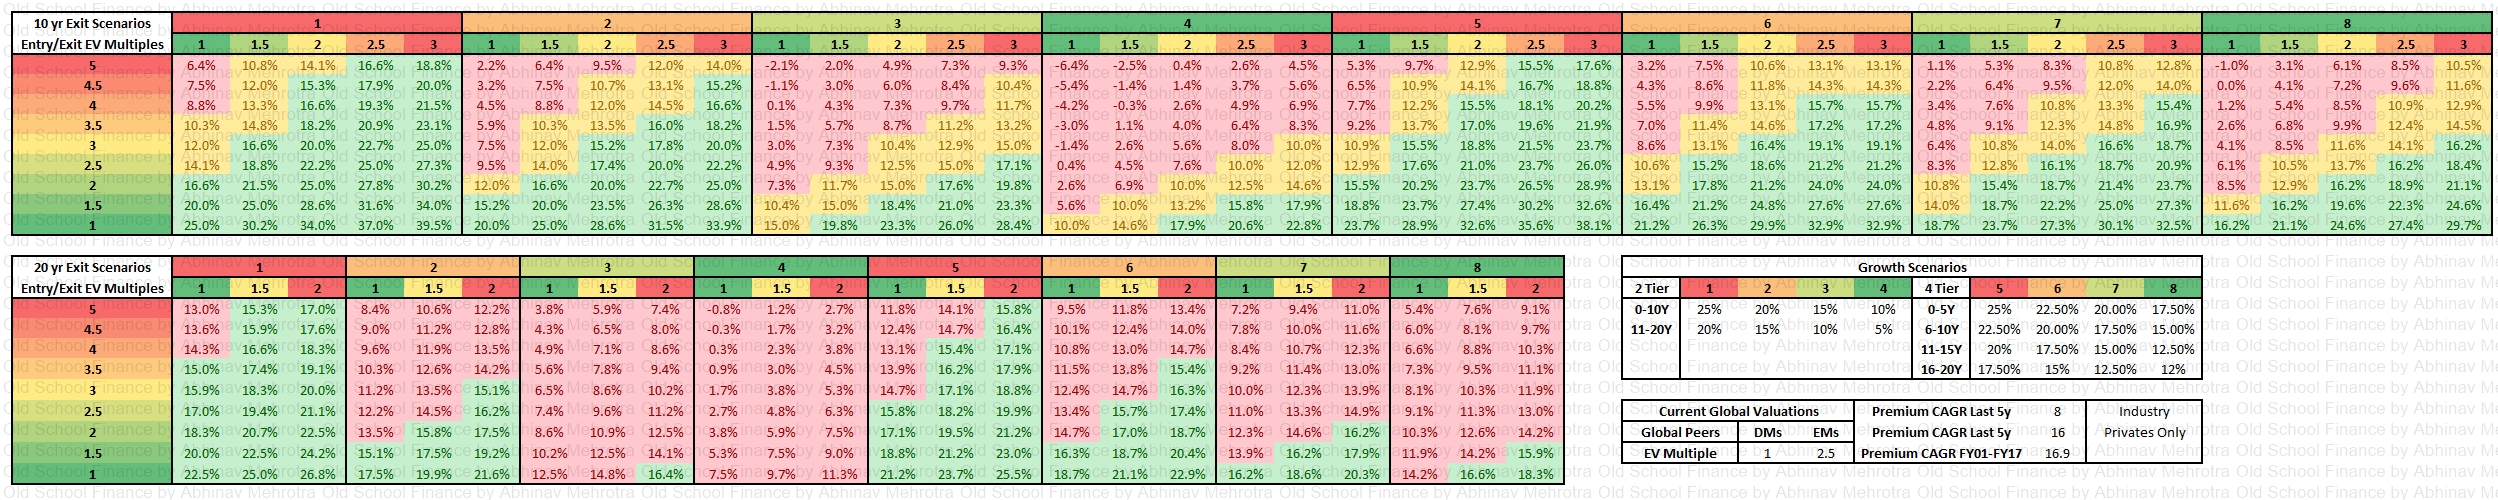
In the table below we have calculated the expected returns based on multiples of this EV. Incidentally one can use this for Price/Book as well. The concept is the same.
Here is what we have done,
- Assumed P/EV entry multiples from 1 to 5 in increments of 0.5.
- Assumed P/EV exit multiples from 1 to 3 in increments of 0.5.
- Assumed a 10-year and 20-year exit scenario. For exit in 20 years, exit multiples have been capped at 2x.
- Assumed 8 different growth scenarios, labelled 1 to 8. Scenarios 1 through 4 are 2 tiered, meaning, we have different growth rates for the first 10 years and the last 10 years. Scenarios 5 through 8 are 4 tiered, meaning, we have different growth rates for 4 different 5 year periods.
- Growth scenarios are colour-coded, aggressive growth is shaded towards red and conservative growth is shaded towards green.
- Similar to the previous point, Exit/Entry multiples are colour-coded as well. High entry/exit multiples are shaded red and low entry/exit multiples are shaded green.
- Does not include dividends.
We start with an EV of 1 unit at year 0, apply the differing growth rates as per the growth scenarios. We get a certain future EV value at year 10 and 20. We use an exit multiple on this as per the different exit scenarios. We divide this exit with the different entry multiples scenarios. We calculate the return in CAGR form for different exit time periods.
CAGR returns above 15% are highlighted in green, between 10-15% in yellow and below 10% in the red.
Hi-Res Table: Table Image
So how to make sense of the table, which growth, exit and entry scenario to expect.
Here are a few pointers,
- Global peers in developed markets trade at ~1x EV.
- Global peers in emerging markets like China trade at ~2.5 EV.
- The Indian insurance industry as a whole has grown premiums at a CAGR of ~8% in the last 5 years.
- Private insurers in the Indian insurance industry have growth premiums at a CAGR of ~16% in the last 5 years.
- Industry premium CAGR from FY01 to FY17 was 16.9%.
I do not have the correlation between premiums growth and EV growth for the industry, I wish I had more information like these to make further decisions,
- Indian insurance industry EV history.
- Global insurance industry growth, product mix history.
- Policy Holder database, House Hold information, net worth, unique policies etc.
One will also need to link these growth assumptions of the next 2 decades with the insurance penetration levels in India. Remember insurance is a pull product, discretionary if you will. The population needs to rise to a certain wealth standard before they consider insurance as a finance tool.
I have discussed about insurance penetration in detail in the following twitter thread which I have copied below. Thread on Insurance Penetration
Insurance Penetration
Where is the under penetration in Life Insurance in India? We are neck to neck with China, US, Australia and close to Asian Average.
Sridhar Sivaram of Enam has also pointed the same. Industry growth going forward will be similar to GDP growth.
Privates taking over the market share from LIC, is that all the valuations are standing on? Can LIC compete in a similar manner for, ever younger, tech-savvy, service and time-sensitive customer?

Outliers

Here is another evidence from Swiss RE Sigma

Life insurers as of Sep. 2019 are trading at 3-4-5 P/EV while global peers are trading between 1-2.5. The industry grew premiums by 8% CAGR in the last 5 years and privates grew by 16% CAGR. Now doing an implied DCF for 20 years, assuming a generous growth 20% for 1st decade and 15% for the next decade on EV with an exit P/EV multiple of 1x, at the current P/EV of 5/4/3 the market is implying a return of 8.4/9.6/11.2% CAGR.
Even if we increase the EV CAGR to 25/20% for 1st/2nd decade, the returns are 13/14.3/15.9% CAGR.
Since the liberalization of the Indian insurance sector, the Indian insurance sector has grown from a total premium of 454 bn in FY01 to 5,494.5 bn in FY17; this translates into a CAGR of 16.9%
Most analysts cite India’s low % of the premium to GDP (~3%) against the world average of ~6% to say we have a huge runway for growth. Here is a counter - We are almost equal to US, Germany, Australia, & China. Where we are really lacking behind is in Non-life.


Yes, the world average as per IRDAI in the above tweet is at 6%, but the key point to consider is that is it a weighted average of all markets? A weighted country market size average is a much more relevant figure to compare with because individual countries which may be small in global insurance market may have outlier penetration levels, the reasons for which I haven’t yet researched but it could be due to lesser number of people per HH, regulated mandates, inequality differences, increased threat to life/property, natural disaster-prone regions, etc.
We rank low in density figures because our GDP/capita is low & if we remove rich India then the figures are abysmal. Yes, we may have 20x difference to some Developed Markets, 4x to China & 7x global averages but our GDP/capita is also lower & the densities will only increase when GDP/Capita increases.
If anyone has researched beforehand why France, South Africa, UK, Hong Kong, South Korea and Taiwan are such outliers in terms of penetration please do share your wisdom with me. Really eager to learn why this is so.
See Interest over time on Google Trends for life insurance - India, 2004 - present - Google Trends
The above google trend for life insurance is what baffles me, since 2004 we (India) have only increased our internet users and online purchase of insurance year on year, & still, the interest in the term has reduced.
Conclusion
I hope I have convinced you enough about the need for picking conservative entry/exit multiples and growth scenarios in my expected return table. As per my readings, growth scenarios 3, 7 and 8 are good starting points. Scenario 4 is too conservative. As for exit multiples, no one knows the future but conservatively one can hope for an exit multiple between 1.5-2 in a 10-year exit and 1-1.5 in 20-year exit scenario, given at what insurance companies in developed markets trade at. Anything beyond that is stretching the limits of imagination.
These are long timeframes, nothing is guaranteed, the profitability of the entire industry, let alone the growth rates could change drastically for all we know. Future product mix will also have a significant impact on the valuation of the company. The industry is notorious for mis-selling, such tactics can boost short term profits and commissions for the employees but can never build long term relationships with customers.
EV is a single valuation metric which has many many levers determining its value. If you have a look at the sensitivity tables that each insurer provides you will see that it is sensitive to equity market movements, persistency rates, operating expenses, mortality and morbidity assumptions, tax rates, and interest rates. Trying to forecast these is a tough task even for the management. Hence, the need for asking a margin of safety even in the management’s calculation of EV.
The entry multiple is the only factor in our control from all of the above. We can choose to ignore the industry/investment until the valuations reach our comfort zone. Investing is one field where it pays to stay in your comfort zone.
Caution - In the short term market exuberance could prove me wrong. Few people could still make money on recent investments in Indian listed insurers.