
LIC HSG MD Siddhartha Mohanty on call with Moneycontrol categorically denied this piece of information.
1 Like
Management comments / concall takeaways
Collection efficiency: Collection efficiency for the month of Sep was 96%, around 3-
3.5% of loan book has enquired for restructuring. The restructuring enquiry in the
proportion of corporate and retail (by volume) is 2:1. Company expect this number to
trend down by Dec 2020.
Asset Quality: Stage 3 asset for individual non housing portfolio was 1.72% (1.74% in
June 2020), for Project loan stage 3 assets were 16.52%(vs 17.64% in June 2020)
Yield: Incremental yield is around 8.1%, for Individual loan incremental yield was
around 7.3%.
Refinancing: In 2HFY21 amount to be refinanced is c.165 bn average cost on these is
c.8.4-8.5%. Refinancing in FY22 will be Rs 250bn with a average cost of 8.1-8.2%
2 Likes
Today it touched 52 wk high, what is the event/noise around some merger being talked about?
LIC Housing Finance Q4FY21 Concall Update
()
Asset quality disappoints
Outlook: Neutral in near term; Positive in long term
• GNPA came at 4.1% vs QoQ 2.7%. Individual Housing GNPA is at 1.9%, LAP & Others 5.8% and Project 18% vs QoQ 16%.
• Absolute GNPAs were at 9559 Cr with Individual Housing at 3.5k cr, LAP & Others at 3k cr and Projects at 3k cr.
• Impact of second wave will be less than the first wave.
• NNPA came at 2.7% vs QoQ 1.3%. PCR was at 34% vs QoQ 50%. Historical average PCR has been at 50%.
• Stage 2+3 loans increased to 10.3% vs QoQ 9.6% & YoY 7.5%. We were expecting this to be stable but it has risen by 70 bps QoQ. (Historically Stage 2+3 was at 5.9% in FY19 and 4.6% in FY18)
• OTR 1 was given to 1.5% of loans and OTR 2 would be given to 1% of loans.
• Collection efficiency has remained at 98% in May as well.
• Co does not expect higher slippages going forward. However due to lower PCR, we expect credit cost to remain elevated in FY22.
• Loan Book came at Rs. 232003 Cr, +10% YoY.
• Individual loans +10% YoY, Project loans +12% YoY (Rs. 15956 Cr).
• Loan mix remained stable YoY with Retail Home Loans at 78% mix, Retail LAP & others at 15% mix and Project Loans at 7% mix.
• Disbursement came at Rs. 22362 Cr, +97% YoY.
• Individual disbursements +94% YoY at 21116 Cr, Project disbursements +190% YoY at Rs. 1197 Cr.
• Disbursal ticket size increased to Rs. 25.5 lacs vs YoY Rs. 24 lacs.
• Prepayment of loans was largely stable at 11% vs 10% YoY.
• Salaried mix continues to be at 87% and Self Employed at 13%.
• Co shall issue preferential allotment to parent LIC of 4.54 cr shares (~Rs 2300 cr at CMP)
2 Likes
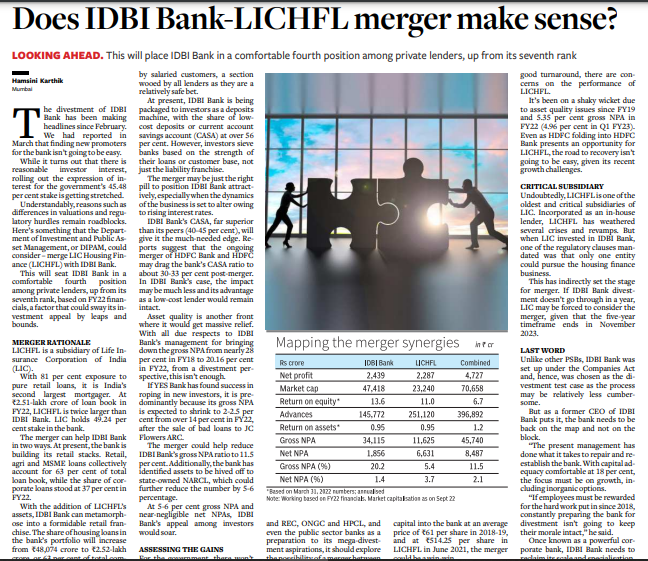
As far as I know, the government holds 45.48 percent in IDBI Bank while LIC holds 49.24 percent. LIC deciding to sell its stake in IDBI Bank was a coordinated move by the government.
Concall highlights
Key Q4FY21 Con-call Highlights:
-
As per the mgmt, majority of restructured a/c are performing and are in stage 1.
-
Collection efficiency improved to 98% in May. Mgmt has revalued the underlying stress for Covid impact and prudentially provided for it.
-
GNPA for developers loans rose to 18% in Q4 from 16% in Q3.
-
Break-up of GNPA includes:
-
Retail home loans: 1.89%
-
Retail non- core loans: 5.82%
-
Developers loans: 18%
-
Almost Rs14bn assets (5 big accounts) falling under Swami Fund seeking resolution. Swami Fund only a last mile funding option and doesn’t guarantee upgrades.
-
Stage 2 assets for retail loans stood at 4.9% as of Q4.
-
During Q4, 34% of individual home loan disbursement were towards affordable housing segment.
-
The company has repriced a large proportion of advances
-
Mgmt expects double digit credit growth in FY22
-
The company stated that the probability of further interest rate decline is less.
-
Rs250-280 bn of NCD will mature in FY22
-
The company raised Rs8 bn Tier 2 capital in Q4
-
The company’s board has approved fresh issue of 45.4mn equity shares to LIC (promoter) through preferential allotment. Post this, LIC’s stake shall increase to 45% from 40%.
1 Like
Some details about the Management, searched by me:
Executive Board Members of LIC Housing
(i) Mr. M. R. Kumar (Chairman)
Shri M.R. Kumar, took charge as Chairman LIC of India on 14th March, 2019. He joined LIC of India in 1983 as a Direct Recruit Officer. In a career spanning more than three and a half decades, he has the unique privilege of heading three Zones of LIC of India, viz, Southern Zone, North Central Zone and Northern Zone, headquartered at Chennai, Kanpur and Delhi respectively. He was also Regional Manager (Marketing) and Regional Manager (P&IR) at Kolkata and Chennai.
As an Executive Director, he headed the Personnel Department as well as the Pension and Group Insurance vertical of the Corporation. During his tenure, several initiatives were rolled out for the benefit of the employees.
His rich experience working pan-India, right from North to South and East to West including the heartland states of India while heading Kanpur Zone, has given him a deep insight into the demographics and insurance potential of the country. Moreover, working in different streams of life insurance management has given him the twin advantages of enriched knowledge and clarity on processes and procedures in the Life Insurance Industry.
(ii) Mr. Y Viswanatha Gowd (Managing Director and CEO)
Mr. Y. Viswanatha Gowd has assumed charge as Chief Executive Officer of LIC Housing Finance Limited with effect from 1st February 2021. He joined LIC of India as a direct recruit officer in 1988 and has risen through the ranks to this senior position. Prior to taking over as CEO of LIC Housing Finance, Mr. Gowd was appointed as Chief Operating Officer (COO) of LICHFL.
He also served as Regional Manager of LIC HFL’s South Eastern Region since 2017. Under his leadership South Eastern Region was the top performing Region of the Company and the loan book of the Region grew by 63%.
In a career spanning over three decades in LIC of India, Shri. Gowd has made his mark in the areas of Marketing, Finance, and Pension & Group schemes. He also holds the privilege of heading two divisions of LIC of India – Udipi and Dharwad as Senior Divisional Manager.
(iii) Mr. Vipin Anand (Non Executive Director & MD of LIC)
Vipin Anand assumed charge as Managing Director of LIC of India on 1 April, 2019. Prior to his appointment as Managing Director, he held the positions of Zonal Manager-In-Charge of LIC’s Western Zone, Mumbai and East Central Zone, Patna. Earlier, as Executive Director In-charge, he has been corporate head of LIC’s Direct Marketing, Corporate Communication and International Operations.
Mr. Anand joined the Life Insurance Corporation as Direct Recruit Officer of 12th Batch in 1983. During his service of more than 35 years with LIC, Shri Anand has handled with great success several important assignments in various capacities and departments, in operations as well as at the corporate level, ranging from Information Technology, Marketing and Personnel & Industrial Relations to Corporate Communications and International Operations, across different geographical locations of the country.
He was also a member of the IRDAI committee for framing Regulations on Digital Marketing and was a member of the CII Committee on Insurance and Pensions.
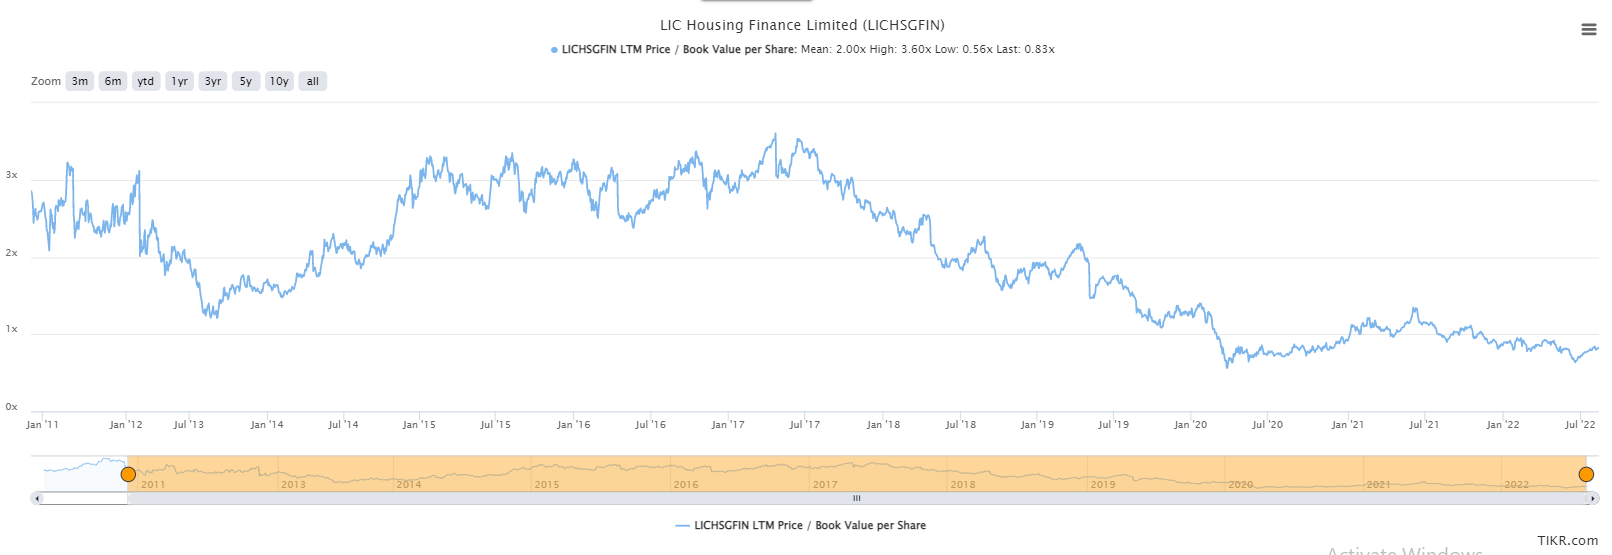
From high multiples in low mortgage penetration narrative(2014-2018) in hey days of trailing 2.5-3.3x P/B, over the years rising competitive intensity by banks & own asset quality issues have hit a good track record of delivering consistent profits/roe. While the arg of betting on banks reducing their competitive intensity is less uncertain, the tailwinds of better overall RE sales over next few years – growth in the end market via both volume & price, asset quality issues subsiding, better profitability (rising rates albeit a short term factor) when viewed vs current trailing vals makes this an attractive cyclical bet. Keeping aside vol growth, even mid single digit price rise in RE can help the growth no, prices have been broadly flat for past many years in general in tier 1 cities. In 2010-2014 era of very strong loan book growth, price rise too was a factor.
Housing finance has less profitability/roes given the yields, in general has merits in terms of being less risky, long duration, less cyclical.
Outcome is a little less uncertain, allocations accordingly, the payoffs can be really good if nos come through in next 2 years. Hfcs are very negatively viewed in recent times given banks have gone all out in capturing mortgage growth, raising the possibility that growth being shown now by hfcs is on account of more riskier customers than in the past. That could be the case in hindsight. Why bother then? trailing vals discount a lot of negatives & tailwinds help.
1QFY23: “Strength lies in reach. Will have share in the market. Then recently, we have also what you call equipped our the other line of officers. We call that the processing centers at some important centers for what happen now. Our digital operations, what we now engaged into there, also giving good results. So going forward, I think we’ll have a very good edge in the market as for the new disbursements are concerned. And growth for the current year, we are almost aiming at 12% to 15% in our disbursements. That’s one thing. Then as – given our existing book, the total portfolio also will be more or less moving in the same range of 12% to 15% by end of the year.”
1 negative is asset quality issues can further pop up spoiling nos for next 1-2 quarters. Not necessarily, management does not expect it, but it can be the case. Still unless it’s very material, given the growth outlook vs baked in valuations today, it’s worth a buy.
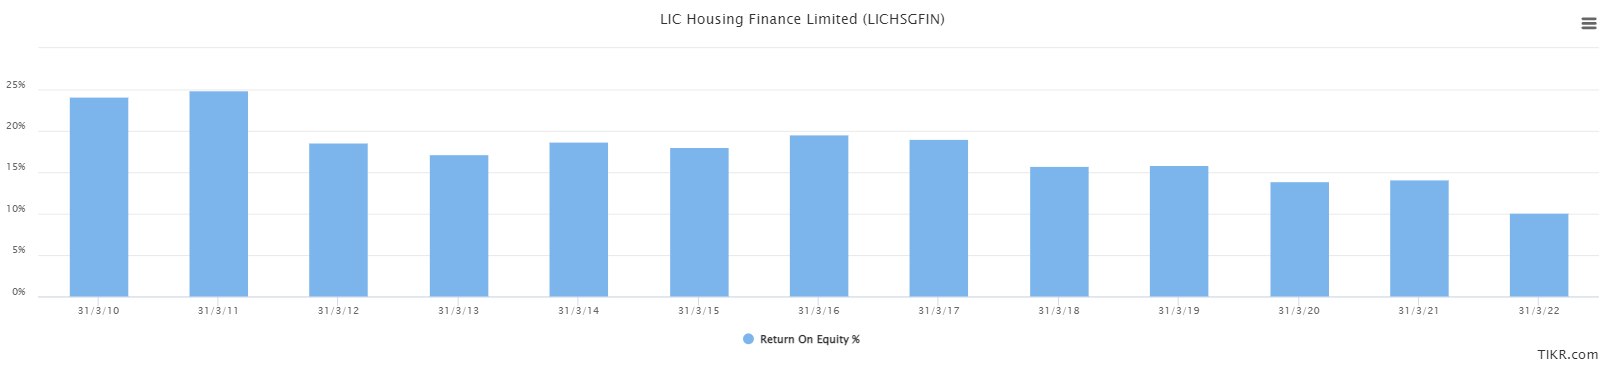
Over the past decade, roes have come off first from above 20%+ to 15%+ to about 10% in FY22. Better not to expect too much in terms of improvement, not going back to 16-18-20%, if we get double digit loan book growth, and roes head back to 13-14%, earnings growth & val rerating to say 1.5x can give 60-70% upside.
Disclosure: invested
3 Likes
After the 10% post earnings fall the stock is trading consistently below book value.
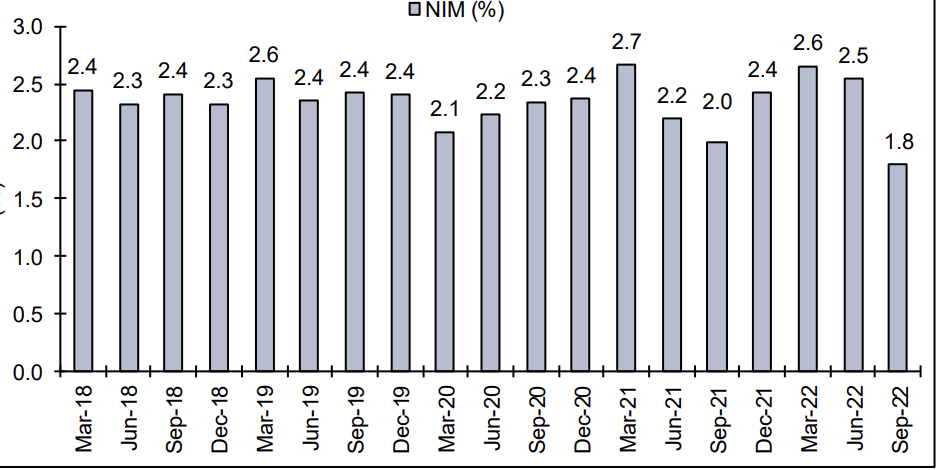
After going through a few brokerage reports (icici sec, hdfc sec, nirmalbhang ) the main concern is NIM volatility.
It is true that an nbfc will fair badly in a rising rate scenerio as the liabilities get repriced faster than the assets but that is more than factored into the prices, the company has seen high interest rate periods before has maintained its NIMs around the 2.2%
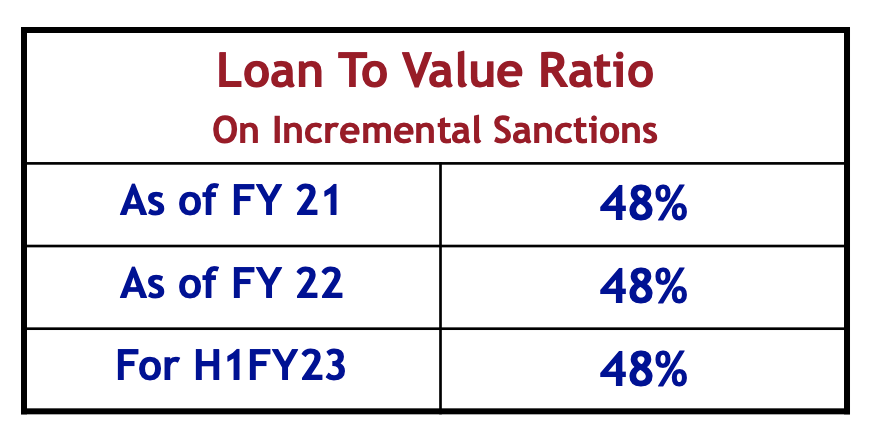
There is a risk that the 3500cr loans in OTR specific the project loans can slip in the next quater and that will keep credit costs high for the next two quarters but given that PCR is 44% and the LTV is 48% i feel they will be adequately covered from next FY with the possibility of lumpy recoveries at some point
Investment thesis is they will go back to 12% RoE in the next FY, and if you concider we are getting the equity at a 20% discount (0.8 PB) it is effectively 15%.
Assuming a 20% payout it is an attractive 3% dividend yield
the 80% that is reinvested if levered at 10x translates to a 10% profit growth
Seems reasonable
Disc: accumulating
3 Likes
Lic housing finance declared 1st qtr result today. A good set of numbers after long time. Figure should be compared YOY and not QOQ, as 4th qtr always distorts the picture. YoY income gone up by 30% and PAT gone up by 45%. EPS comes to 24, which would have been 30 but for impairment of financial instrument amounting to 360 cr. Management should come clean on this in tomorrow’s analyst meet. Last year this amount was 1900 cr. Imagine this on a equity of 110 cr. If this is sorted out, the share may fly and achieve its past glory.
NB- I am invested in this stock, so my view may be treated as biased.
4 Likes
This is a LONG POST, Not specifically about LIC Housing finance but about the ENTIRE Housing Finance Niche it operates in. It aims to provide a very good understanding of LIC Housing finance’s competition and Industry level nuances.
First, we’ll be looking at some common Sense Sectoral metrics, starting with :
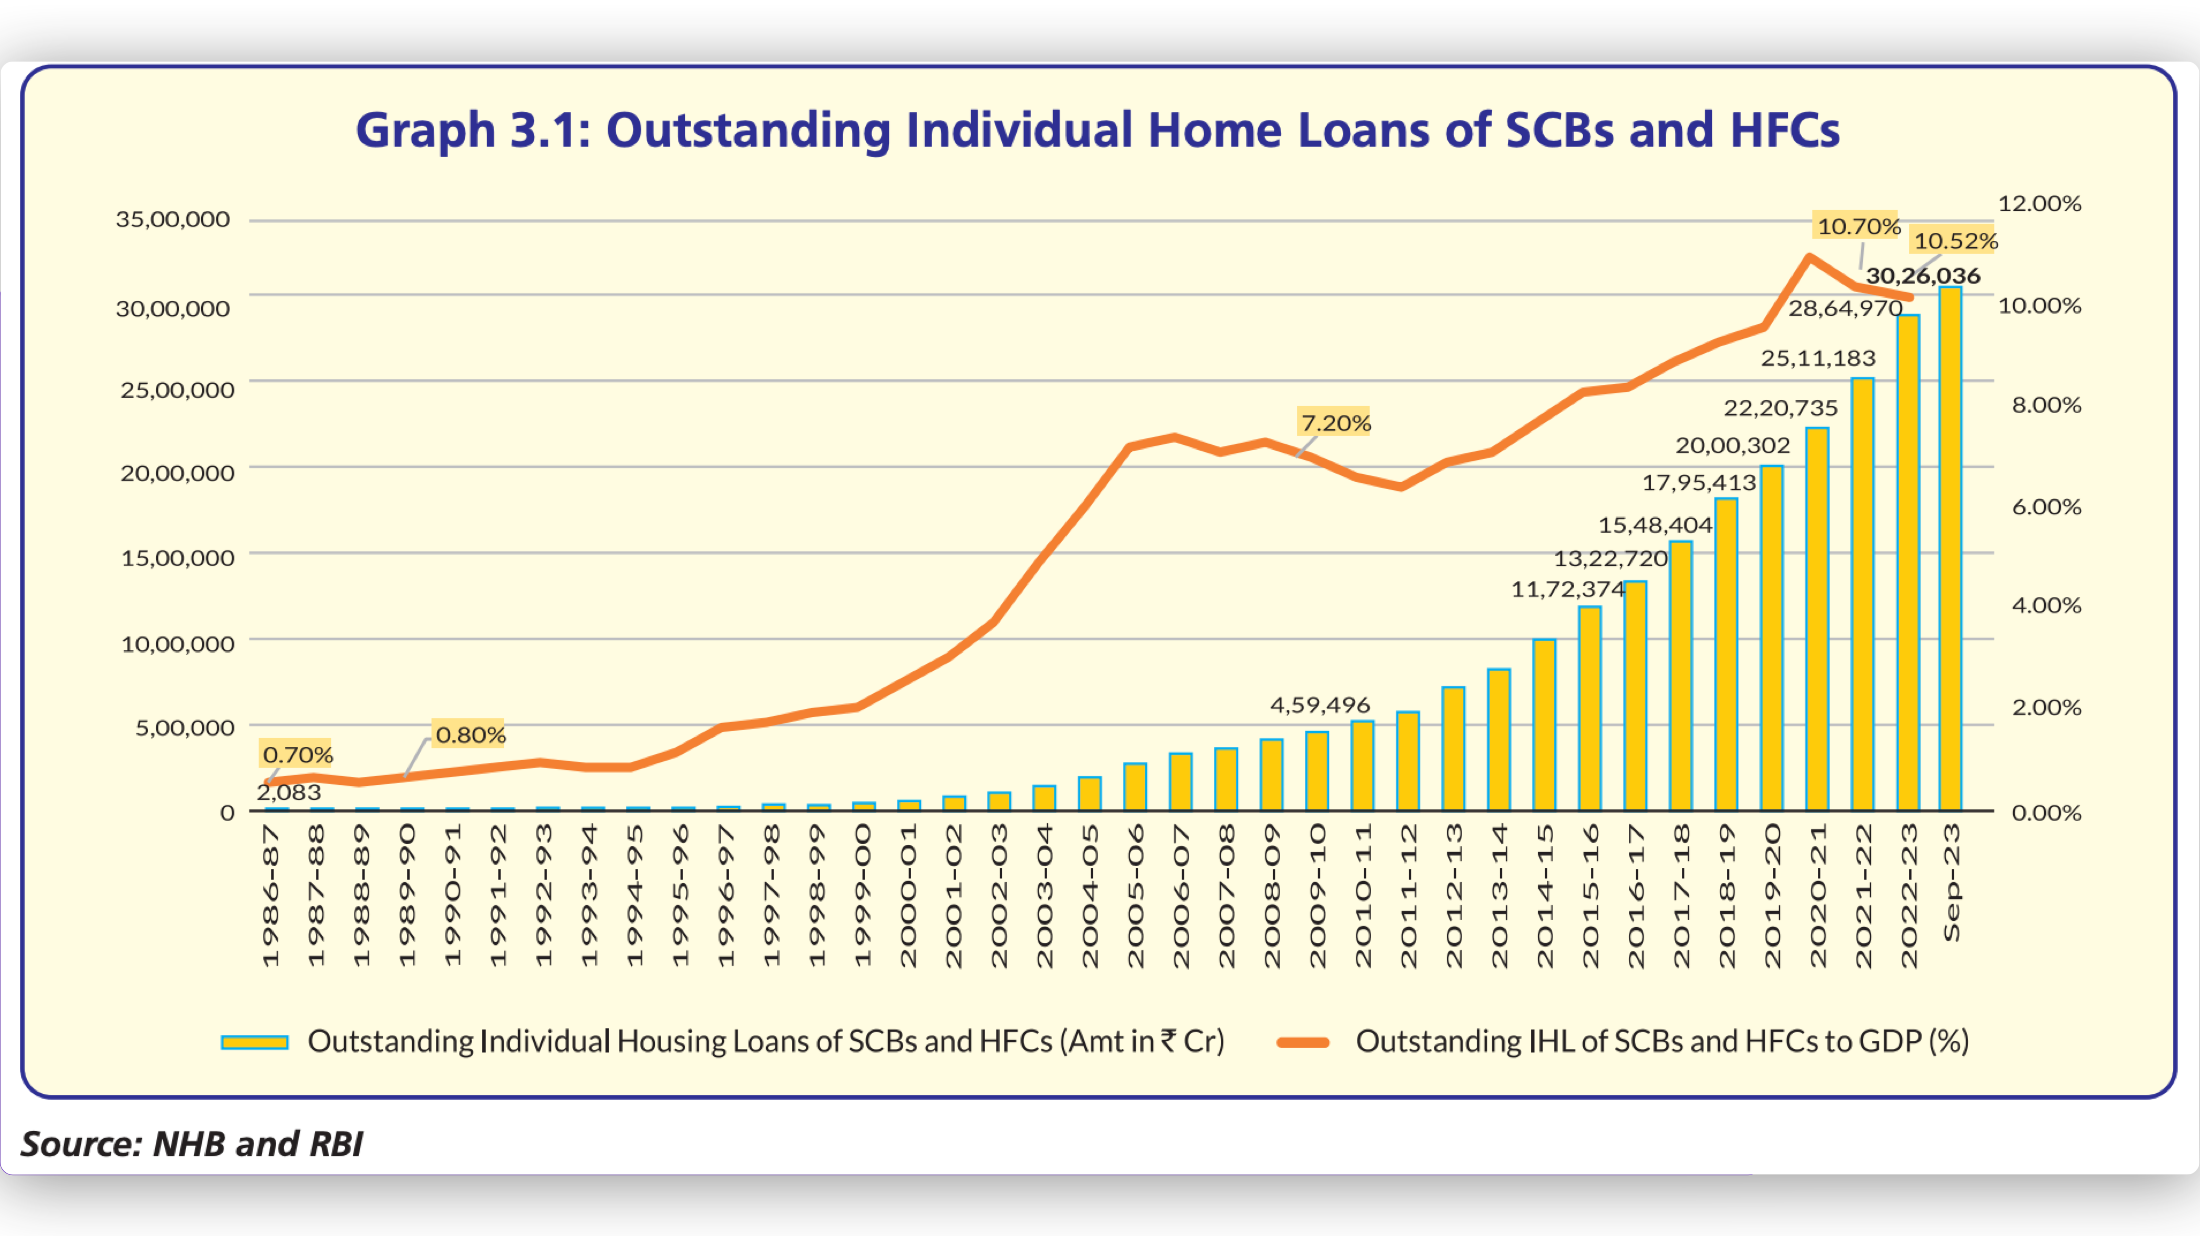
- Total Housing Loan Market Size and Growth
The chart below shows Outstanding Individual Home Loans (IHLs) and the ratio IHLs / GDP (%) a.k.a Mortgages to GDP Ratio, which reflects the improving (but still low) penetration of Home Loans in India.
If you look at the Home loans (hereafter: HLs ) as a percentage of Total Loans outstanding, you’ll notice that it has consistently increased over the given time frame.
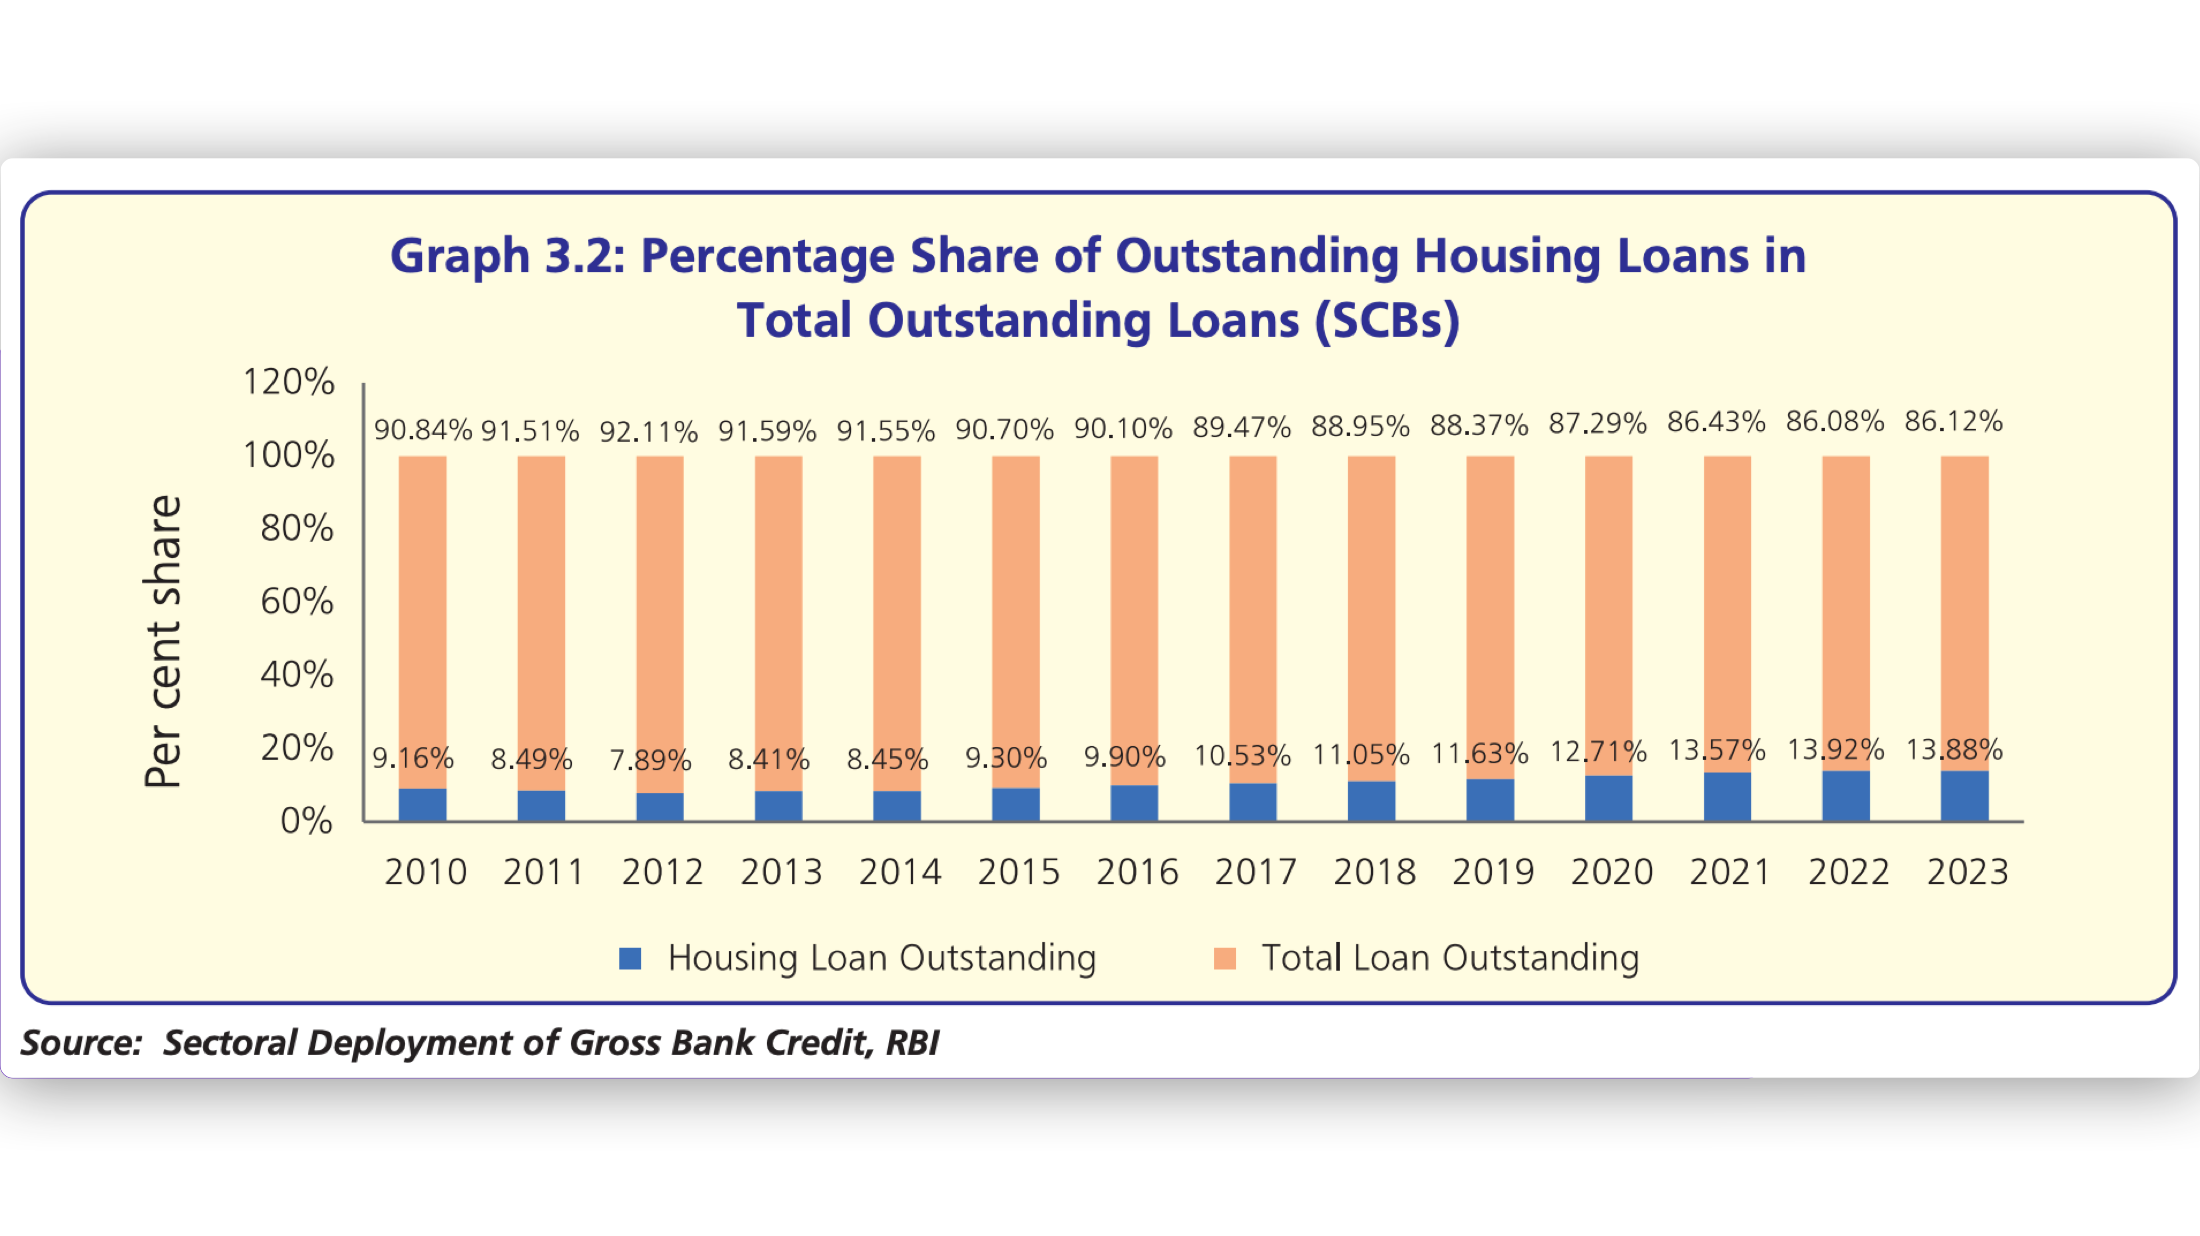
The above trend indicates that Credit directed towards Home loans has increased at a faster rate & more consistently versus the systemic Credit Growth.
That’s great but as the Mortgage to GDP Ratio indicates, we have a long way to Go ![]()
![]() ! AND THAT is the opportunity.
! AND THAT is the opportunity.
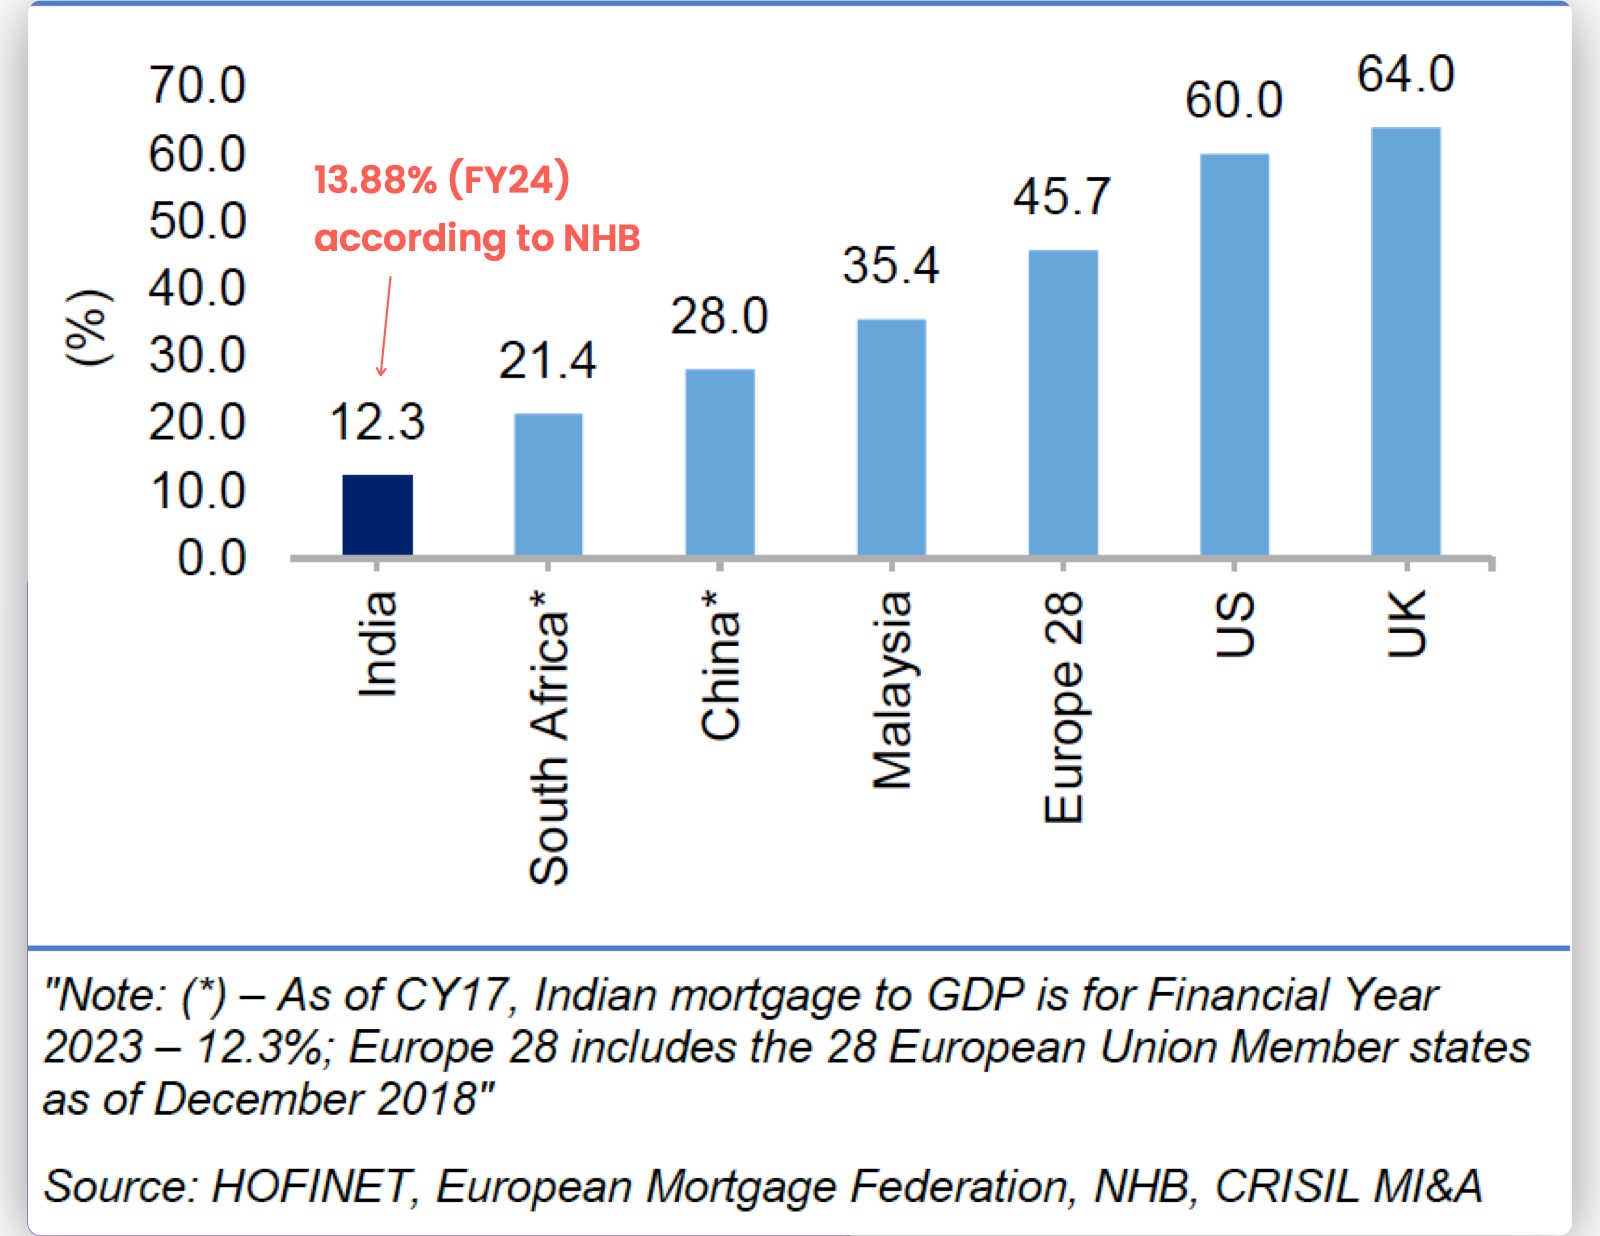
NOTE: Mortgage to GDP Ratio may vary depending source of data and how its been calculated. (12-14% would be a good estimate)
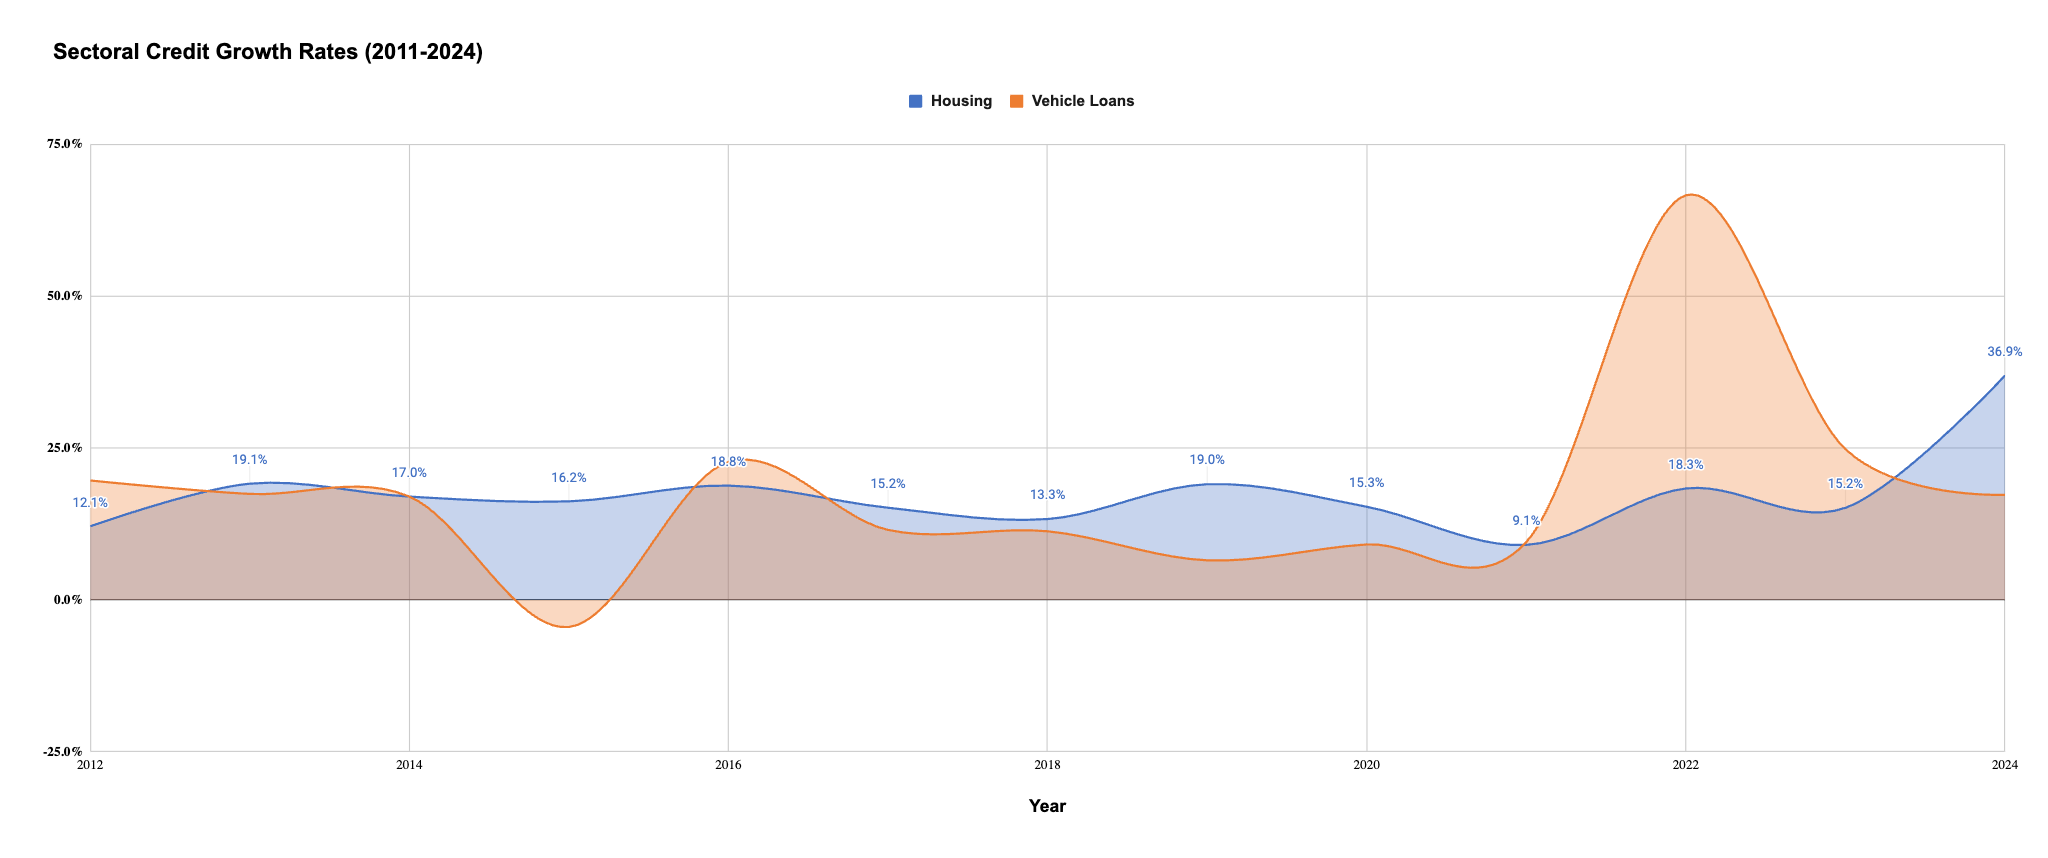
The fact is that Home loans have enjoyed one of the most consistent growth rates (~14%) among all the Major lending segments - Gold, Vehicle, MSME, Industry etc.
Source: RBI | First Principles Investing Research
As of March 2024, Outstanding Home loans stand at 30,48,346 Cr. (30 Lac Cr) and the Growth has been even more robust in FY24 despite higher Interest rates.
so the so-called “Runway for Growth” is well-paved and well-lit for take-off.
The Question is who (Banks/NBFCs/HFCs) is going to benefit the most from this trend?!
To Learn more, Let’s introduce the Players of the Game.
- The Playing Field :
There are 2 major players in the Housing Finance Market - Banks & Housing Finance Companies (HFCs) and their share has fluctuated widely since 1986 ![]()
![]()
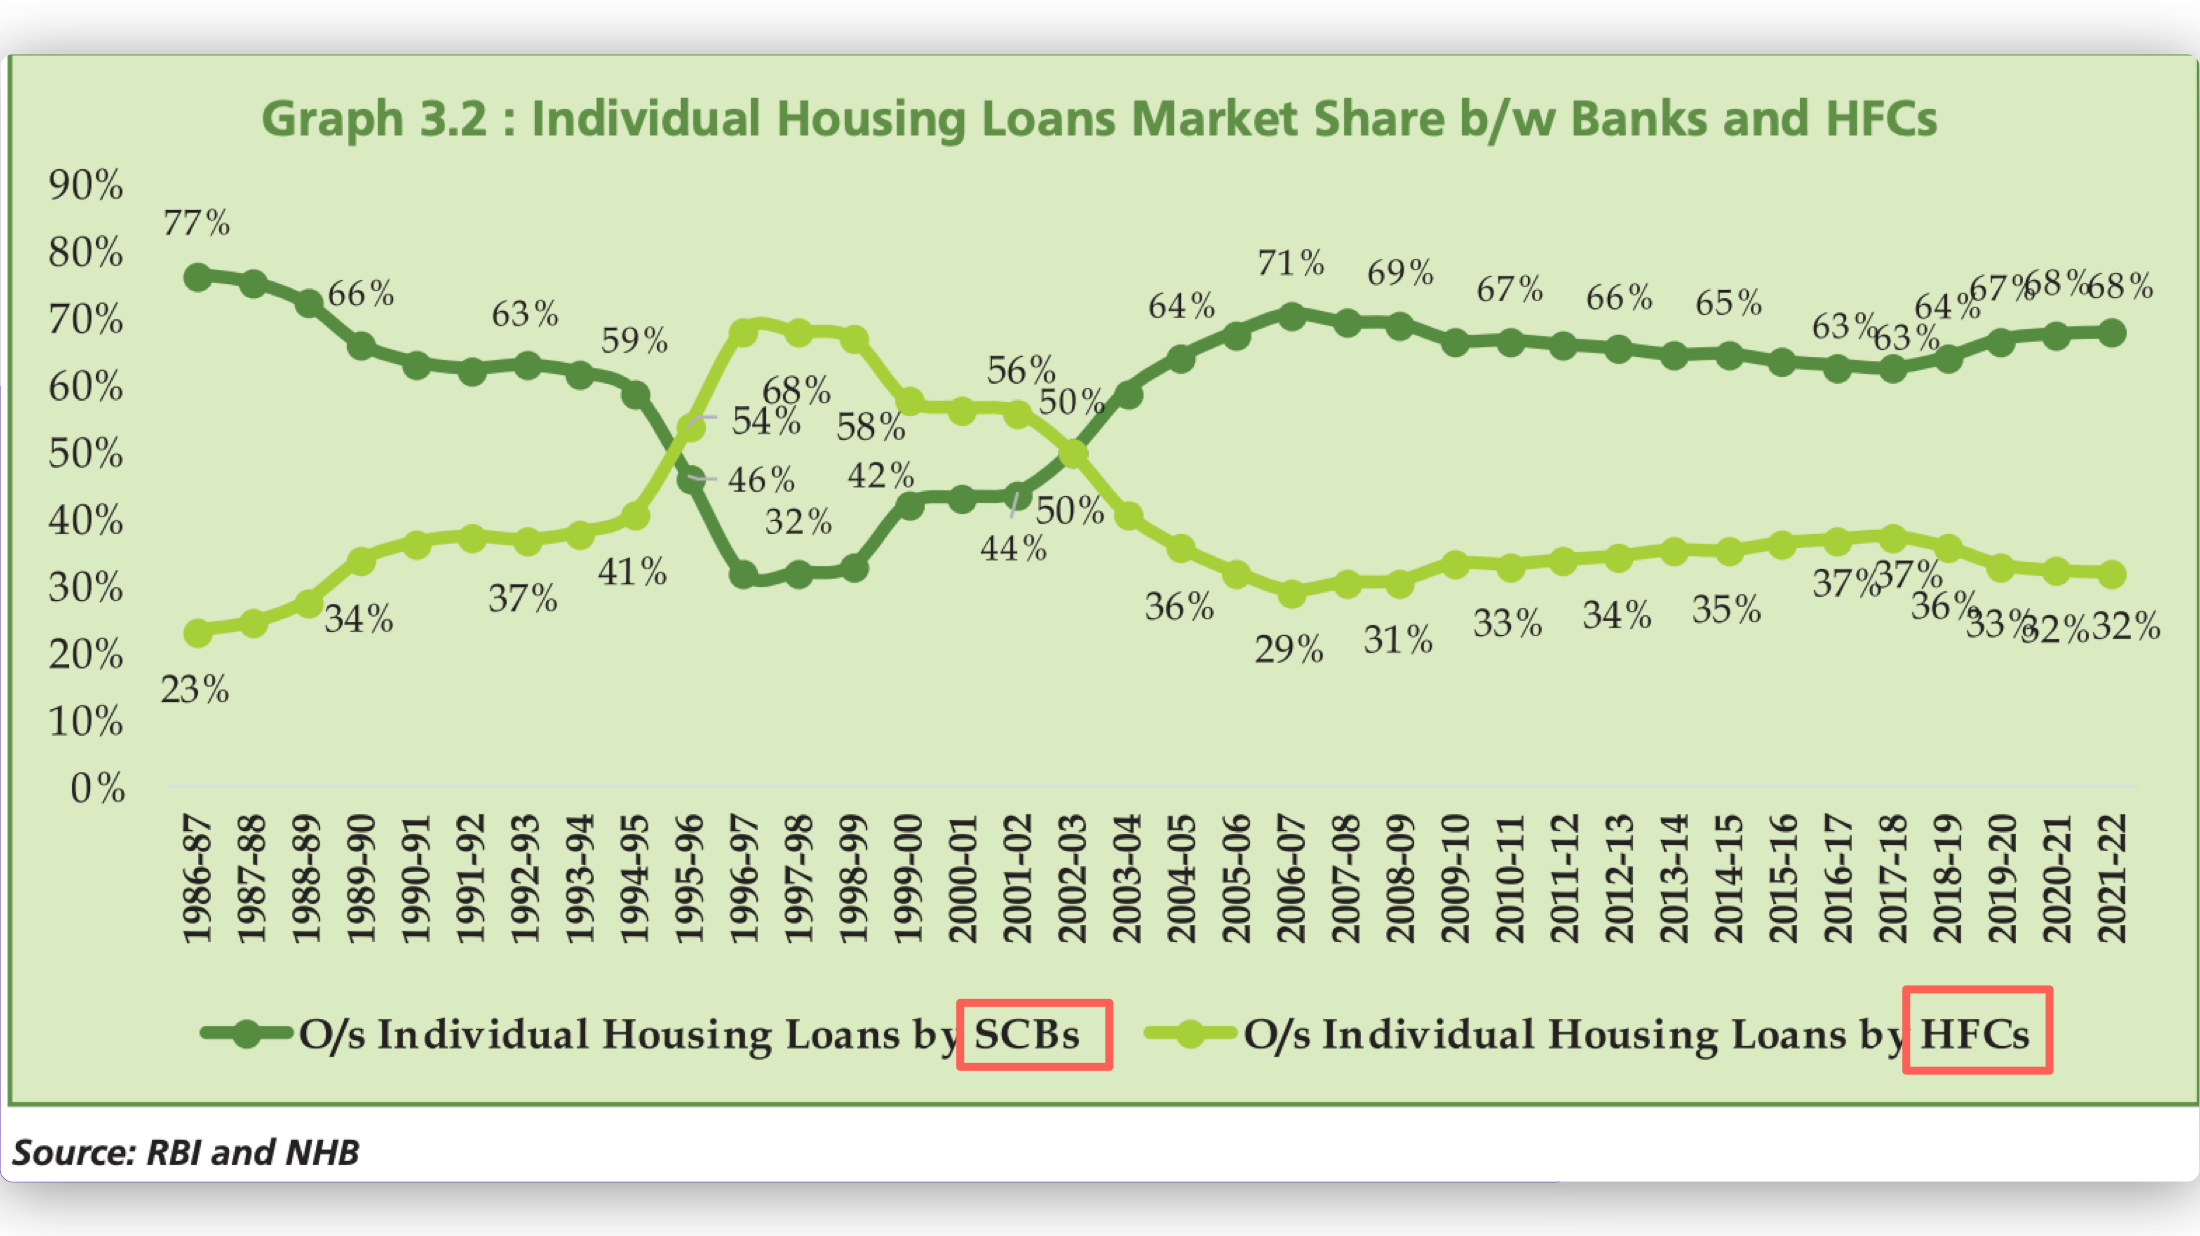
HFC Market share peaked in 2017-18’ at 37% and has been falling consistently down to ~32-33% as of 2024 (Not shown in the Graph below)
Why?
If you remember, back in 2017-18’ HFCs - HFCs were all the rage, precisely because they were growing fast! (Notice the P/Bx expansion ~2018 ![]() )
)
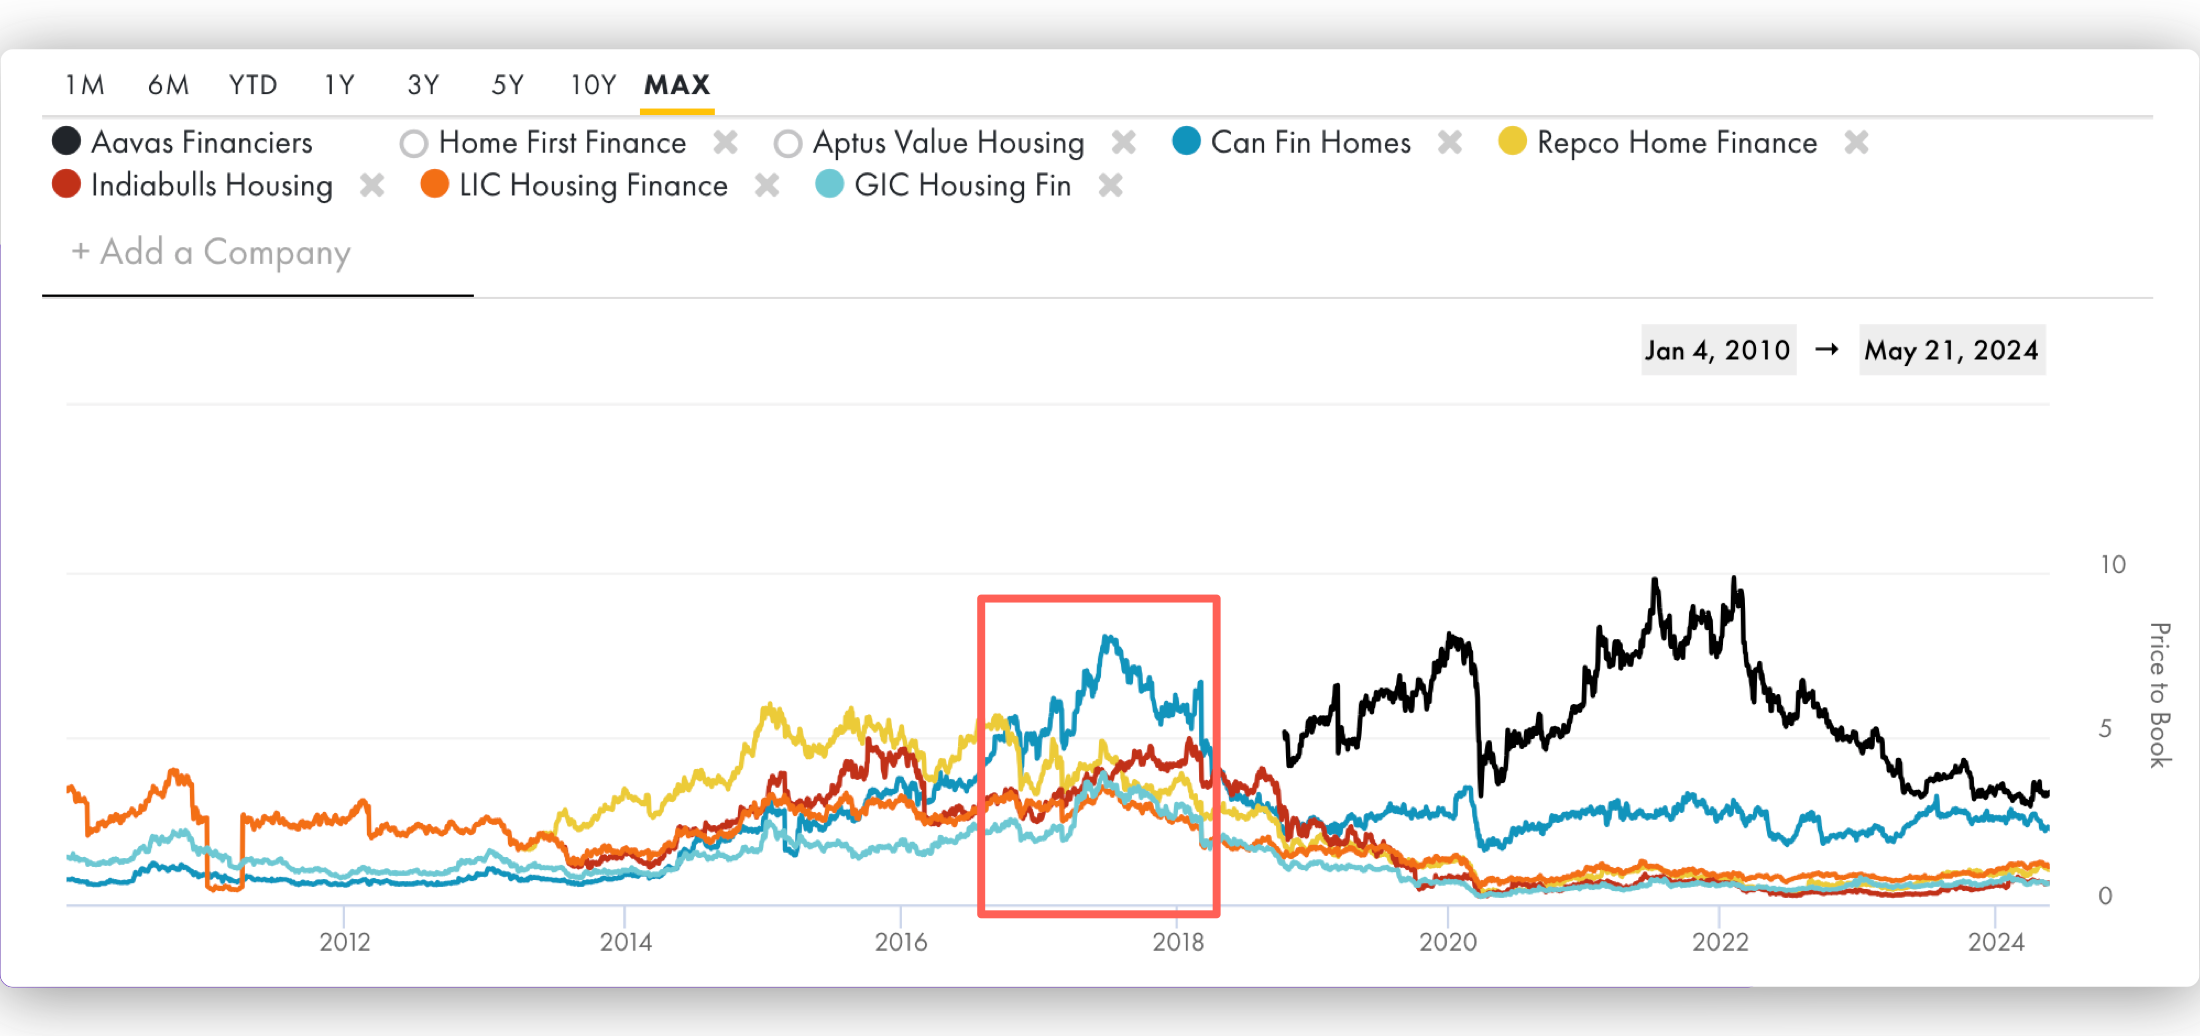
Source: Price to Book Value | Tijori Finance | First Principles Investing
In a period when the overall Banking System was suffering from unresolved NPAs, HFCs provided the comfort of Low NPAs, high growth and high ROEs. A combination that the ‘market’ rewarded with steep Valuations.
Then we had an oops moment with IL&FS, following which DHFL fraud was revealed. Seeing such large-scale failures, the Government handed over the regulatory powers for Housing Finance companies to RBI which were previously with NHB - National Housing Bank.
RBI felt that Banks were better suited for satisfying India’s housing aspiration.
After all, with lower cost of funds and increasing reach , Banks offer(ed) a better value proposition to most home buyers.
It also made changes to NPA classification norms which negatively impacted most HFCs, resulting in higher NPA!
But there’s another nuance to the housing loan market**,** which demarcates the territory Banks can dominate within the Housing loan market versus where they do not.
Enter : ![]() The Ticket Size:gun:
The Ticket Size:gun:
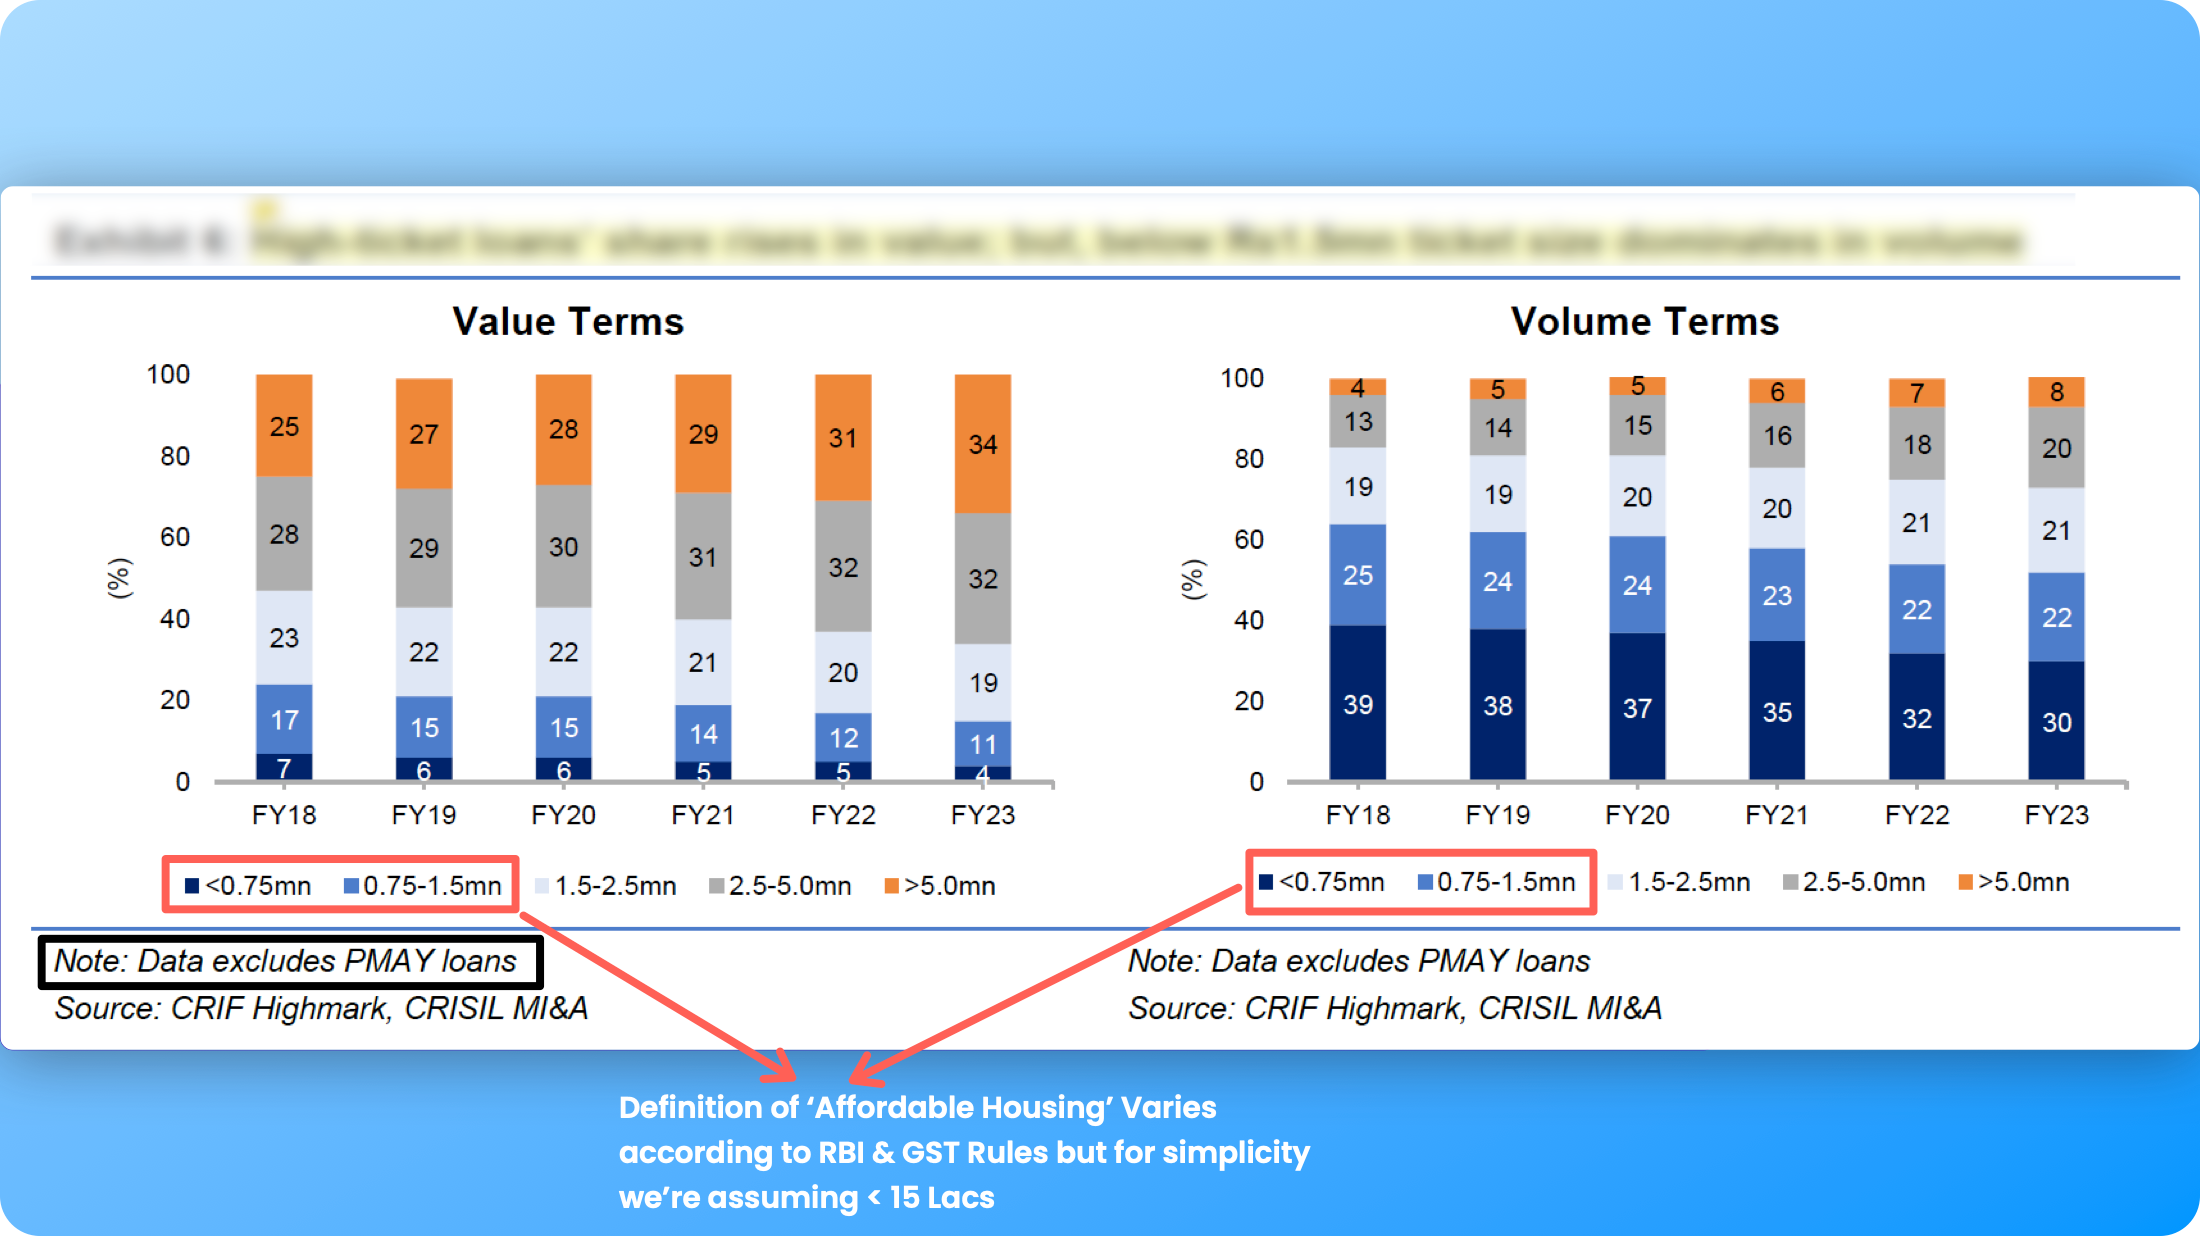
Growth in an HFCs/Banks portfolio is a function of Volume & Value
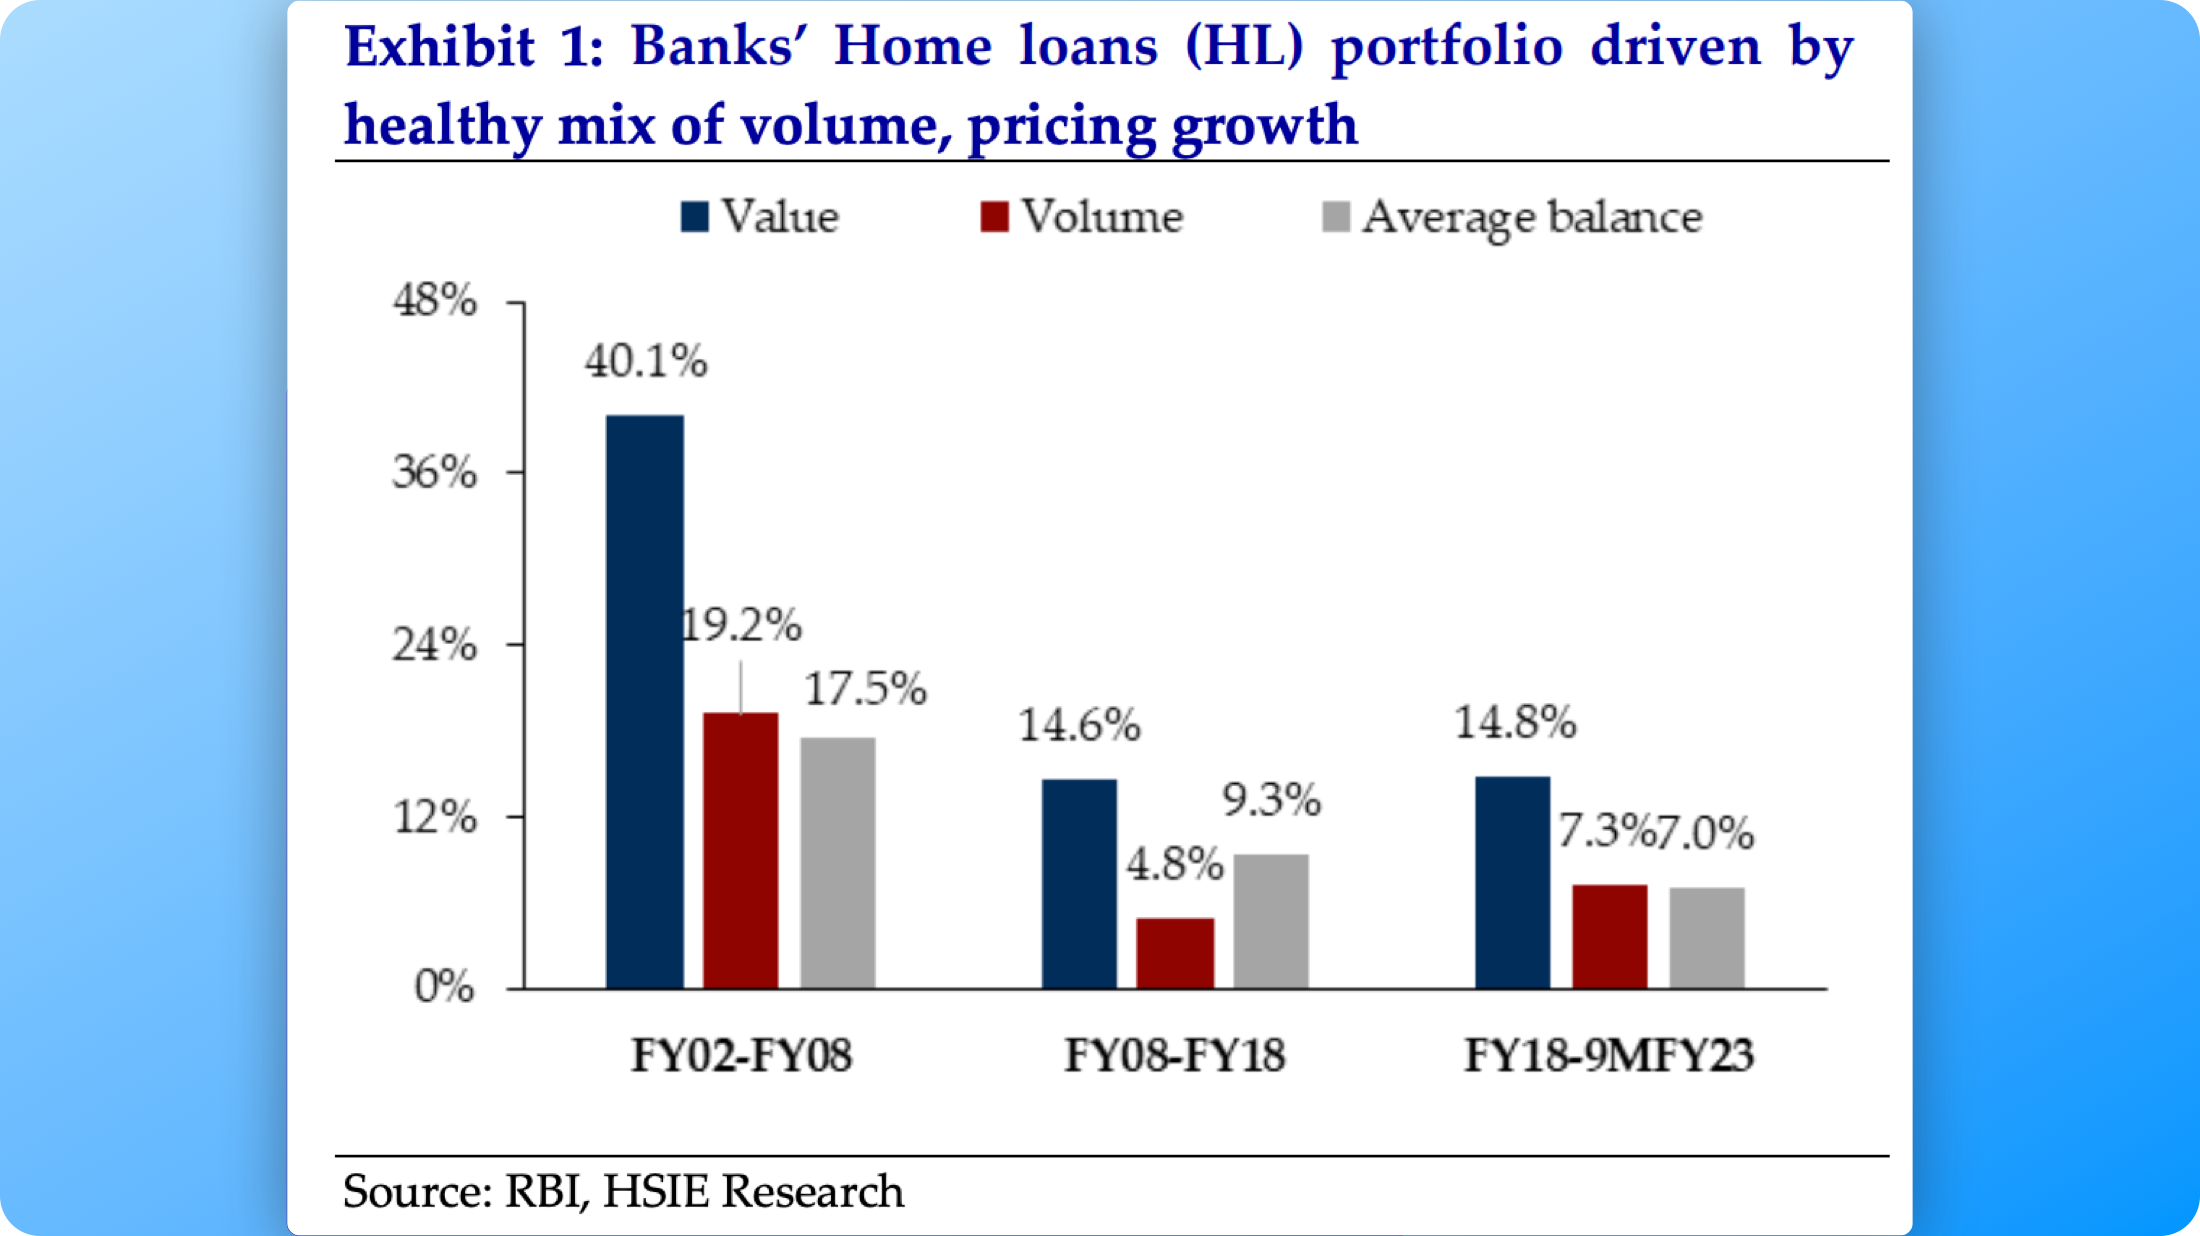
NOTE: The above data pertains to only Banks.
Volume is simply the number of loans disbursed and Value is the Avg. Ticket Size (ATS)
Not surprisingly, the volume of lower-ticket Home loans is higher but in value terms, it is much lower.
For Example, In FY23, around 42% of the loans disbursed (in numbers) were under 15 Lacs but in value terms, they consisted of only 15%.
And not surprisingly, While Banks are dominant in the higher value / lower volume segment, Affordable HFCs dominate the “affordable housing” segment.
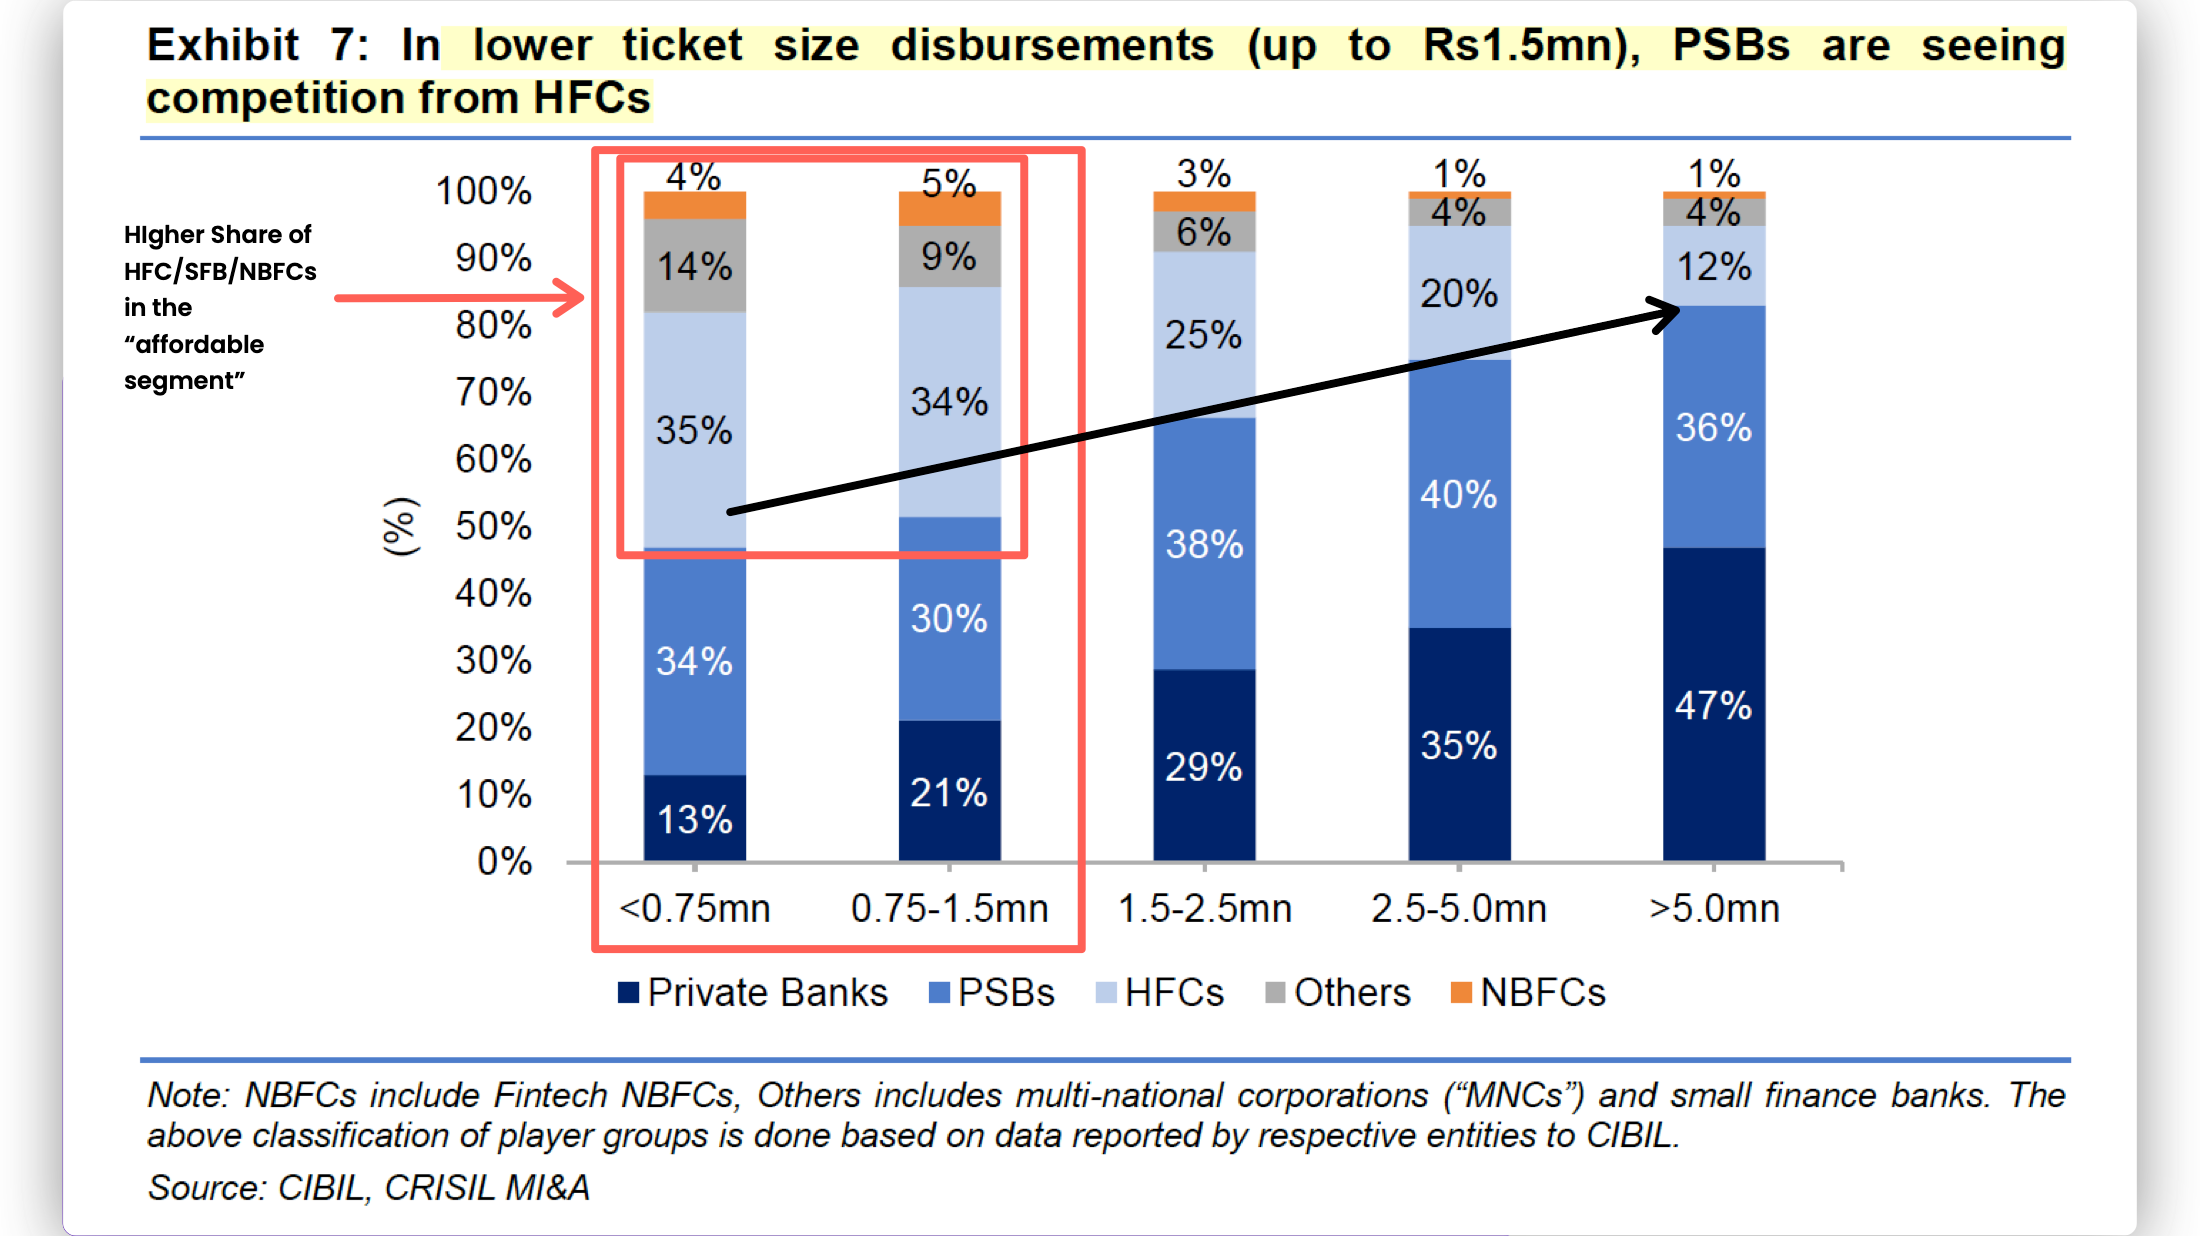
This is a result of a peculiar problem HFCs face.
Although the “TAM” in the Housing Loan market is large, HFC growth is constrained by this ‘Glass ceiling’ set by ATS.
To Grow they must (or have to) grow their ATS but if their ATS becomes large enough, banks are waiting to eat their lunch (Remember: Banks can offer lower interest rates)

Even HFCs can be further segmented as Larger HFCs and Smaller ones - Affordable HFCs.
Sandwiched between the Banks & Affordable HFCs, are the Larger HFCs , which are getting sliced by Banks on the Top End and by AHFCs on the bottom end.
That’s precisely why you’ll notice that while Home Loans continue to grow at a robust pace, Larger HFCs growth has moderated (CanFin, Indiabulls, LIC Housing, PNB Housing Finance).
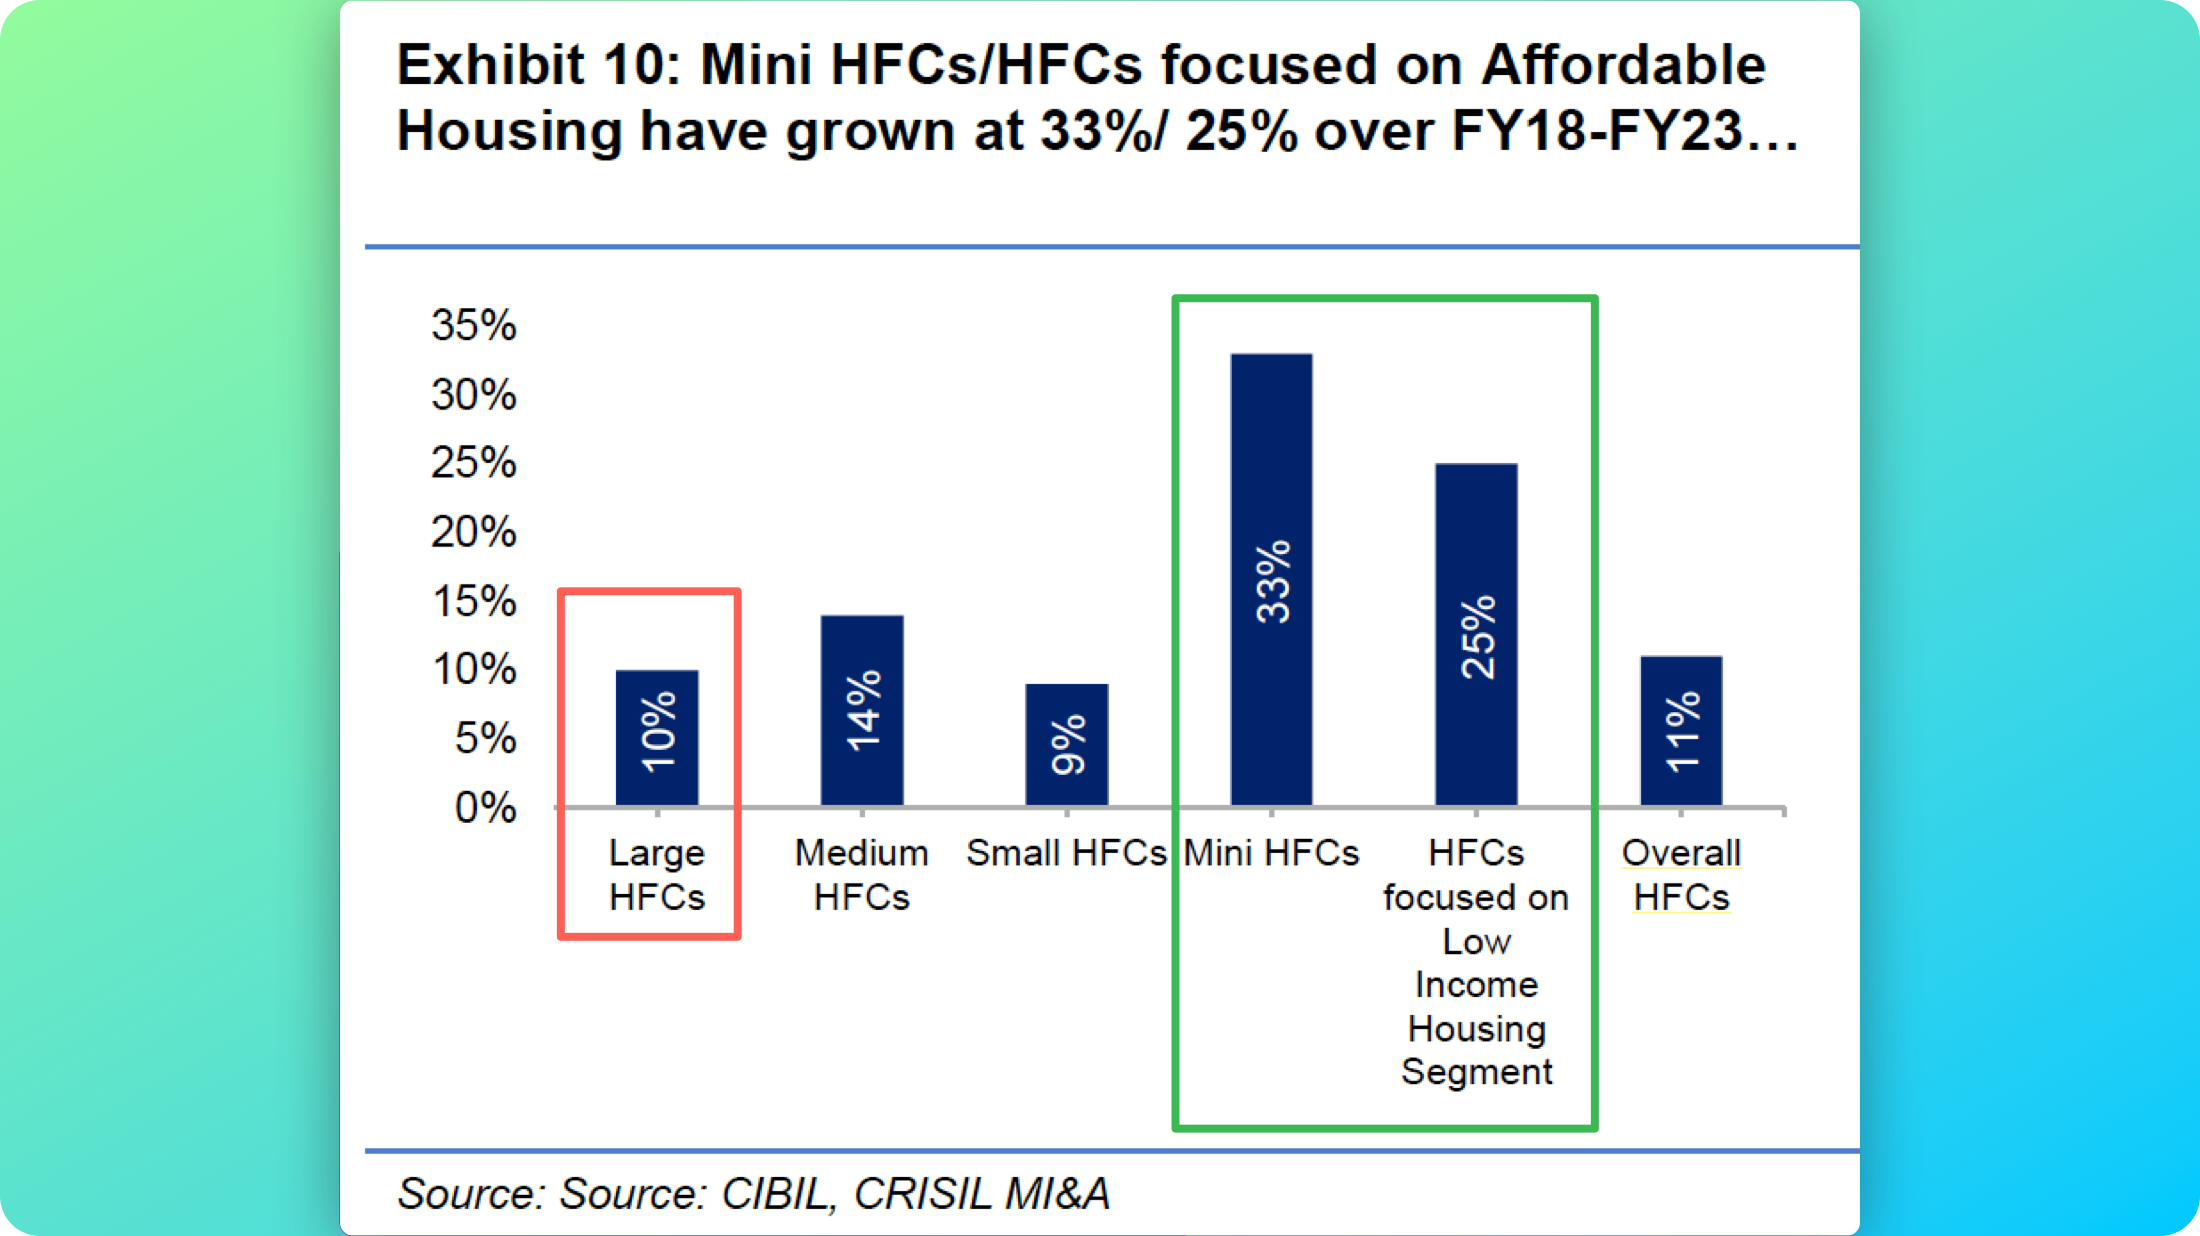
This is NOT the only reason for Slower growth experienced by Larger HFCs. In some cases, Fraud and Gross Mismanagement is another .
Amidst all this fighting for a place in India’s robust Home Loan Market, Smaller HFCs i.e - those focusing on ‘Affordable housing’ have emerged as a source of high growth albeit with higher risk (we’ll learn more soon)
But I do NOT discriminate based on Size! And that’s why with the above context we’re going to do a quantitative analysis of 15 Listed players in the Indian Home Loan Market.
A Quantitive Analysis of 15 Listed Housing Finance Companies in India
First, let me introduce the contenders :
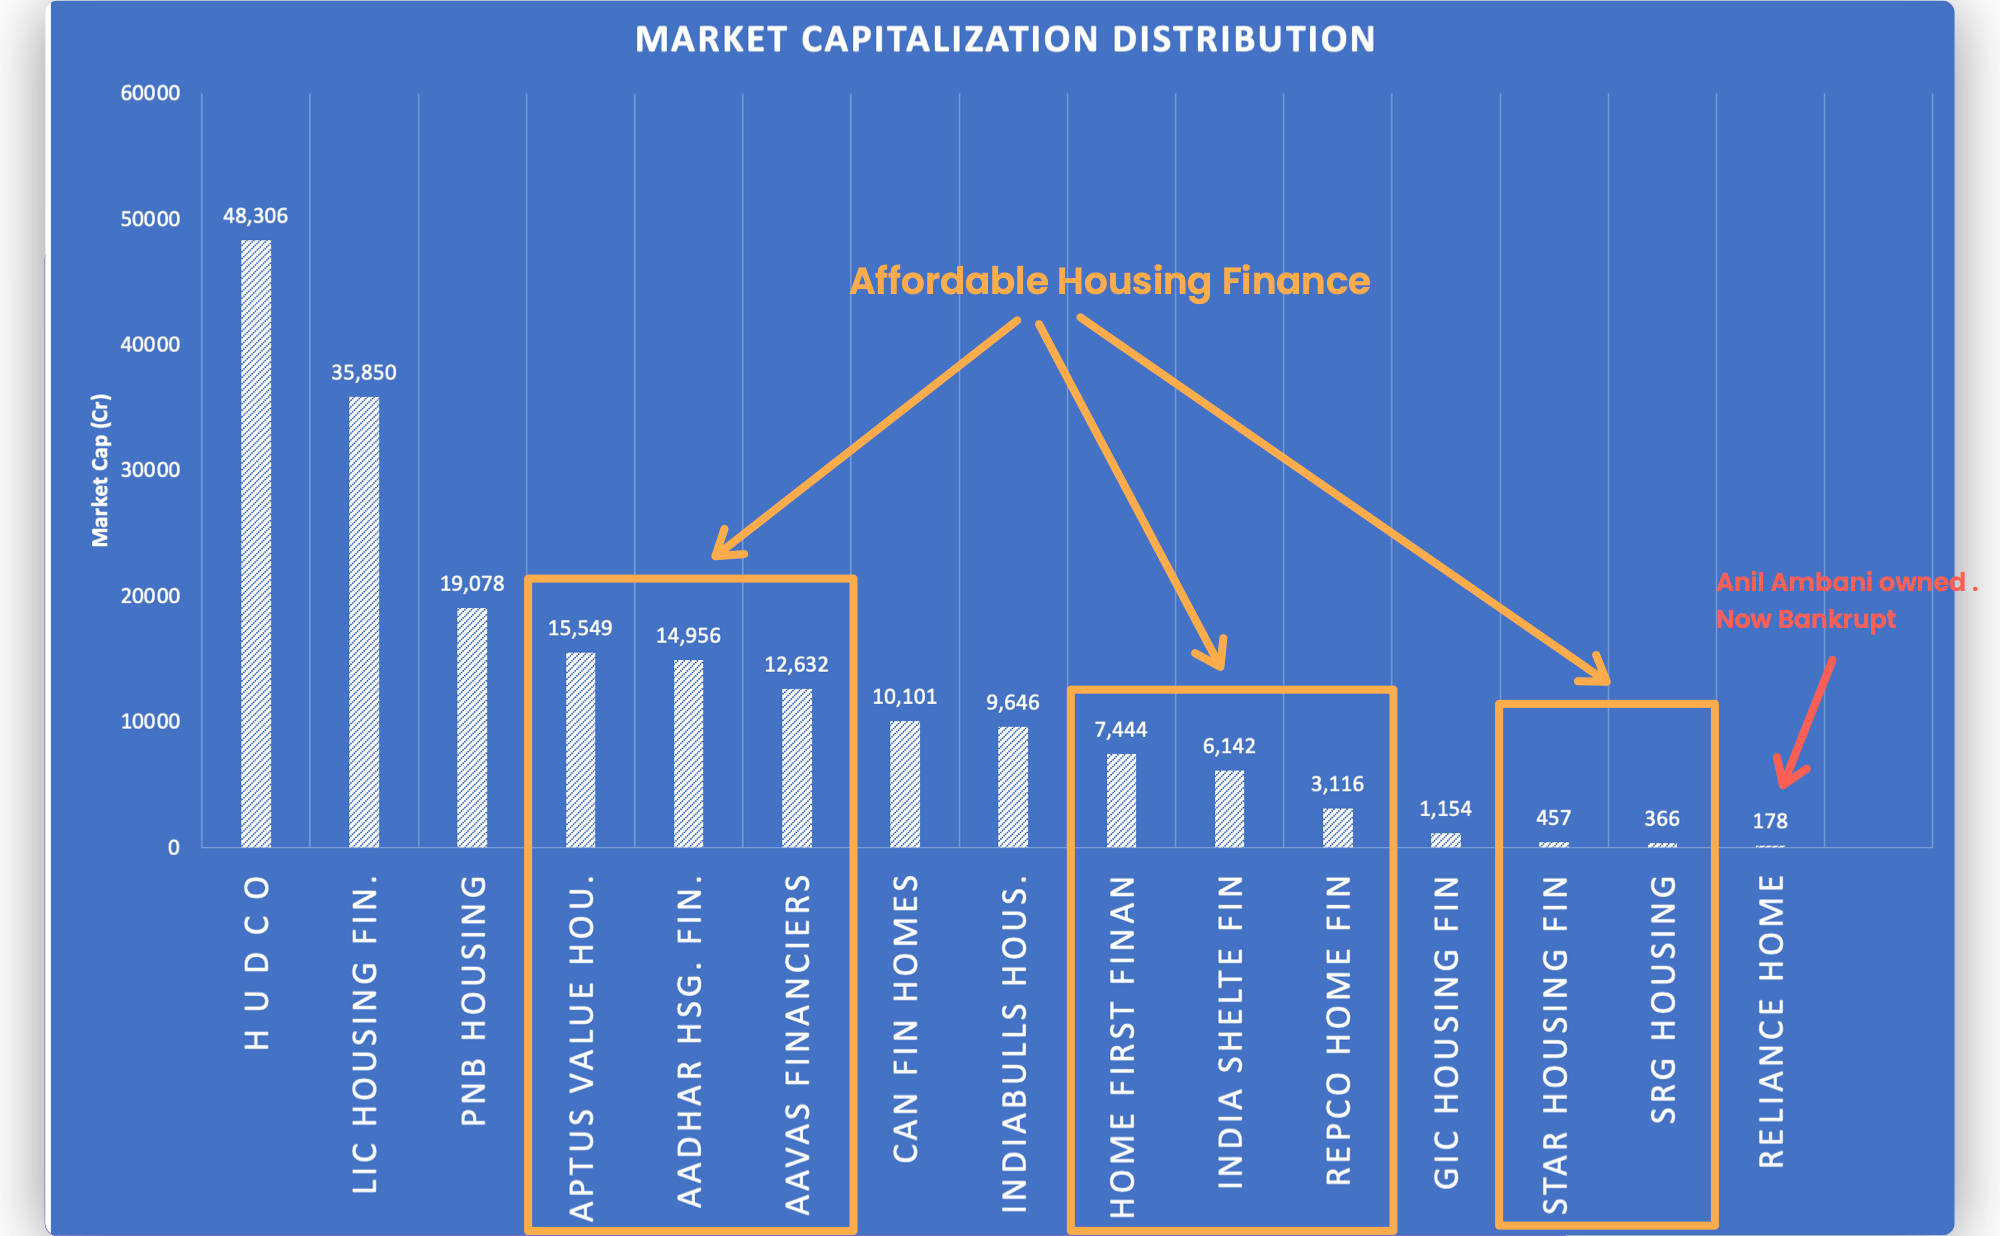
Of the 15 HFCs shown above, 8 operate in the Affordable HL segment , out of which Aadhar Housing Finance and India Shelter Finance are recently listed.
And the remaining are larger players as measured by ATS - Avg. Ticket Size.
Next, let’s see how they have fared across cycles in terms of Asset Quality.
- Gross Non-Performing Assets (%)
While it is true that Housing and Gold are possibly the safest lending segments given the presence of valuable collateral, and that Write-offs (actual losses) are a very small percentage of GNPA, the market ascribes valuation multiples (P/Bx) based on the lenders’ ability to maintain Good asset Quality (amongst other factors such as Growth & ROE)
“Good” is defined by what the best players can achieve “over cycles”
We can broadly categorise the Listed HFCs in our pool into 3 NPA buckets as shown below.
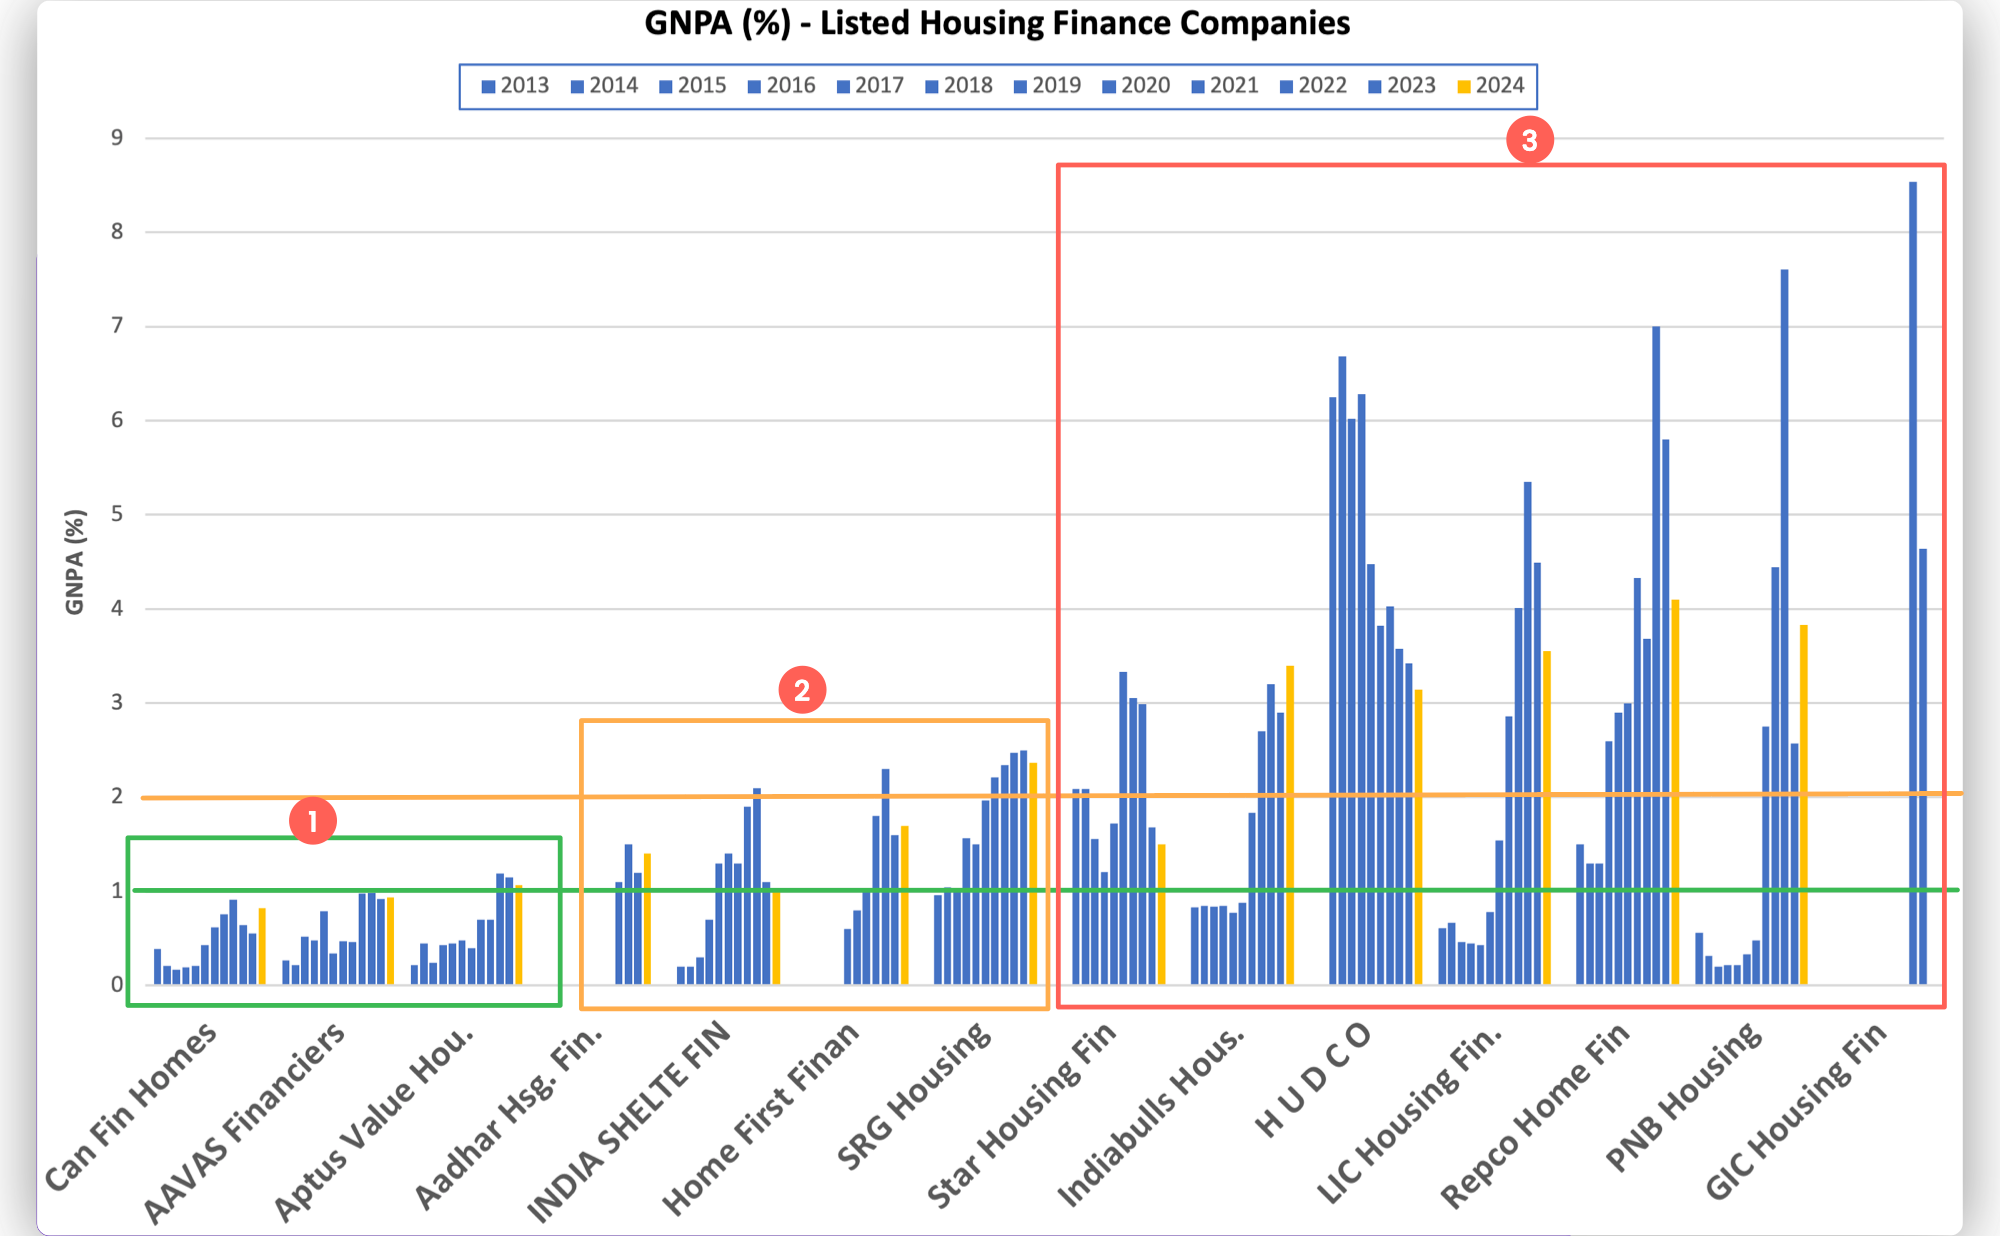
The A Players consist of - Can Fin, Aavas Financiers, and Aptus
The B Players - Aadhar, India Shelter finance, Home First & SRG Housing.
And The remaining lot - C Players.
But NPA ratios are not the only way the market values Lending Institutions. The directional change, the absolute levels vs peers and the extent to which they impact ROE is what matters.
- Return On Equity (%)
8/14 HFCs have managed to expand their ROE over the preceding year.
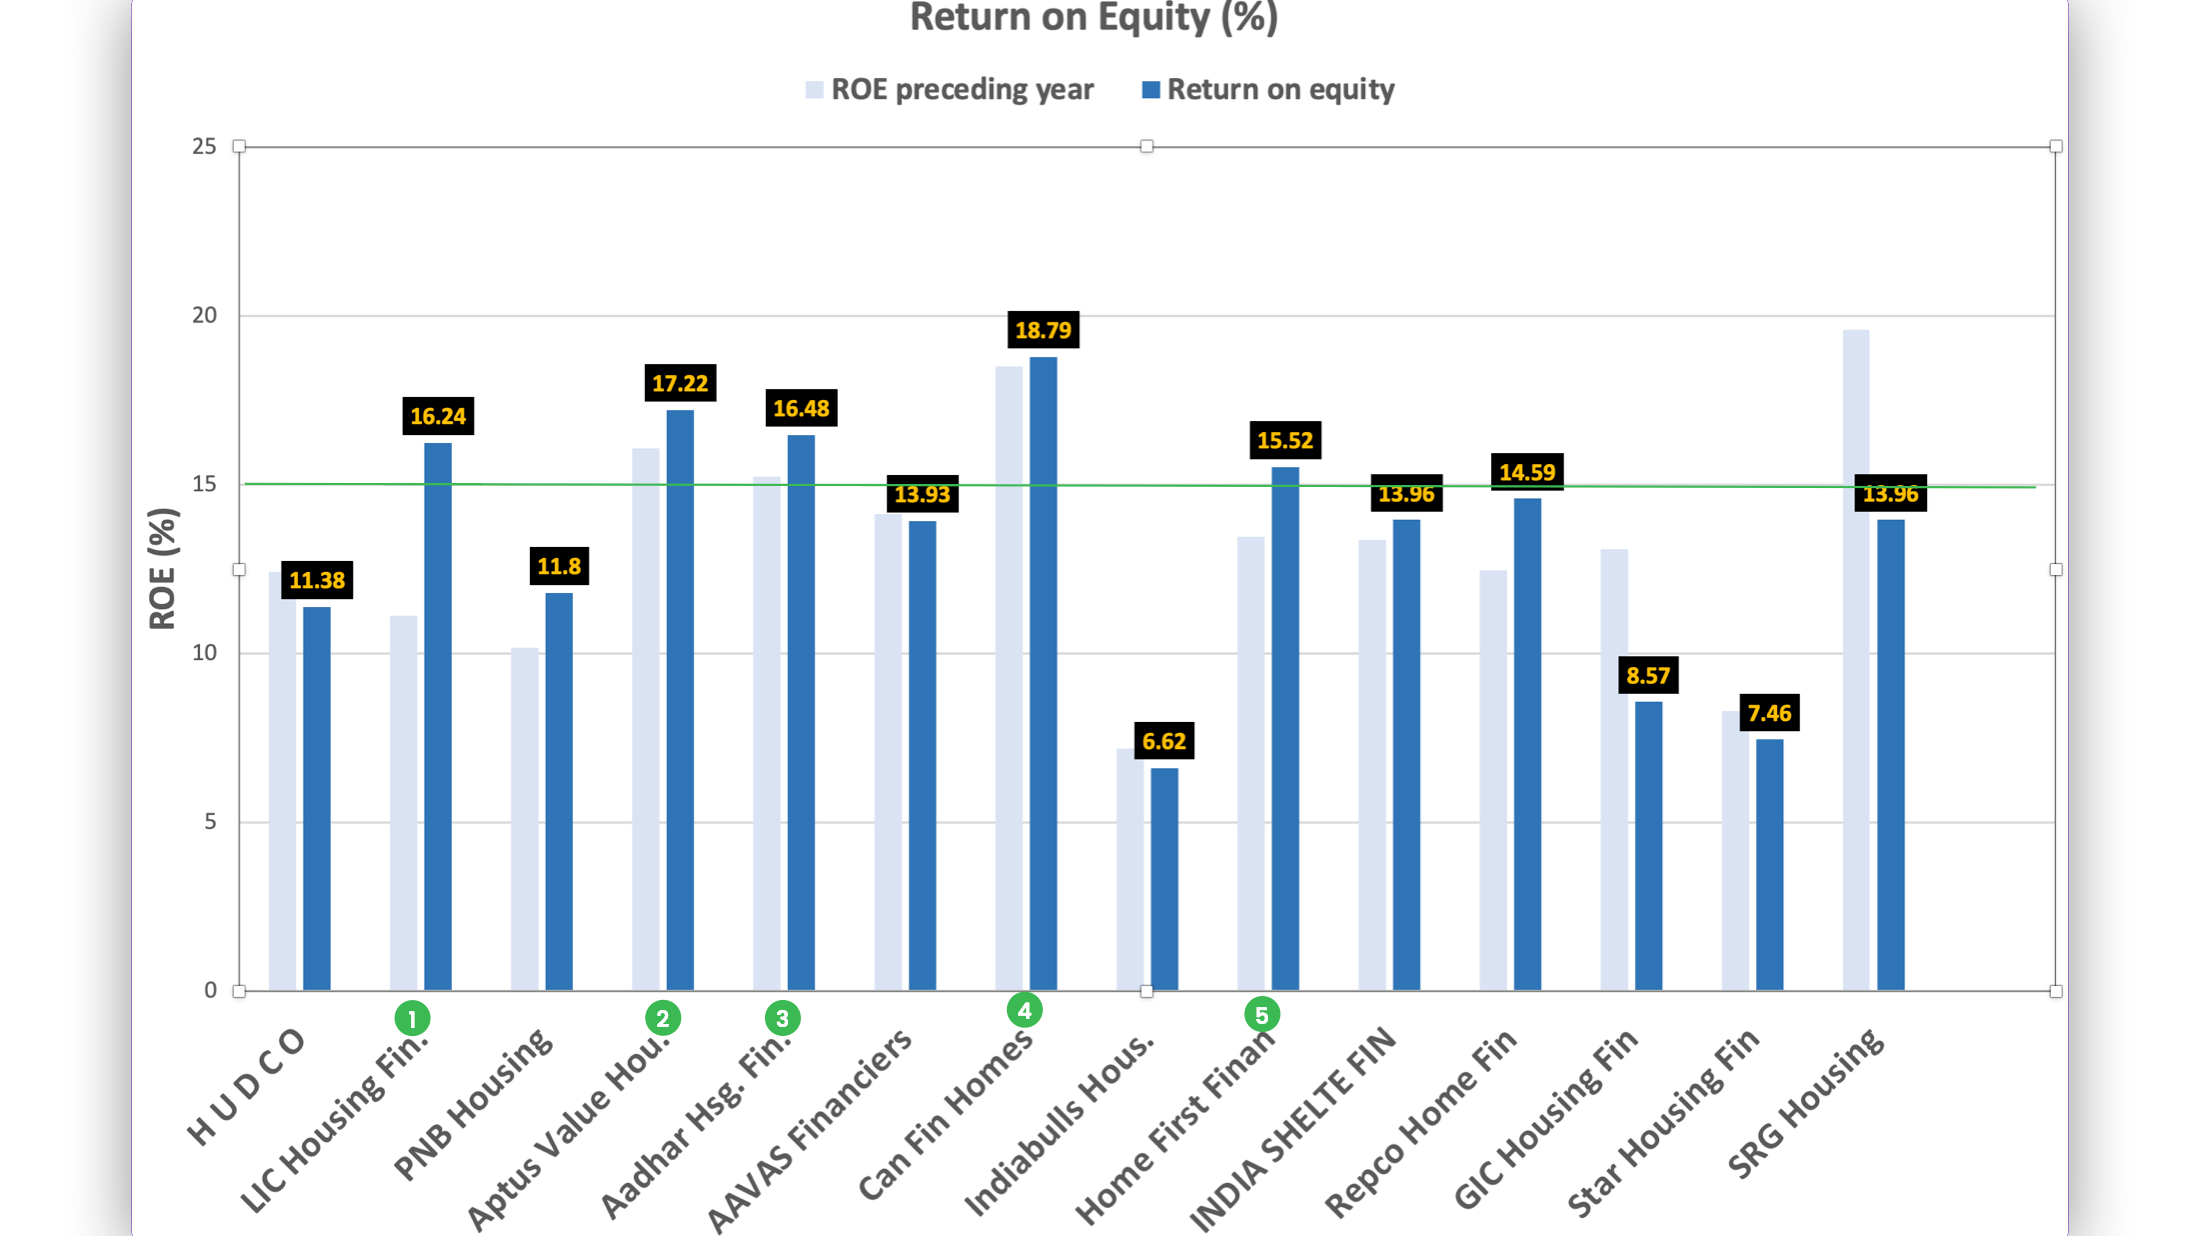
but only 5/14 have remained over 15% in FY23/FY24.
The A Players (by GNPA) also enjoyed 15% + ROE.
The Exception was Aavas Financiers. In fact, Aavas has never hit an ROE of 15% since it got listed in October 2018 but despite that has enjoyed steep valuations for most of its trading history, mainly because of High consistent growth and Pristine Asset Quality.
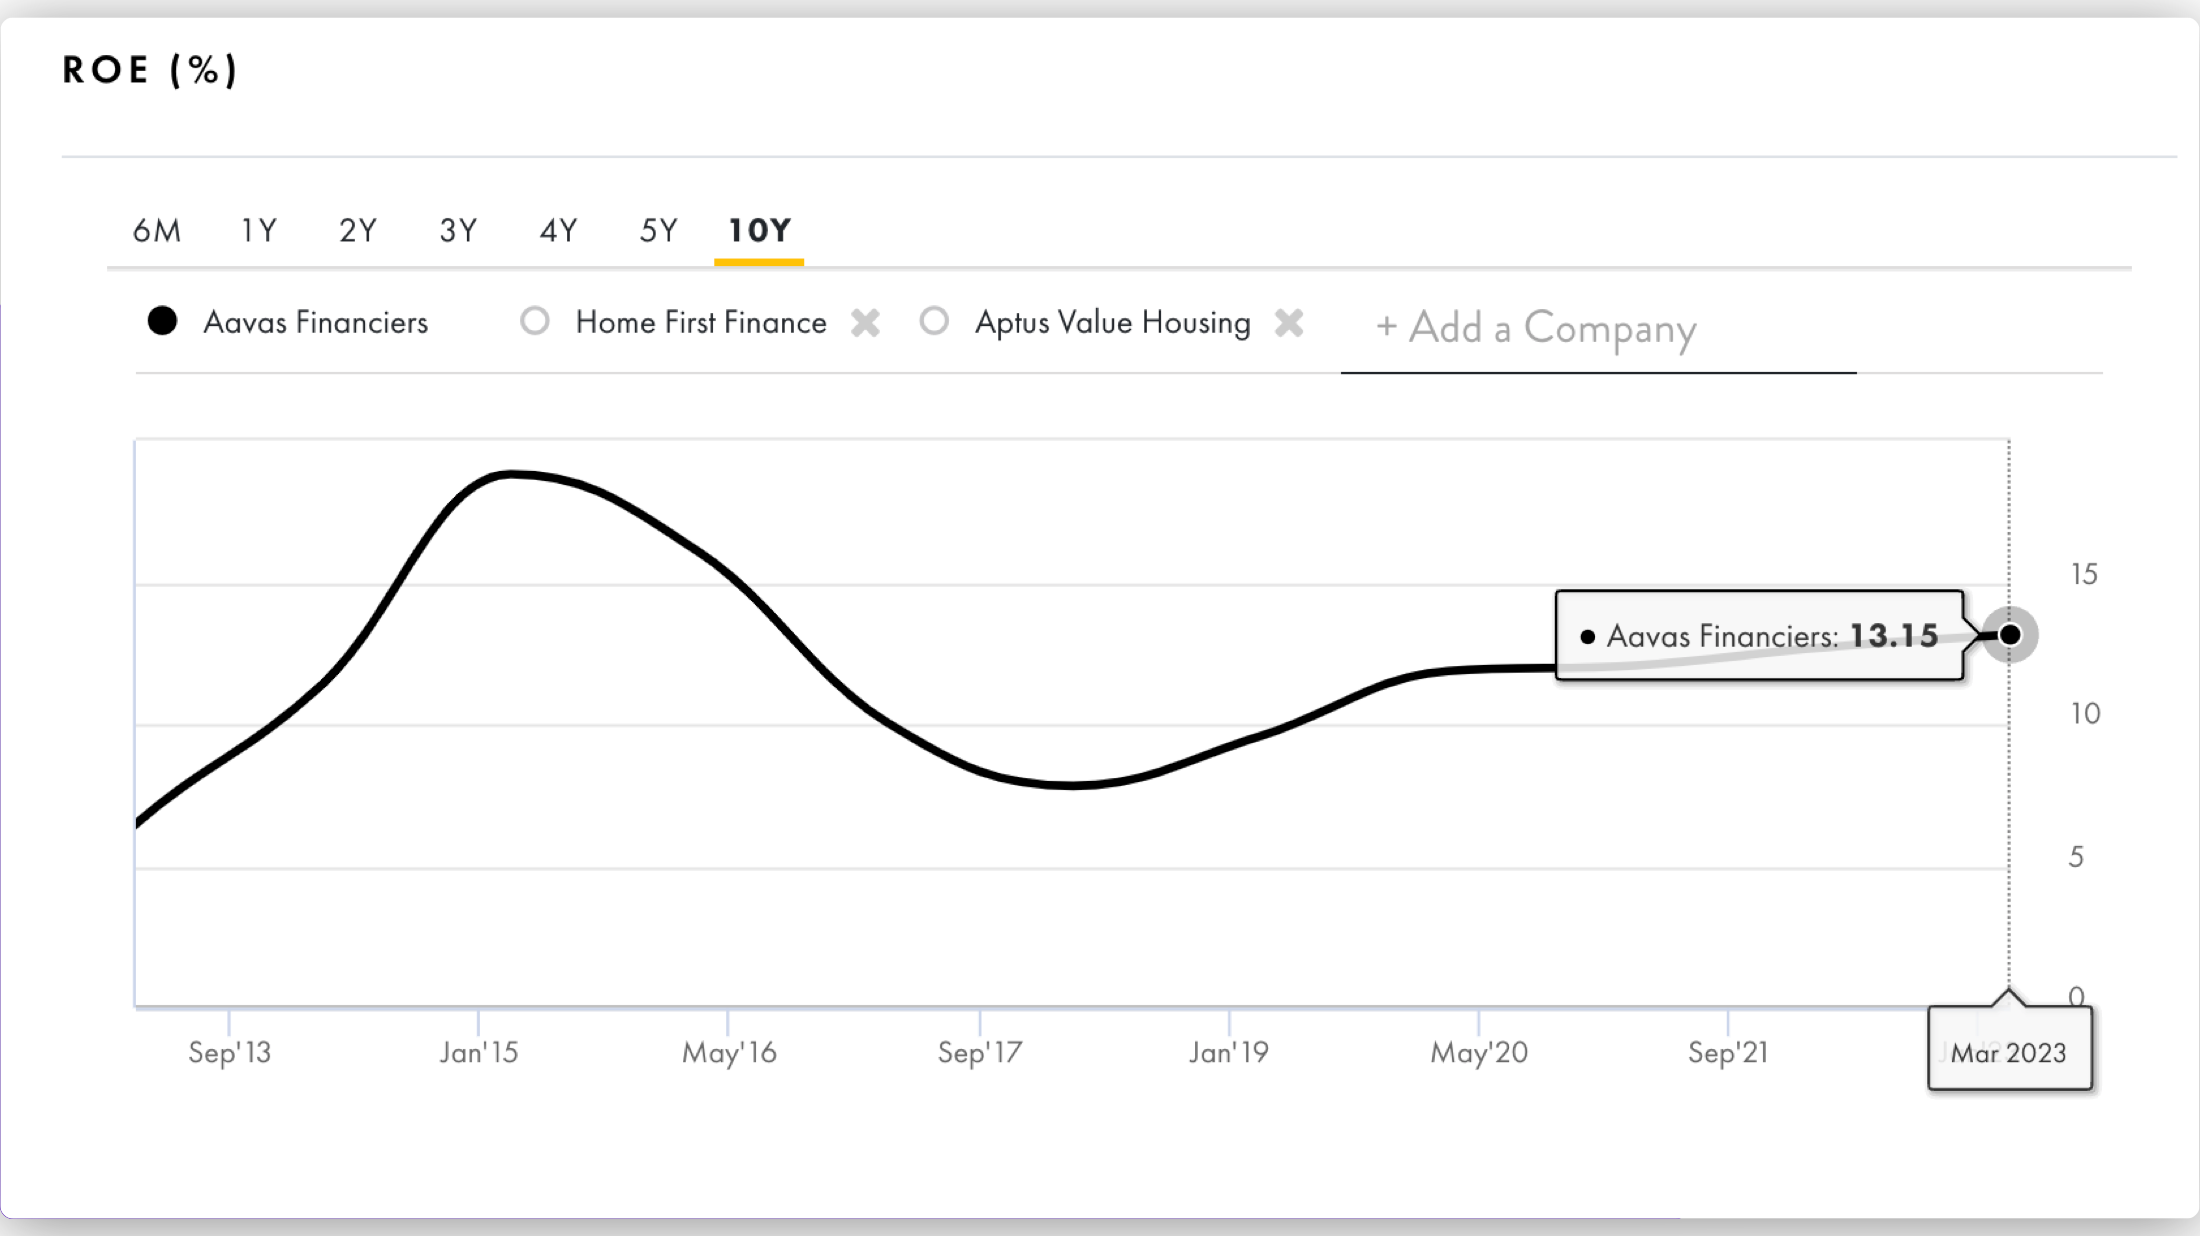
Currently, however, because of a combination of factors (Top Management Exit, PE Firms exiting, lower disbursement growth etc) Aavas currently trades at a valuation that is cheaper than it was during the crash of March 2020.
Which raises an interesting question !
Should we conduct an ‘Aavas Financiers - Deep Dive’?
- Yes
- No
0
voters
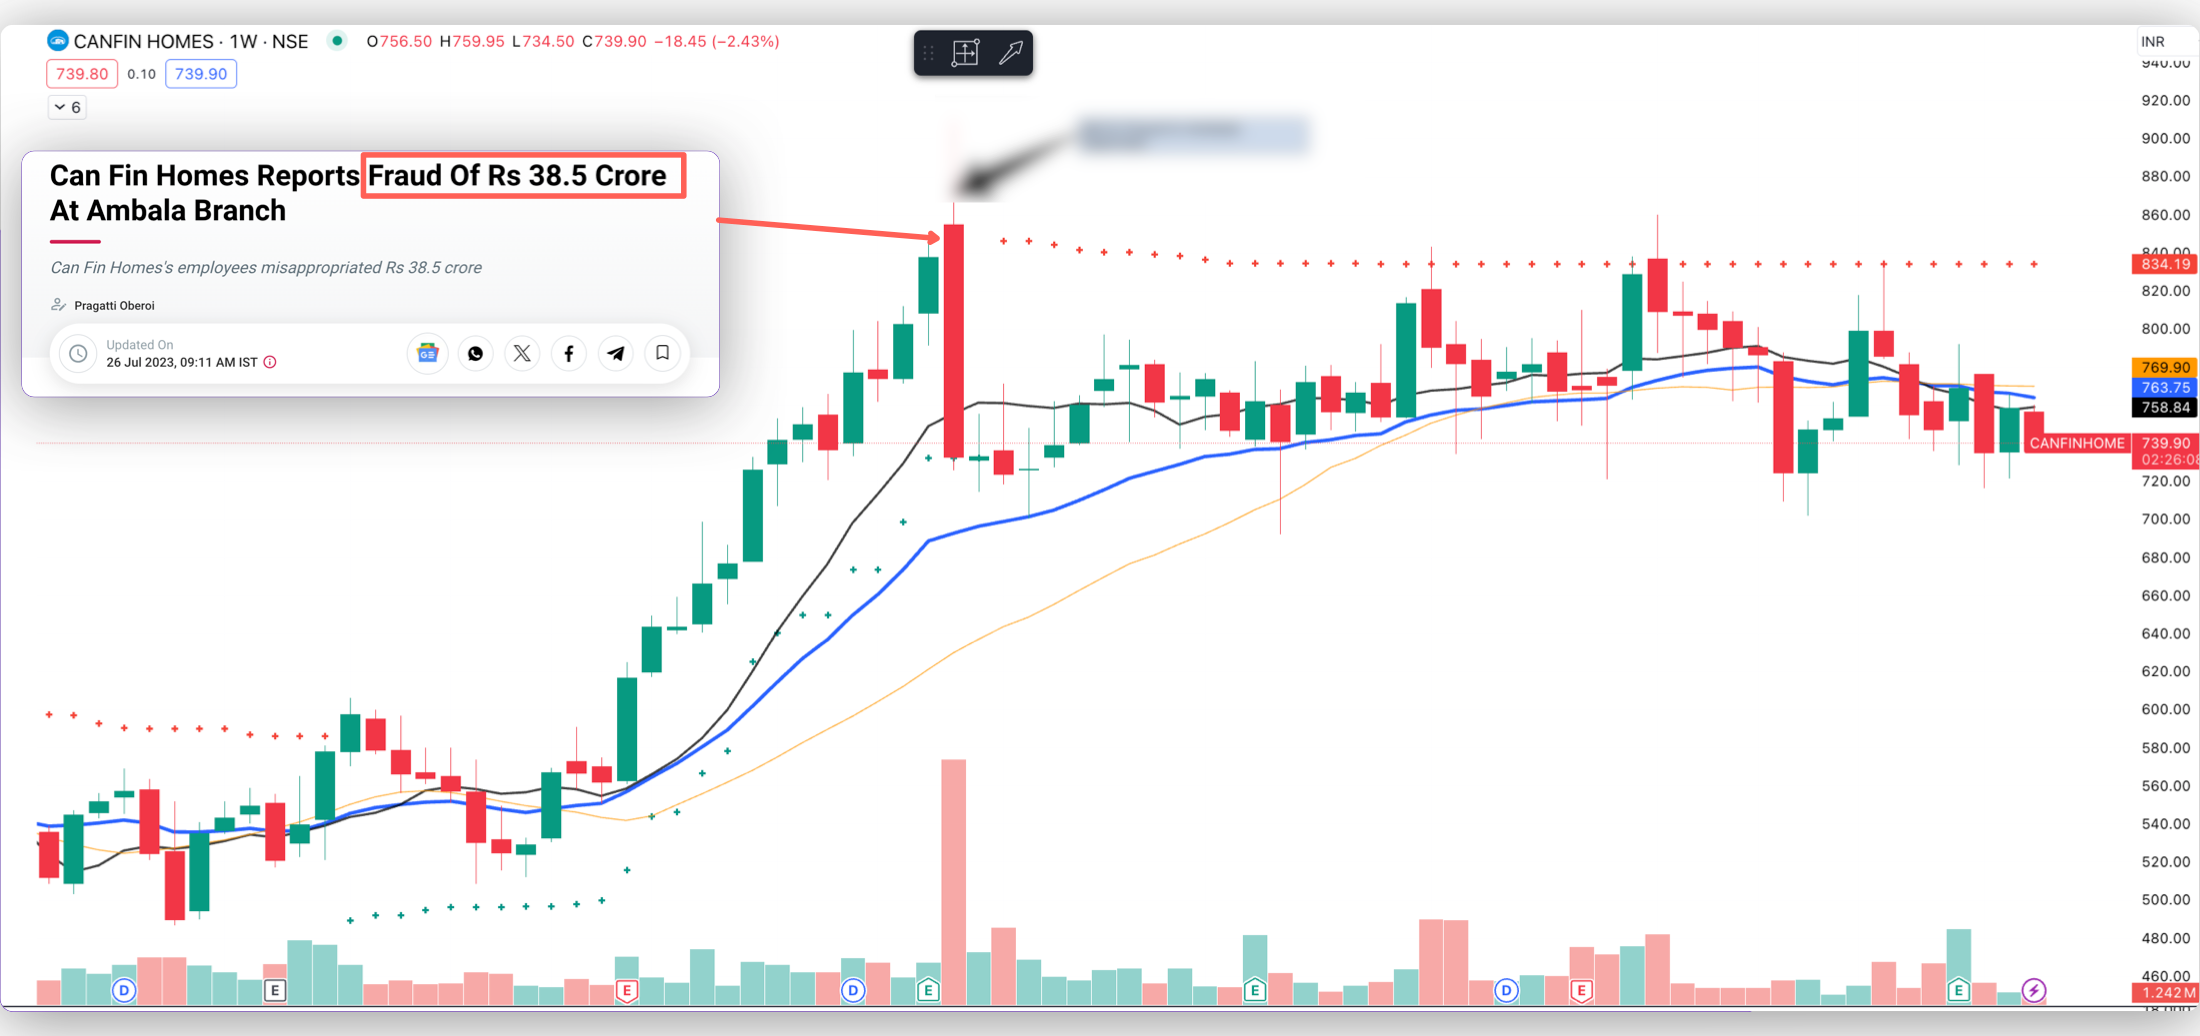
Can Fin Homes is another player with Stellar GNPA history. It also has the highest ROE among the pack. However, the problems plaguing CanFin are twofold :
A. Growth - With an ATS of ~25 Lacs, it is competing with Banks and other Large HFCs - LIC Housing, PNB Housing, Bajaj Housing etc.
B. CEO change and Weak Governance - There was an incidence of Fraud in Ambala about 1 year back, post which the stock crashed and has been trading in a range since then. P/B went from 3.1X (July 23’) to 2.3X today.
As for Delta in ROE, which in my view can be an important predictor of generating Alpha , here’s the table.
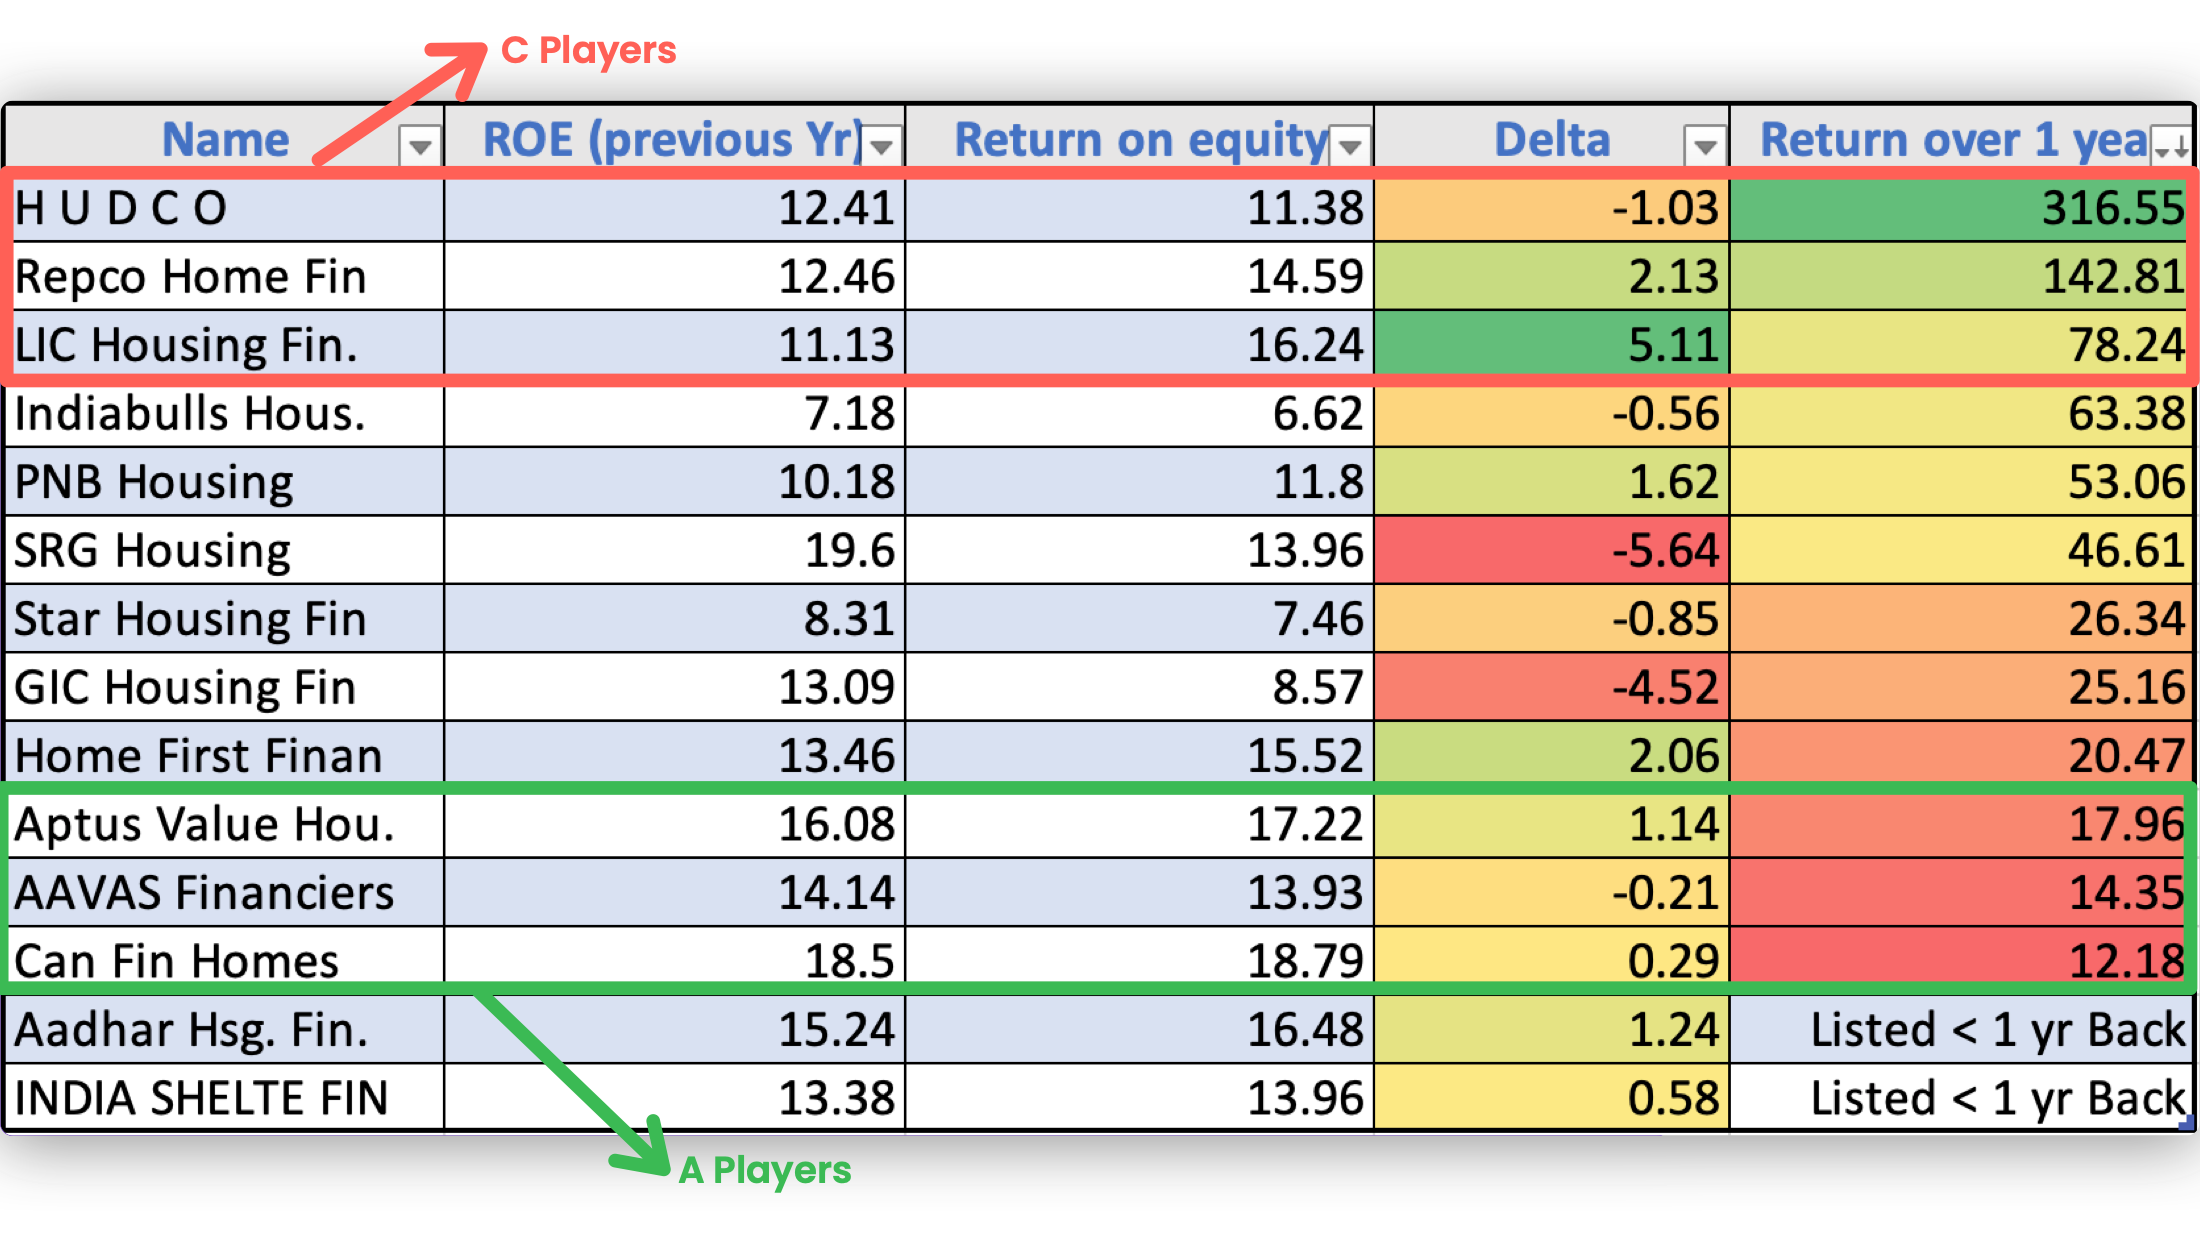
Notice something Interesting?
The worst players by Asset Quality offered the highest returns (Last 1 year) and my hypothesis for why that is the case is because In a benign credit environment, GNPAs reduction leads to lower provisions and/or write-backs, both of which lead to outsized PAT Growth vs AUM Growth.
In the case of HUDCO, an additional idiosyncratic phenomenon might be playing out too - The PSU Bubble ![]()
Poor Starting valuations are also another factor.
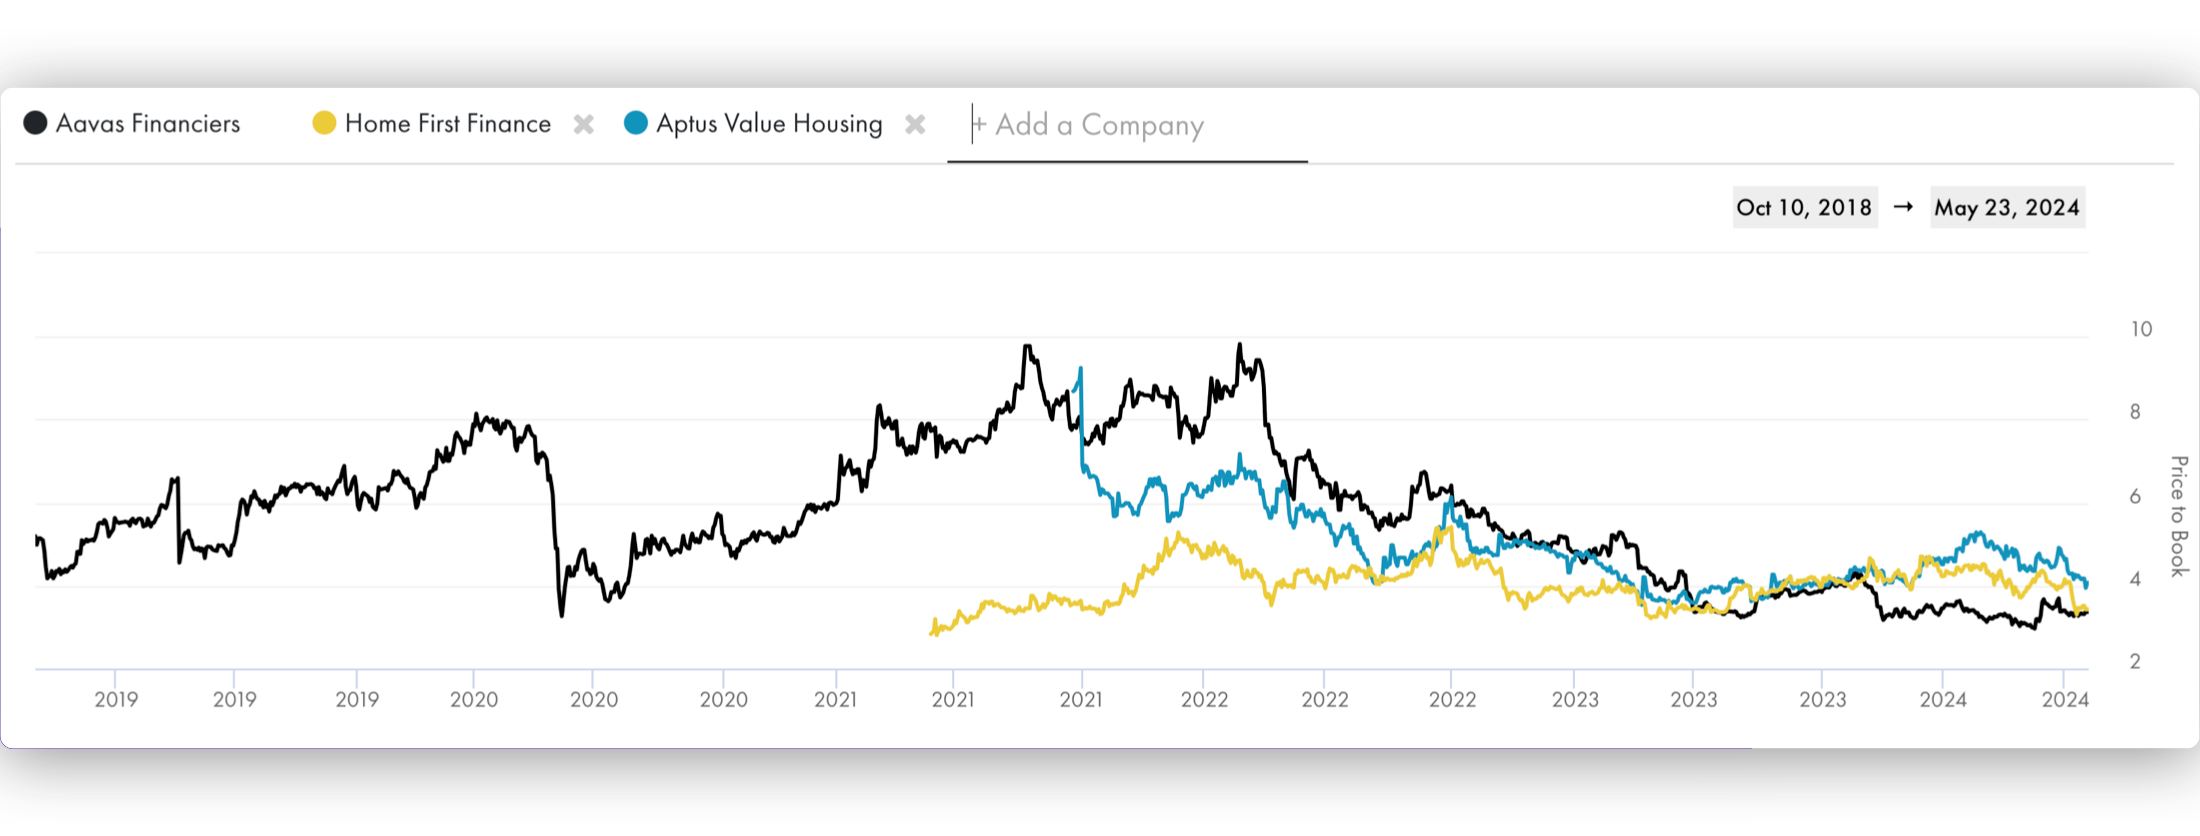
which raises the question, what are current P/Bx multiples? :
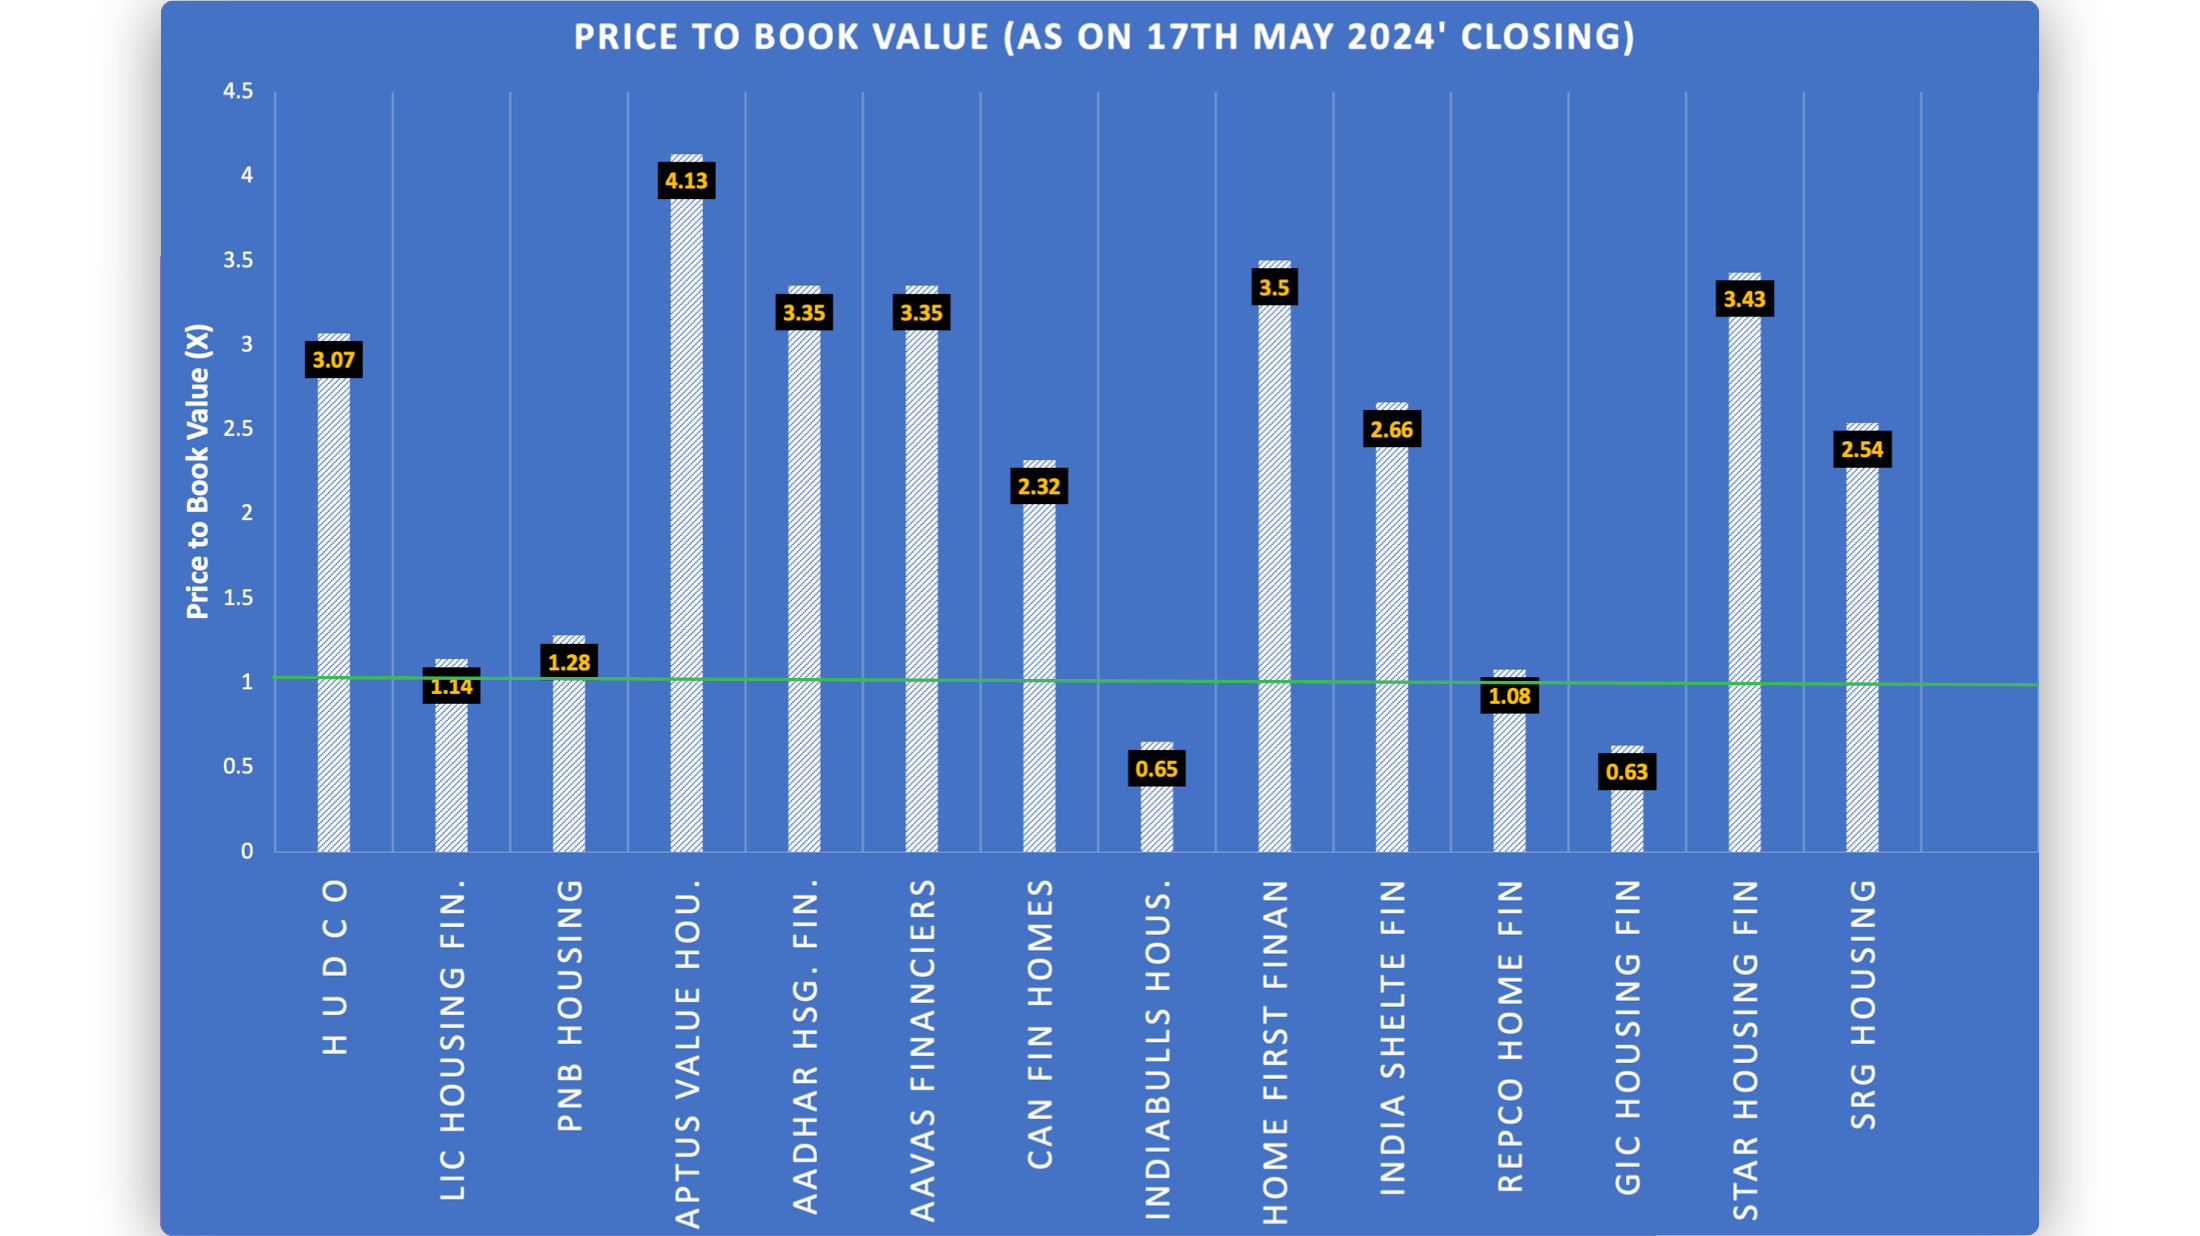
The P/Bx of 1 has been marked because Book value is meaningful for a Bank/NBFC/HFC as a metric for judging valuation (unlike for normal businesses).
Since the book value of a bank reflects the actual fair values of Assets and Liabilities (both are Marked-to-Market), a book value of < or close to 1 is considered ‘cheap’ and it implies that :
![]() There are Hidden Asset Quality issues i.e. Fair value of Assets (Loans) itself is Dicey.
There are Hidden Asset Quality issues i.e. Fair value of Assets (Loans) itself is Dicey.
![]() There will be minimal to No Growth.
There will be minimal to No Growth.
But with Banks/NBFCs/HFCs we are NOT just looking for cheaper valuations !
What we would prefer ideally is a combination of P/Bx of ~1 + an ROE of 12-15% (trending upwards) + improving GNPA + Improving Disbursement Growth?
So, with that context in mind, here’s a little homework for you.
Which co’ qualifies for the above metrics? Can you tell me in the poll below?
POLL
Would you like to guess which Co’ qualifies for the above metrics?
- LIC Housing
- PNB Housing
- Repco Home
- IndiaBulls Housing
0
voters
Also let me know in the comments WHY you picked the HFC you picked.
Hope this has been fun.
Rahul
First Principles Investing
11 Likes
Good inights, Rahul.
Thanks for taking the time to prepare this. I think HFCs deserve a separate thread of their own.
Let me chip in my couple of thoughts.
- The “A Players”, i.e. the ones which have good asset quality (GNPA ~1.5%), high ROE (~14-15%+) and low leverage (<4 times Debt/Equity) are mostly owned by PE firms, who entered in early stages and have navigated the companies to their IPOs.
For example, Aptus and India Shelter is heavily held by Westbridge, Aavas by Kedaara, Home first by Warburg Pincus (Orange Clove) etc.
These PE players are basically funds which have end of life. Until these PE funds are on the cap table, expect these companies to face constant bouts of stock supply and therefore, prices may remain compressed despite 25-30% AUM growth and pristine asset quality. At least that is how these A-player stocks are playing out for now.
- “B players” like PNB housing, LIC housing, Can Fin, etc. (I would also call Can fin a B player, because of its leverage and modest 15% growth, although it has strong parentage of Canara bank and very good asset quality) are fighting against inertia and their growth rates have never really appealed, Moreover, their leverage positions may give them lesser headroom for aggressive growth compared to A-players. All this shows up in their mid-teens AUM growth and moderate asset quality.
PNB housing might foray into microfinance under new leadership, Can fin homes might foray into digital transformation and risk management after Ambala incident, but give or take, these are 10-15% growers. Dont expect the moon from them.
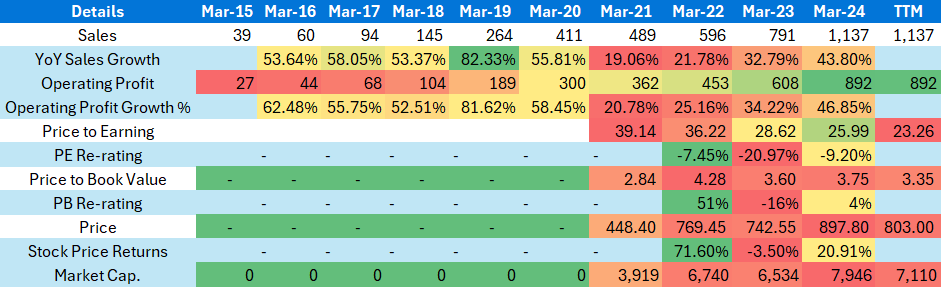
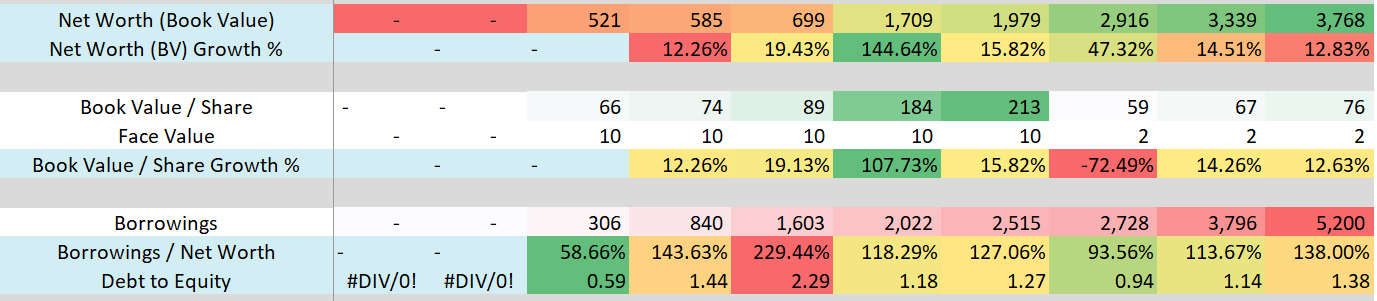
- Now come the underdogs, Hudco, Repco, etc. These are actually the “C Players” behaving like “A players” temporarily. when credit cycle turns, they have proven to disappoint a lot. Hudco for example, is known to trade at <1 PB and is now trading at 3.12 PB.
Here’s a look at Hudco at a high level:
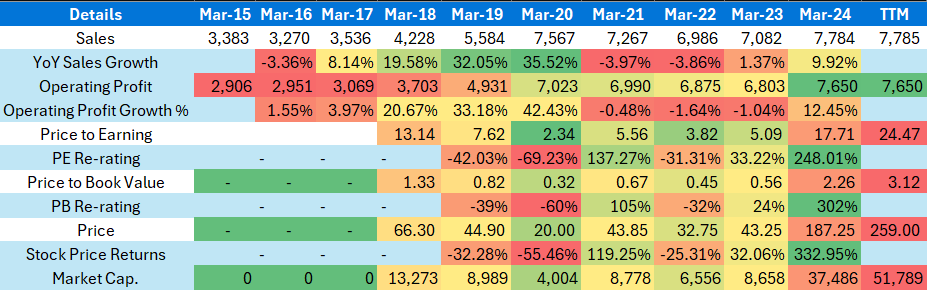
In FY24, Hudco’s topline has grown by 9%, operating profits have grown by 12%, however its PB is re-rated from 0.56 PB to 3.12 PB, a whopping 6x PB update. Naturally the price has gained 6x not much because of fundamental growth but because of re-rerating.
Take a look at an A Player, in comparison:
Home First:
Aptus:
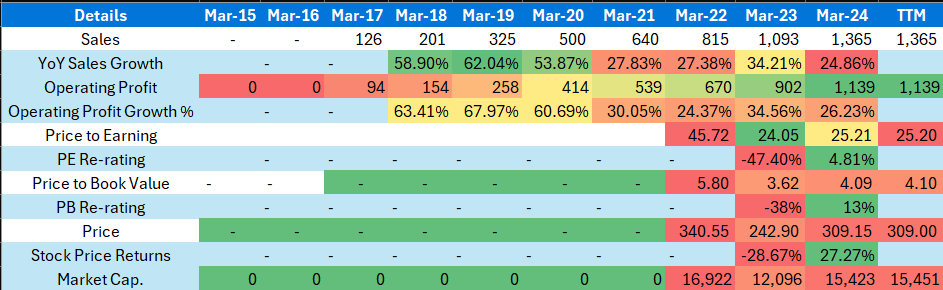
AUM and Book Value Growth wise, Hudco stands nowhere close to the A players:
Hudco’s Balance Sheet metrics:
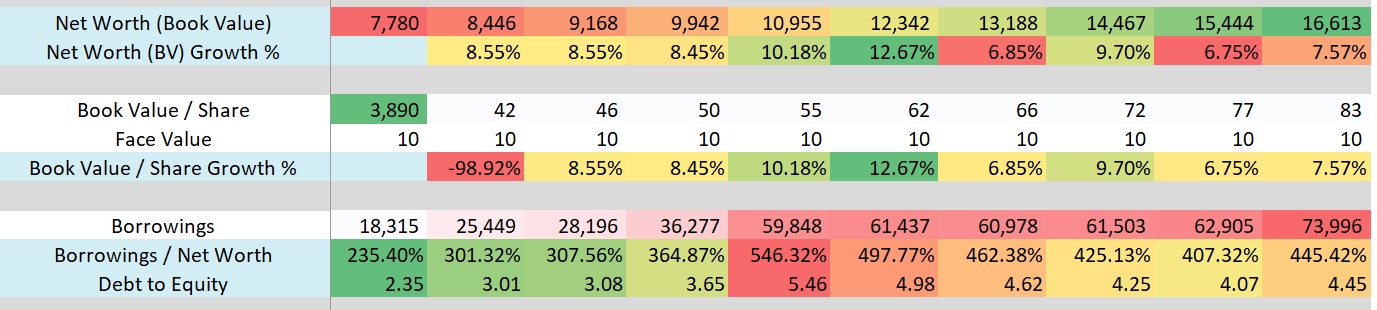
Hudco’s AUM growth (Derived):
Home First’s Balance Sheet metrics:
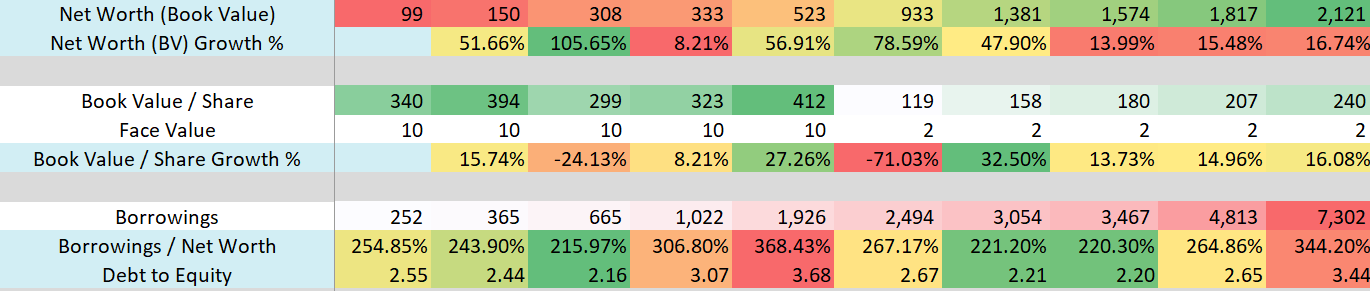
Home First’s AUM growth (YoY):
Aptus’s Balance Sheet metrics:
Aptus’s AUM growth (YoY):
Clearly, the A players have better balance sheet, less leverage, higher AUM growth, less delinquencies and credit cost.
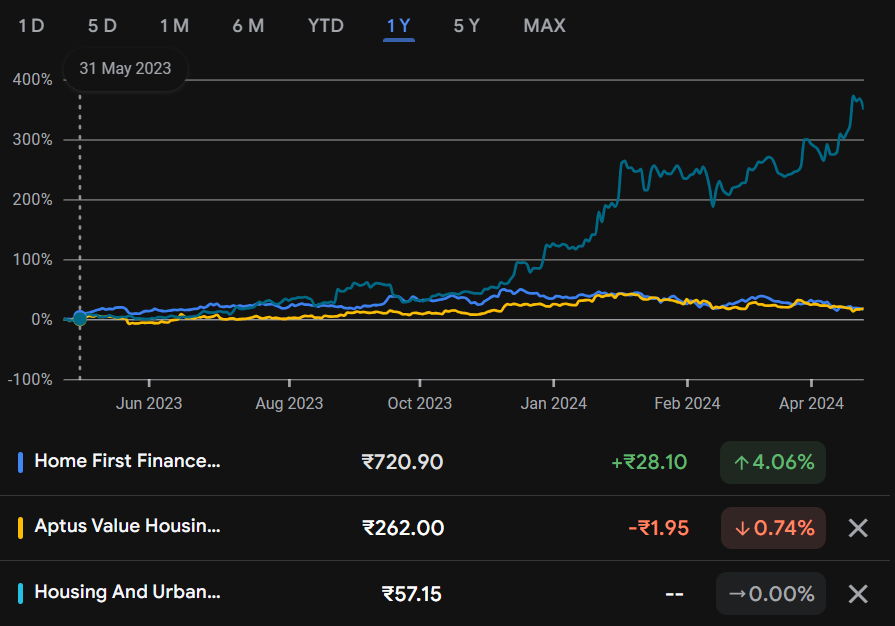
Now look at the price chart of Home first, Aptus and Hudco for last 1 year.

5 Likes
Can you please shed more light on this? Is the market anticipating that if the stock rises fast these PE firms will exit causing the stock to crash again?
1 Like
LIC HF may be good buy considering the sales of 27k cr. None of the other HFCs are nowhere near this sales figure. At P/E of 7.x, this may be attractive buy.
3 Likes
I was looking for buying an apartment. What I found is SBI has the strictest scrutiny while giving loans and lic hfl was the most lenient. The builder was having agents who can get me loans from lic hfl for flats which were not in the approved plan.
With this kind of behaviour, how can lic hfl have good assets?
Disc: No holding on lic. Just watching the space.
1 Like
Interesting. Good to know this fact. Probably lic hfl is trying to increase loans desperately.
1 Like